In this blog series, we shed some light on our marketing approach at TNW through Web analytics, Search Engine Optimization (SEO), Conversion Rate Optimization (CRO), social media, and more.
We all want a fast experience on the web to make sure users can easily access all the pages on a site. For most sites that’s made harder because they’d like to know more about your visitors (web analytics) and want to monetize traffic through ads, like we do at TNW for example. All additional features you want, will in one way or the other slow down your pages. A while ago I presented on how we manage site speed at TNW. Here are some insights in how we’re dealing with this:
How are we monitoring site speed?
- Google Analytics; is a great source for all your web analytics data, including speed. It helps produce better insights into how easily users access your content.
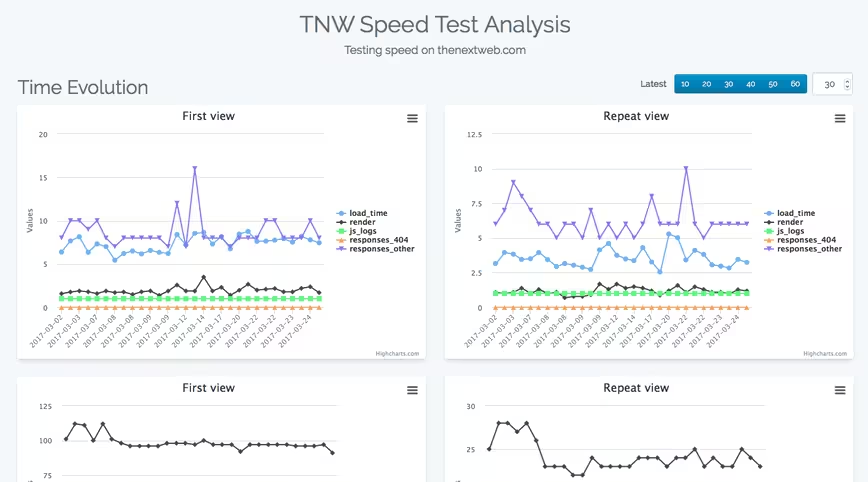
- WebPage Speed Test / TNW Speed Test Analysis: WebPageTest.org is in our opinion one of the best tools on the web for measuring site speed as it provides you with deeper insights and an easy flowchart with what scripts are triggering new ones. Something that Google Analytics doesn’t provide you with. In addition to that, we’re using their API to trigger a new test on every deploy we do for insights into how a code change affected our site speed.

- Google PageSpeed Insights: Great for checks that you need to do on request and to get a more high level sense of what’s not going right in terms of speed. Mostly used in addition to the other two.
Why averages don’t work: local v.s. Global?
Most people will load their site in a browser, check in the console how long it took to load the DOM, and that’s it. That works with a global site, but it doesn’t provide you with a clear picture. A lot of countries have varying internet speeds and due to different devices that’s making it even worse. That’s why for most tools we need to know how sites perform in different countries/regions. As an example, we’re around 20-30% slower in Brazil, even though we have the same site there. The larger adoption rate of mobile devices and average lower internet speed in Brazil makes it harder for us to load the site fast. We’re working on that in multiple ways, but we can’t ignore the fact.
How are we improving this?
Prefetch/Prerender: We’re always loading tools like Google Analytics and Google Tag Manager so it makes sense that we would like to preconnect and prefetch the requests that we can do to them. By doing this, we can make sure we’re saving time in doing the server handshakes between us and them, shaving off around 0.1-0.2 per page load. Just by adding a few more lines of HTML.
AMP: We embraced the AMP Project right after the start to make sure that we could provide a better experience on mobile. Currently the pages supported by AMP do around 20% of our traffic.
Caching: We’re a pretty static site, we mostly serve content and don’t have too many back-end systems that could prevent pages to load easily. That’s why we’re caching most of the content you see on a page, either by making sure the article you read doesn’t have to be retrieved from our database over and over again, but also in the recommendations on the right side. They don’t change minute to minute, which makes it faster just to cache them for a few hours, saving on database requests and a slower (database) server overall.
Lazy Loading: You love our images, don’t you? We do too, but in most cases they can slow down the pages significantly. That’s why we’re using a lazy loading technique to make sure we only load the image when it’s in your view, shaving off probably around 0.5-1 seconds on the initial page load.
GIF vs Video: In addition to images, we know you like GIFs even more. The problem there is that most cool GIFs are extremely large and because of that harder to load (definitely on mobile devices). We’re making sure that GIFs are converted to a video format, this decreases the file size and also makes sure that the image/video will play nicely.
These are just some of the tactics we’re using to optimize for site speed. There are many more…
What’s next?
Currently we’re making sure that the number of trackers that we’re using doesn’t get out of hand. We have many advertisers that want to track their performance (on a post to post basis). While at the same time, we as a marketing team would like to know more about our visitors. By maintaining the right balance we’re making sure that nothing will be harmed.
If you missed previous posts in this series, don’t forget to check them out: #1: Heat maps , #2: Deep dive on A/B testing and #3: Learnings from our A/B tests, #4: From Marketing Manager to Recruiter, #5: Running ScreamingFrog in the Cloud, #6 What tools do we use?, #7: We track everything!, #8: Google Tag Manager , #9: A/B Testing with Google Tag Manager, #10: Google Search Console, #11: 500 Million Search Results and #12: How are you engaging with this page?, #13: Supporting Schema.org, #14: Calculated Metrics in Google Analytics, #15 How TNW uses Google Optimize 360, #16 Using Google Tag Manager in AMP, #17 50+ Custom Dimensions in Google Analytics
This is a #TNWLife article, a look into the lives of those that work at TNW.
Get the TNW newsletter
Get the most important tech news in your inbox each week.


