In this series of articles, I’d love to shed some light on how The Next Web approaches marketing through Web analytics, Search Engine Optimization (SEO), Conversion Rate Optimization (CRO), social media and more. This time around, we’re focusing on the A/B tests that we run to find out what encourages users to click more on certain elements and how those results measure up against our expectations.
If you missed the previous posts in this series, be sure to check them out: #1: Heat maps and #2: Deep dive on A/B testing
In the previous post, I dove deep into A/B testing in general at The Next Web. But in this one, I’d like to give you a closer look at three of the A/B tests we ran over the last couple of months that provided some interesting results.
What can you do with them? Use them as inspiration for how you run your testing program, but keep in mind that they are in no way guaranteed to work on your own site.
Test #1: WhatsApp vs. Social sharing
Date range: March 30, 2015 – April 6, 2015 (7 days).
Hypothesis: By adding a WhatsApp share button to the mobile version (iOS/Android) of our article pages, we can make it easier for readers to share content on the messaging app and increase the number of pageviews.
Explanation: In our initial test, we saw that the number of clicks on the WhatsApp button brought down the average number of clicks on the share buttons on our article pages.
In a second test, we wanted to see if the position of the WhatsApp button influences the click behavior on the buttons.
Main objective: The number of clicks on our share buttons results in a certain amount of shares on our articles. We also want to find out if the new WhatsApp share button influences the number of pageviews per session.
Winner: Variant 1 with a positive result of +65 percent (significance: 99 percent, power: 90 percent).
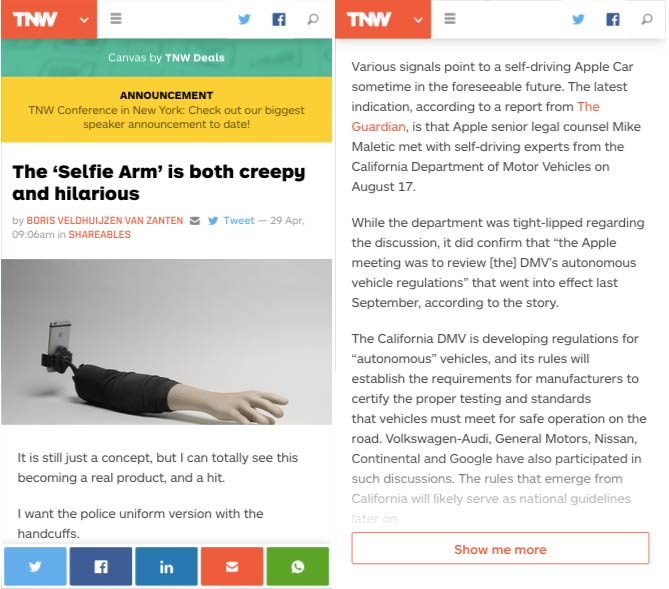
Test #2: Read more?
Date range: August 4, 2015 – August 10, 2015 (7 days).
Hypothesis: By creating a “read more” button, we will decrease the bounce rate of visitors because it will give them an option to find a related article that can interest them. It will show at the bottom of the article and more in-view first.
Explanation: Having a “read more” button in the articles might enable visitors that arrived by mistake or who are not interested in the article to reconvert and click on a related link below rather than directly leave the page.
Main objective: Increase the engagement with the article and increase the number of clicks (CTR) on the related stories.
Winner: Variant 1 with a positive result of +42 percent (significance: 100 percent, power: 100 percent).
What happened next? We decided not to implement this variant yet, as it will have such a strong impact on readership. We’ll test this further with another variable: the length of an article after which the read more button is displayed.
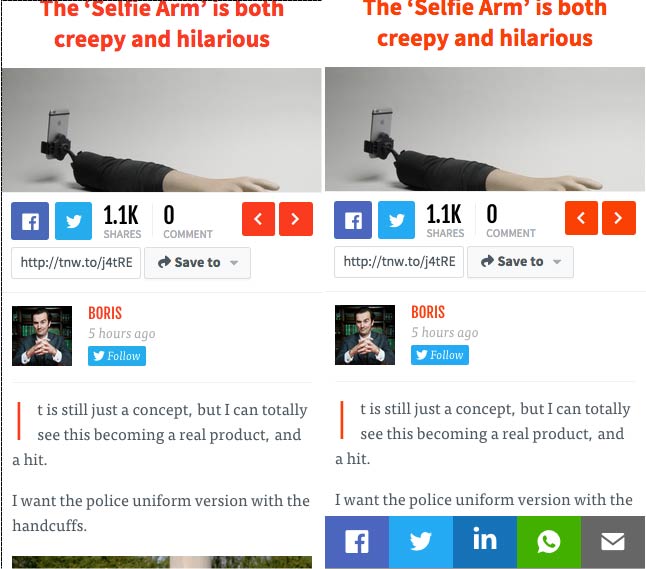
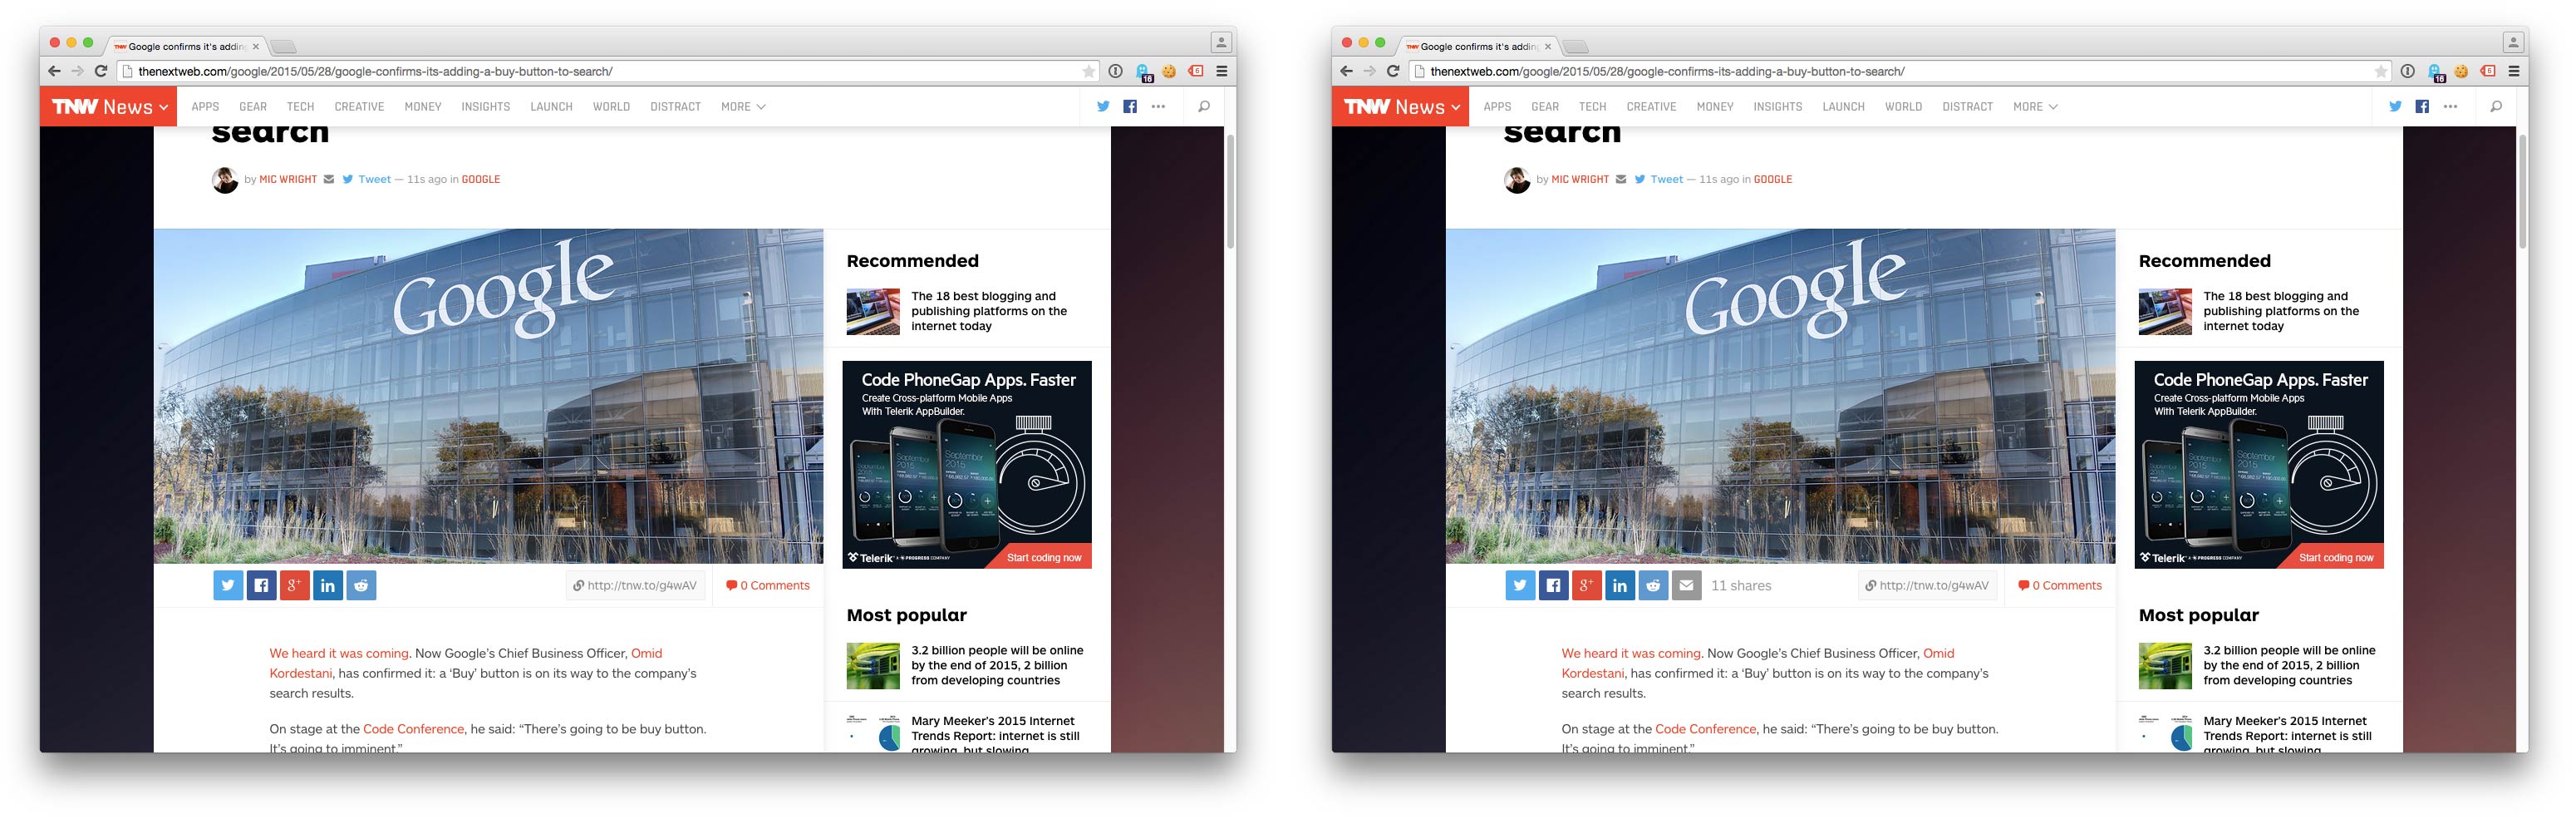
Test #3: Email sharing + Total shares
Date range: May 29, 2015 – June 4, 2015 (7 days).
Hypothesis: By adding an email share button and showing the total number of shares, we can get more readers to share the post and thus increase the number of visitors and pageviews.
Explanation: There are three variants in this test: One with the email button, one with the total number of shares, and one with both. So in all these cases we can find out the impact of the individual elements.
Main objective: Increase the number of clicks on the share buttons and in particular, the new email buttons.
Winner: Control variant (significance: 99 percent, power: 96 percent).
What tests have you run on your site? Let us know in the comments. Oh, and stay tuned for more; we’re always happy to share notes on the tests and the strategies that we implement at The Next Web.
If you missed the previous posts in this series, don’t forget to check them out: #1: Heat maps and #2: Deep dive on A/B testing.
This is a #TNWLife article, a look into life and work at The Next Web.
Get the TNW newsletter
Get the most important tech news in your inbox each week.