Did you know TNW Conference has a track fully dedicated to exploring how technology will shape the ever-evolving marketing landscape this year? Check out the full ‘Rebrand‘ program here.
About two years ago, when I was writing my thesis in Business Analytics, I had zero clues that my career will bring me into the world of UX. At that point, I was working in Digital Marketing and wanted to use my thesis to help a client make smarter decisions and get more business inquiries (conversions) while investing in digital advertising.
I’ve revisited this research and I’ll try to share my findings the best way I can. It’s probably nothing groundbreaking or eye-opening, but it might help some of you shape some studies of your own or help you prove some ideas you had in your work.
This article is a part of my thesis “The role of multivariate analysis in evaluating KPIs for Digital Marketing activities,” done in September 2017. at the University of Belgrade, under the direction of Dobrota Marina, PhD.
Study summary
In this study, the idea was to collect 12 months’ worth of data on visitor behaviors and use the findings to improve marketing efforts. The company in question is Maxifit, a distributor of fitness equipment (B2B segment) in the Balkans region — Serbia, Croatia, Bosnia & Herzegovina, Macedonia, and Montenegro.
I’ve collected 12 months’ worth of data in order to understand which users the client should focus on because they show stronger indications for conversion.
Objectives
- Understand which user segments show behaviors related to conversions
- Understand which channels bring higher-quality visitors
- Give the client enough information to help him better invest the Marketing budget in different channels and targeting options
Research process
- Make an initial hypothesis about the relationship between user behavior and positive results
- Collect data about the user behavior
- Use multivariate analysis to process the data
- Present key findings and give recommendations
Digital Marketing is considered to play a dominant role in today’s business world. The traditional media is stepping down, and the shift toward new technologies is inevitable. Consequently, investments in Digital Marketing activities are growing daily. That is why it is necessary to make informed decisions, which will return the investments to the greatest possible extent.
Read: [You can still run effective Design Sprints remotely – here’s how]
Maxifit is a fitness equipment distributor. Their main objective is to receive as many business inquiries as possible through their contact form.
To briefly give some context, Maxifit is a company that is an exclusive distributor of XBody EMS fitness devices for the Balkans region (Serbia, Croatia, Bosnia & Herzegovina, Montenegro, and Macedonia). Their main goal is to sell as many XBody devices or open Maxifit brand franchises as possible.

Usually, in e-commerce businesses, it is easy to draw a correlation between our activities and the results, because we can see direct sales online. In this case, the product is very expensive and a contract needs to be signed before purchase. That’s why our goal is to achieve as many email inquiries on the website from people interested in purchasing the product. That is what we would call a “conversion.” Then the sales staff takes over.
Research model and hypotheses
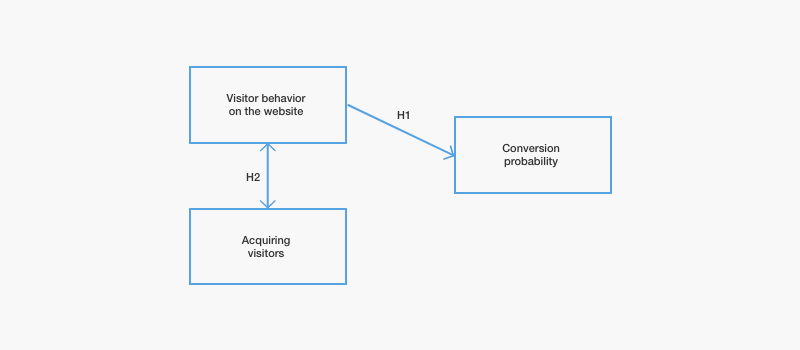
The goal of all marketing activities is to get as many conversions as possible. In order for the conversion to happen, a potential customer has to go through the sales funnel. The focus of this study was the top and the middle part of the sales funnel — brand awareness and showing interest.

H1: User behavior on the website affects the conversion probability
H2: There is a significant correlation between the means of acquiring users and their website behavior
In this article, I will solely focus on Hypotheses 1, since it is more closely related to the topic User Experience, while the other one might help digital marketers.
Collected data, variables, and user Segments
“The most valuable users are the ones who navigate deeper into the website — they are usually returning visitors, who come from the search engines, visit multiple pages on the website and have a higher average visit duration.”
According to previous research (Plaza, 2011), visitors that are expressing the following behaviors have greater indications that they will become our customers:
- Spending more time on the website
- Visiting multiple pages on the website
- Visiting the website more than once
- Visiting website from search engines
This is why I’ve chosen to match different user segments with variables related to the indicators above and see what kind of relationship they have.
- Variables that indicate positive behaviors:
- Sessions — Number of visits an individual user has on the website
- Bounce Rate — What is the percent of users who leave the website right after their first page (landing page)
- Pages per Session — Number of pages visited during one session
- Average Session Duration — How long does, on average, a user stay on the website during one session
I’ve decided to test the differences between (H1a) Desktop and Mobile visitors, (H1b) visitors that came through Facebook ads and search engines, (H1c) new vs returning visitors, and (H1d) visitors from different age groups.
User segments that were tested:
- Age groups
- Device used — desktop or mobile
- New or returning visitors
- Acquisition channel — Facebook ads or Google AdWords platform


The fun part — study results
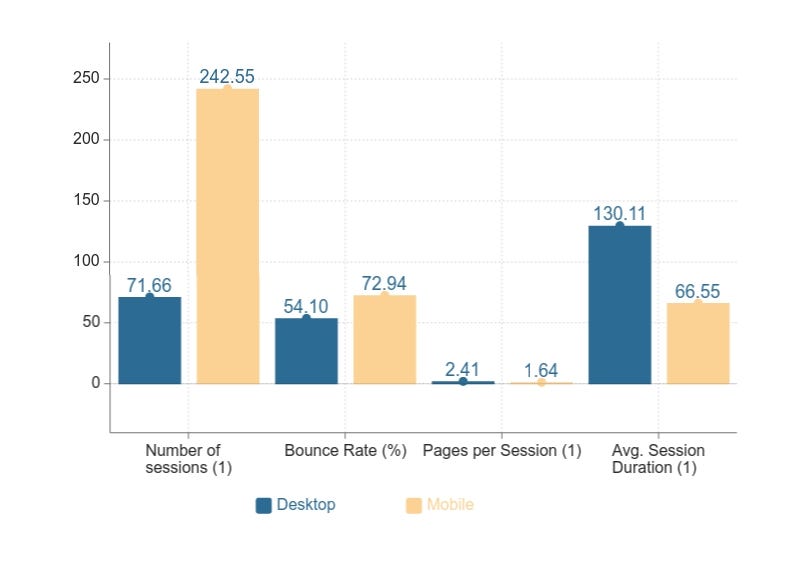
H1a: Is there a significant difference between users who come from mobile and desktop devices?
To analyze 730 samples, I’ve used the Independent Samples T-test and Mann-Whitney U test for confirmation.
A bar chart that shows average values of variables for users visiting from Desktop and Mobile devices.

With a statistical significance of 1%, the tests have determined the following:
- Sessions: The data indicate that more sessions per day come from mobile devices, with the same budget allocations
- Bounce Rate: The results claim that a bigger Bounce Rate is noticed with users who come from mobile devices
- Pages per Session: Users who come from desktop devices are visiting, on average, a larger amount of pages than users coming from mobile devices
- Average Session Duration: Data shows that users on desktop devices spend more time on the website than users on mobile devices
The research shows that we could put a bigger focus on the visitors who come from desktop devices because they show bigger indications for conversion.
Question for further analysis: Do users who come on mobile devices achieve worse results because the website has a poor user experience on mobile?
H1b: Is there a significant difference between visitors who came to the website through Facebook ads and visitors who came organically, through search engines?

Average values for users that came through Facebook and Google Search
With a statistical significance of 1%, both tests have determined the following:
- Sessions: The results show that more people came from Facebook ads than from the search engine
- Bounce Rate: Users who come from the search engines have far less probability of leaving the website after the first page (they have a lower Bounce Rate)
- Pages per Session: Users coming from search engines, on average, visit more pages during their session than users coming from Facebook ads
- Average Session Duration: Users coming from search engines are more likely to spend more time browsing the website
Through the data, we see that the visitors acquired organically, through search engines, are more valuable.
The explanation could be quite simple. Users who come from Facebook ads probably didn’t hear about the product and services before, at this point, are just getting to know the brand. On the other hand, people searching for Maxifit and XBody already know what they are looking for, so they are more likely to proceed to the next step — send an inquiry to the sales staff.
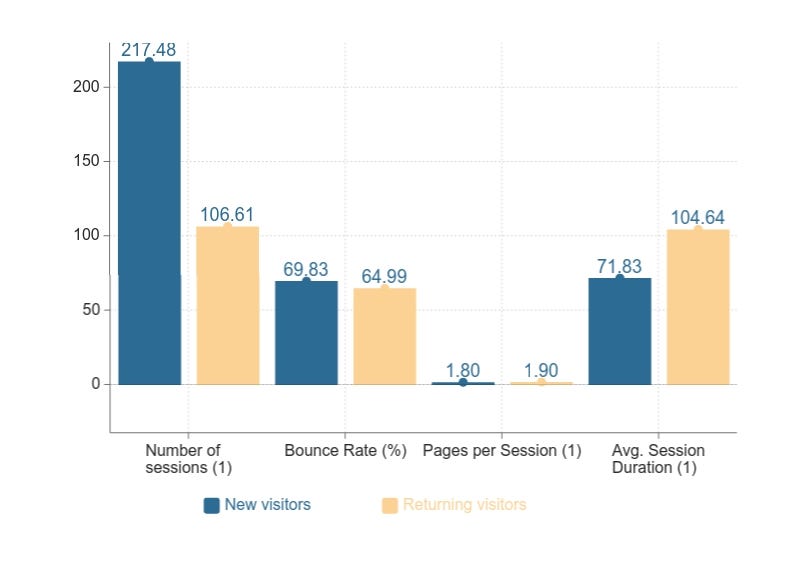
H1c: Is there a significant difference between new and returning visitors?
The idea here is to determine whether people who are returning to the website are there because they have the intention of converting.

Average values for new and returning visitors
With a statistical significance of 1%, both tests have determined the following:
- Sessions: The data shows that there are statistically more new than returning visitors
- Bounce Rate: The new users have a greater tendency of leaving the website after the landing page
- Pages per Session: Returning visitors visit more pages during their session
- Average Session Duration: Returning visitors spend more time on the website during their session
- The results show that returning visitors show bigger indications for conversion.
H1d: Is there a significant difference between age groups?
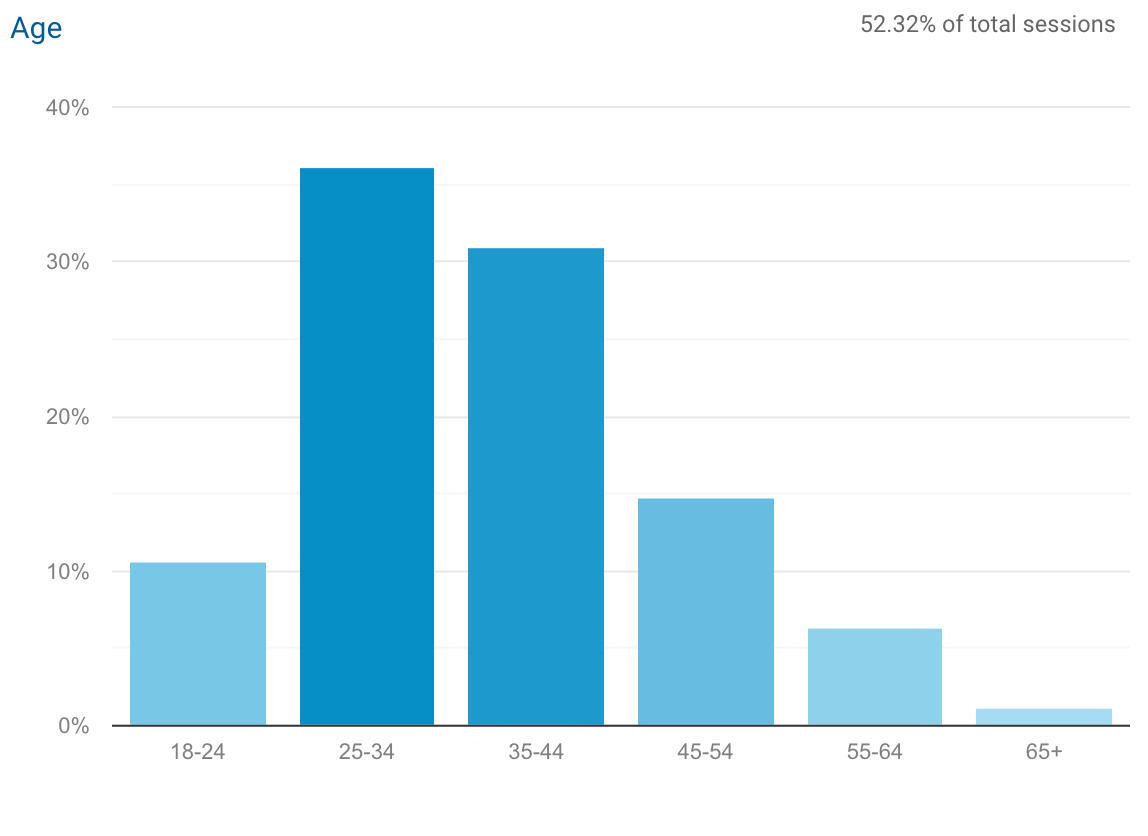
In this case, due to the limitations of Google Analytics, we had only 272 samples. The age groups are separated in 18–24, 25–34, 35–44 and 45–54. Because of multiple groups, the tests used were ANOVA and Kruskal–Wallis.


With a statistical significance of 1%, both tests have determined the following:
- Sessions: The greatest number of sessions is made by the age group 25–34
- Bounce Rate: Biggest Bounce Rate is for users aged 45–54
- Pages per Session: Users aged 25–34 on average visit the most pages per session, while the age group 45–54 visits the least
- Average Session Duration: Data and tests show users aged 25–34 stay browsing the website for the longest period of time
- Percent of New Sessions: The greatest percentage of new users come from age group 18–24, and the least number of new users are aged 25–34
Based on the numbers, the visitors who are aged 25–34 show the highest conversion probability.
Questions for further research: Should we invest more money into targeting users aged 25–34 in the ads? Is the small number of new users in this age due to the fact that a lot of them already have visited the website, so they are considered returning visitors each time they come back?
Key findings
To make it really short — data that I have collected during a 12 month period shows that desktop users aged 25–34, who are acquired through search engines, who are not visiting the website for the first time have a greater value for the company I was working for because they show more signs that they are willing to send a business inquiry (make a conversion).
Even though the research findings might not be that shocking or groundbreaking for someone working in business, Marketing , or UX Design, the goal here was to prove some ideas about targeting users and to have statistical proof that I can later use to justify decisions at work.
Desktop users aged 25–34, who are organically acquired through search engines, and who are not visiting the website for the first time show behaviors that indicate conversions.
Recommendations
Here’s how these findings shaped my Digital Marketing work at my client’s company:
SEO supports the advertising efforts— After getting people interested in your product through ads, they might be browsing the web to investigate the product/service. Since the higher quality visitors are coming from search engines, the company has to work on making the website highly ranked for all important keywords.
Invest in retargeting — Visitors who come back to the website are more likely to convert, so invest efforts into exploring all possible retargeting options to bring them back to the website.
Understand the visitors aged 25–34 — Who are they? Why are they specifically interested in your product? How are they different from other age groups, what information are they looking for and how do they use this website to find information?
Focus on both mobile and desktop — It would be just too easy to say to go mobile-first in this case, but the right answer for me would be to make both experiences flawless. In my research, data did show that more new users come from mobile phones, but that more quality visits come from a desktop device. It might be that the first visit on the phone is important to leave the first impression so that they come back using a desktop device to find out more.
Before taking these recommendations for granted and investing great budgets into design, development, and advertising, I would advise comparing the business I was researching with your own, checking out Google Analytics , and seeing if the same patterns in data occur and doing additional testing on different user segments.
Get the TNW newsletter
Get the most important tech news in your inbox each week.


