
Microsoft has released a public preview of GeoFlow today, a new 3D visualization tool for Excel which allow users to create, navigate and interact with time-sensitive data applied to a digital map.
The idea is that users log all of the necessary data in Excel, and then reproduce it in 3D so that it can be shared with other people as an interactive tour.
GeoFlow allows users to plot up to 1 million rows of data stored in an Excel workbook, including Excel Data Model or PowerPivot, on a visual representation of the area supplied by Bing Maps.
Data can be set as vertical columns, rising from the earth like multi-colored skyscrapers, two-dimensional patches similar to heat maps, or what Microsoft is describing as “bubble visualizations”.

The 💜 of EU tech
The latest rumblings from the EU tech scene, a story from our wise ol' founder Boris, and some questionable AI art. It's free, every week, in your inbox. Sign up now!
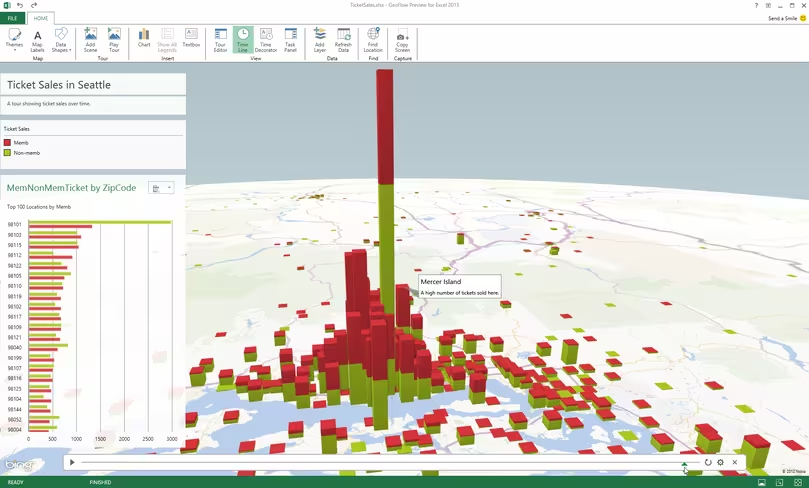
The map can then be altered to show time-stamped data changing over time. Some of the real-world applications cloud include the number of people travelling to a particular part of a city, or the progress with cleaning up an oil spill out at sea.
To show this data to other people, users can capture “scenes” in GeoFlow and build cinematic “tours” that can be exported and shared at will.
Microsoft is known for having a pretty extensive research and development team, but oftentimes its moonshot projects fail to materialize as a public product. GeoFlow is an exception to this trend, however, originating from the WorldWide Telescope (WWT) project built by the Microsoft Research team.
The project started as an application, launched in 2008, that gave young astronomers a way of accessing an observatory from a Windows PC. Users could pan and zoom through the universe, exploring stories and images sourced from the Internet in an expansive, interactive experience.
Curtis Wong, principal researcher at Microsoft Research Redmond, wanted to expand the scope of the project though.
“With the dramatic growth in geospatial and temporal data we wanted to explore new tools that could help us understand the large-scale temporal and geospatial trends that affect businesses,” he said.
“The goal always has been to bring dynamic, interactive data visualization to the business world. Yes, we built a gigantic virtual telescope, but to do so, we had to build an engine that could visualize the universe. If we can visualize the universe, we can visualize almost anything else.”
The WWT project had already built a virtual camera that could show users a virtualization of the universe across space and time. It was also possible to create “movies” with accompanying narratives – much of what makes GeoFlow unique on Excel.
Scott Ruble, principal program manager lead for Microsoft Excel, approached the WWT team to see how it could be incorporated into other Windows projects. The result is GeoFlow, available right now as an add-in for Excel 2013 with office 365 ProPlus or Office Professional Plus 2013.
Image Credit: Justin Sullivan/Getty Images
Get the TNW newsletter
Get the most important tech news in your inbox each week.