Q4 2018 internet report: Almost 4.2 billion humans are online
The state of the internet in Q4 2018
The data in Hootsuite and We Are Social’s new Q4 Global Digital Statshot report reveal that the ‘Next Billion’ is fast becoming a reality, as more and more people across the developing world connect to the internet.
Millions of people across Africa and South Asia came online for the first time in the past three months, with almost all of these new users accessing the internet solely via mobile devices.
There have been some meaningful changes to social media numbers too, although some of the most interesting findings in this quarter’s report relate to declines in social media audiences, especially amongst younger Facebook users.
It’s also been a bumper quarter for mobile, with global users spending $20 billion on apps in the past three months – that’s equivalent to more than $150,000 every minute between July and September.
You can read the full report in the SlideShare embed below, but read on for my in-depth analysis and commentary on the most important findings.
Key numbers
The 💜 of EU tech
The latest rumblings from the EU tech scene, a story from our wise ol' founder Boris, and some questionable AI art. It's free, every week, in your inbox. Sign up now!
Let’s get right to the good stuff. Here are the essential headlines from this Q4 report:
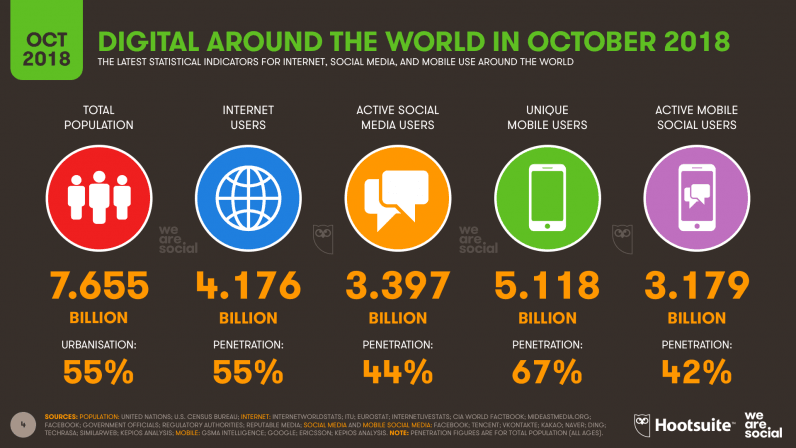
There are almost 4.2 billion internet users around the world in October 2018, up seven percent since this time last year.
Around 3.4 billion people around the world used social media in September 2018, up 10 percent versus September 2017.
More than 5.1 billion people now use a mobile phone, with most using a smartphone.
Connecting the future
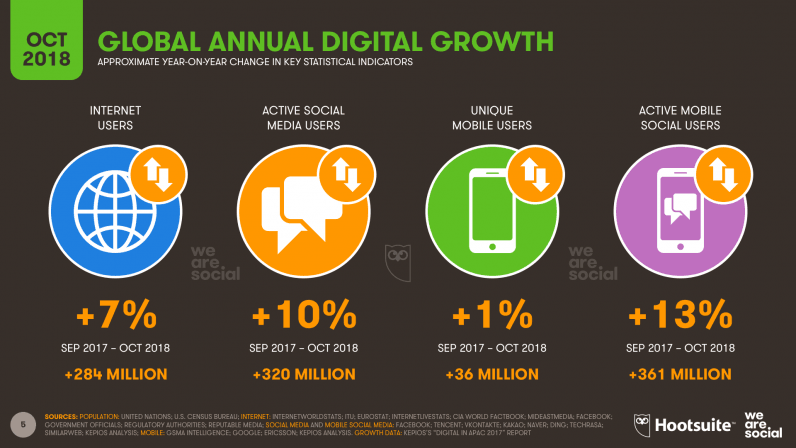
68 million people came online for the first time between July to September 2018, which translates to growth of more than 1.5 percent in just three months. That roughly matches the pace of growth over the past year: 284 million new users have come online since September 2017, equating to year-on-year growth of roughly seven percent.
Social media users are growing even faster though, with 320 million new users signing up between September 2017 and October 2018. Growth in social media use via mobile devices takes things a step further, with almost a million people starting to use mobile social for the first time every day over the past year.
Data from GSMA Intelligence shows that more than two-thirds of the world’s population now owns a mobile phone, with roughly 60 percent of these people owning a smartphone. As a result, mobile growth trends are a little slower than those for internet or social media use, but roughly 100,000 people started using a mobile phone every day over the past year.
The total number of mobile subscriptions in use in October 2018 stands at 8.9 billion. That means that the average mobile user still maintains more than one mobile number, but the average number of subscriptions per user continues to fall as people consolidate mobile activities onto a single device.
Mobile first
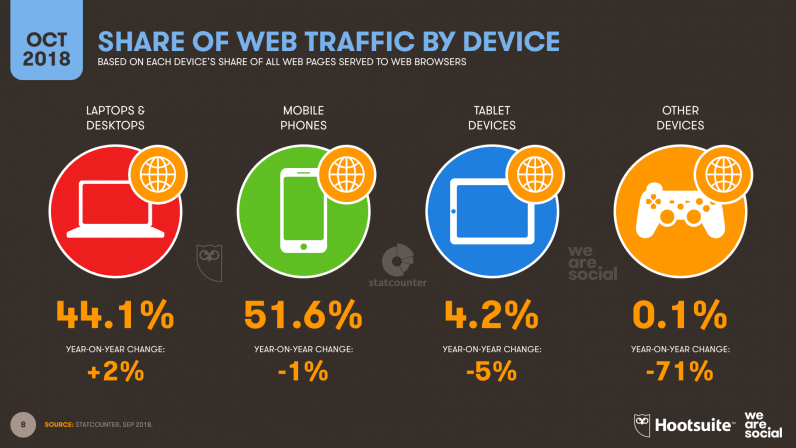
Mobile still accounts for more than half of all global web traffic, but the share of traffic coming from laptops and desktops has actually increased by two percent over the past year.
The share of total web traffic coming from other devices – including tablets – continues to decline, but this may be in part due to an increase in the total volume of traffic from mobile phones and laptops, rather than because people have reduced their use of devices like tablets.
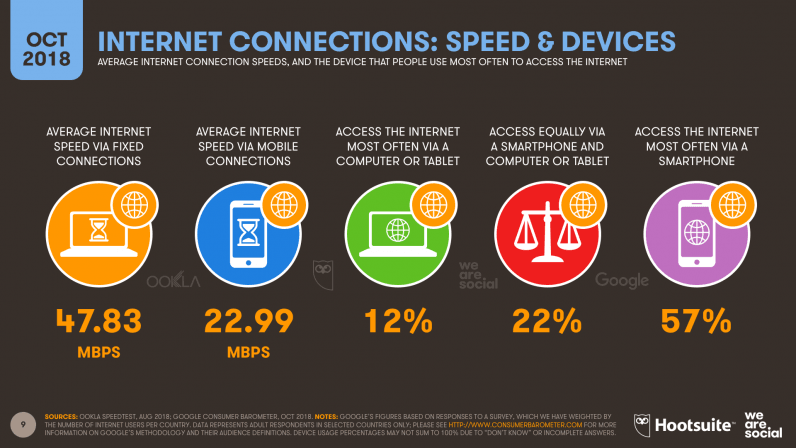
Despite the slight fall in mobile’s share of total web traffic, people report that they are significantly more likely to turn to their phones when they want to go online. The latest findings from Google’s Consumer Barometer survey suggest that we’re five times more likely to choose our phones over a computer or tablet when it comes to accessing the internet.
There are a few potential reasons for this imbalance between stated device preferences and actual web traffic.
Firstly, many people still perform work-related internet activities via a computer, and these activities likely account for a sizeable share of overall web traffic (considering that work time accounts for a significant portion of our waking hours).
Similarly, people often turn to mobile devices for ‘quick-fix’ needs such as checking the weather or performing simple web searches. While these activities account for a meaningful share of online session frequency, they don’t require people to browse through numerous different pages to achieve their desired outcome, so this frequency doesn’t necessarily translate into an equal share of total web traffic.
Differences in connection speed may also play a meaningful role in influencing which devices people use, with the average fixed internet connection still twice as fast as its mobile equivalent.
Mobile speeds dip
Indeed, the average global mobile connection speed decreased slightly over the past three months, while average fixed speeds are up by more than three percent since July.
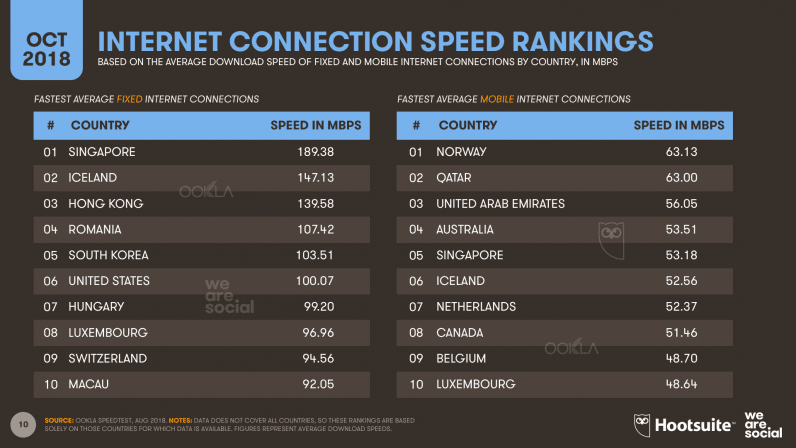
Singapore tops Ookla’s fixed connection rankings with an average speed of 189 Mbps. Connections in six countries around the world now average more than 100 Mbps.
Norway tops the mobile rankings with an average connection speed of 63 Mbps, just ahead of Qatar. Mobile connection speeds now average more than 50 Mbps in eight countries around the world.
Top websites
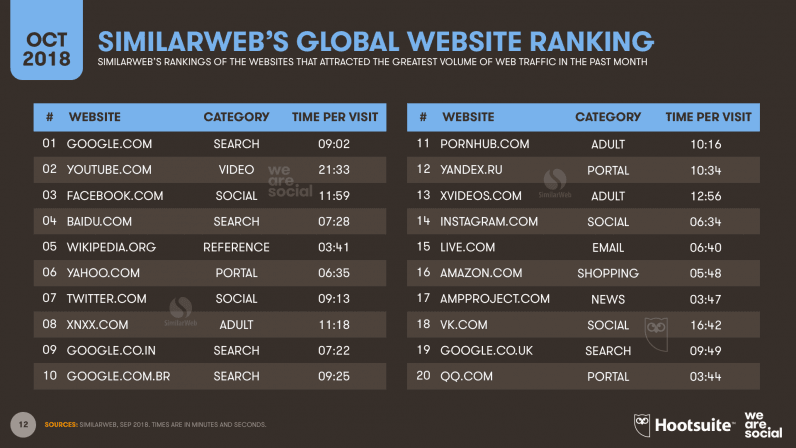
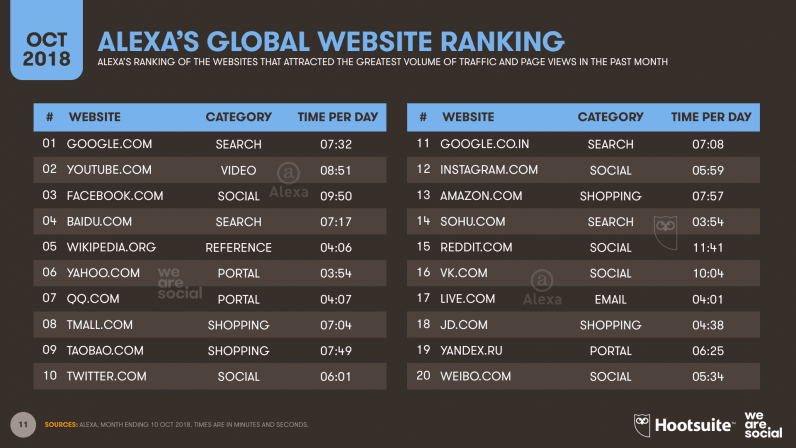
Alphabet Inc. continues to dominate the world’s top website rankings, with SimilarWeb and Alexa both putting Google.com and YouTube.com in the top two positions. SimilarWeb also features three more of the company’s local search sites in its top 20 ranking: Brazil, India, and the UK.
There have been some changes in these top rankings though, and the rise of the AMP Project is particularly worthy of note. AMP’s efforts to provide publishers with a faster mobile experience seem to be paying off, with SimilarWeb ranking AMP the 17th most-visited site on the internet in its latest monthly rankings.
Meanwhile, shopping sites continue to feature heavily in Alexa’s website ranking, with Chinese e-commerce sites in particular consolidating their grip. The company’s latest global data suggest that both Tmall and Taobao now attract significantly more visitors than Amazon, although their data doesn’t offer any insights into how many of these visitors turn into paying customers, or how much they spend.
Fashion forward
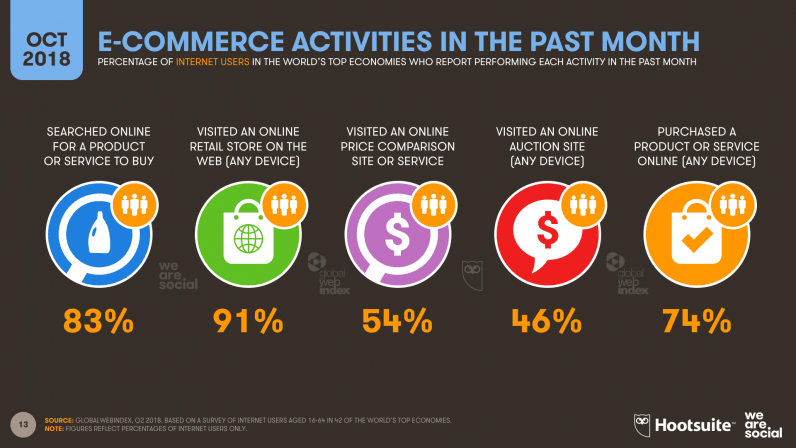
GlobalWebIndex’s research can help us make sense of broader conversion trends, though. The company’s latest data show that nine in every ten internet users visits at least one online retail site each month, and three-quarters go on to actually buy something.
Shopping behaviors vary slightly between men and women, with women more likely to use a shopping app on their mobile compared to men.
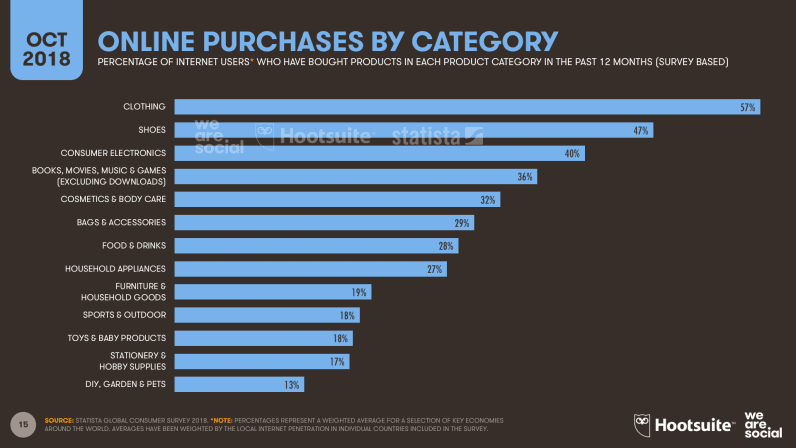
Data from Statista’s Global Consumer Survey shows that fashion remains the most popular category for online purchases, with clothing and shoes topping the list of e-commerce purchase categories in the past twelve months.
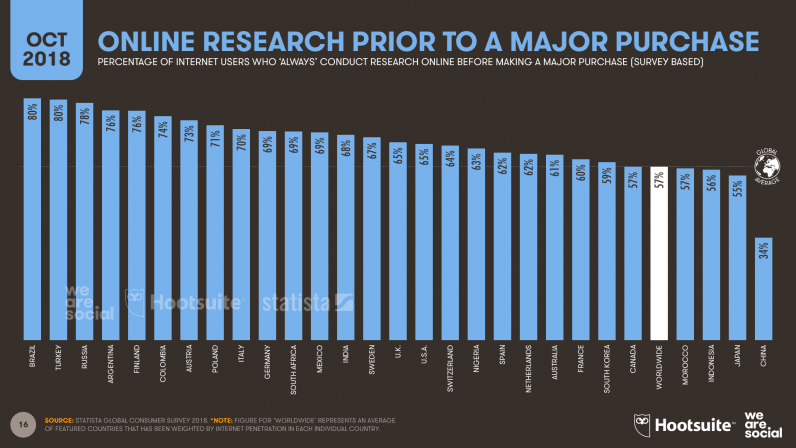
Most internet users still research brands and products online, but Statista’s latest data suggests that there are some meaningful differences across countries. Four in five shoppers in Brazil say that they ‘always’ conduct online research before making a major purchase, but in China, that figure is barely one in three.
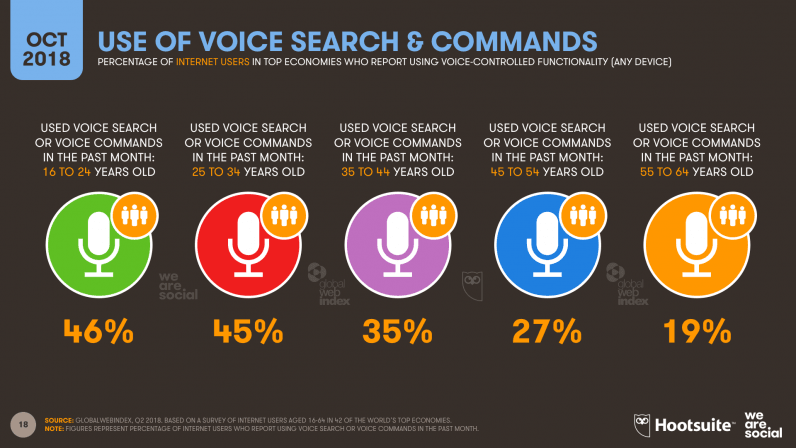
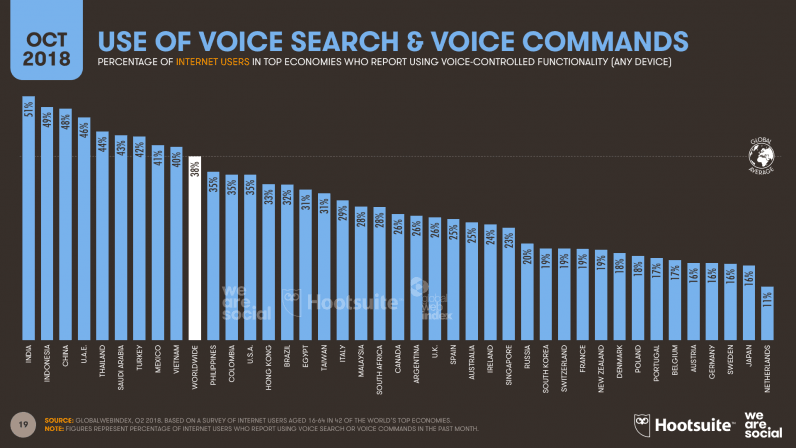
And speaking of search, GlobalWebIndex’s latest data shows that people are increasingly turning to voice to help them find what they’re looking for. 38 percent of internet users surveyed around the world in Q2 report using voice-enabled features in the past 30 days, and that figure jumps to incredible 45 percent and above when we zoom in on users below the age of 35.
Interestingly, the data suggest that people in developing economies are more likely to use voice search than people in more developed markets, with almost half of all internet users across India, China, and Indonesia reporting that they used voice search or voice commands in the past month.
Privacy concerns vary by country
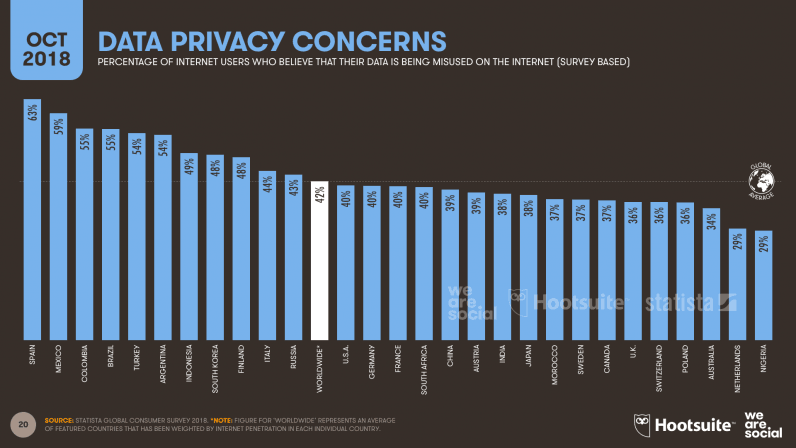
Privacy fears have been a recurring theme throughout 2018, so I’m pleased to include some new insights from Statista in this new report. The company’s most recent Global Consumer Survey found that 42 percent of the world’s internet users fear that their data is being “misused” online, although – once again – there are some significant differences across cultures.
There are no clear trends in this data to suggest why people in one country might have more heightened privacy concerns than those in other countries, but it’s worth pointing out that users in Spain – where the levels of concern are greatest – are more than twice as worried as users in Nigeria.
Losing face?
Mark Zuckerberg probably won’t remember 2018 among his favorite years, but Facebook continues to grow its global user base despite the various scandals and setbacks that the company has faced over recent months.
The world’s largest social site added 38 million new users in the three months to June, representing 1.7 percent growth quarter-on-quarter. That growth might not have been everything that investors were hoping for, but Facebook still accounts for roughly two in every three of the world’s social media users.
Facebook’s advertising tools suggest that growth hasn’t slowed through Q3 either, with the platform’s latest audience data reporting growth of 65 million users since July. However, these numbers only reflect changes in the platform’s potential advertising audience, and may not translate into similar growth in monthly active users.
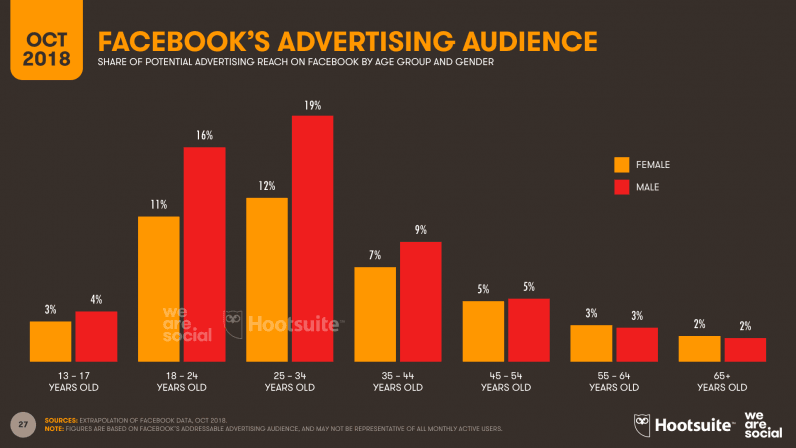
The latest advertising audience numbers contain some bad news for the Mountain View team, too. In particular, the latest numbers show that advertisers can now reach 3 million fewer 13 to 17 year-olds on Facebook compared to July 2018, with young women leaving the platform even faster than young men.
Snap ’em up
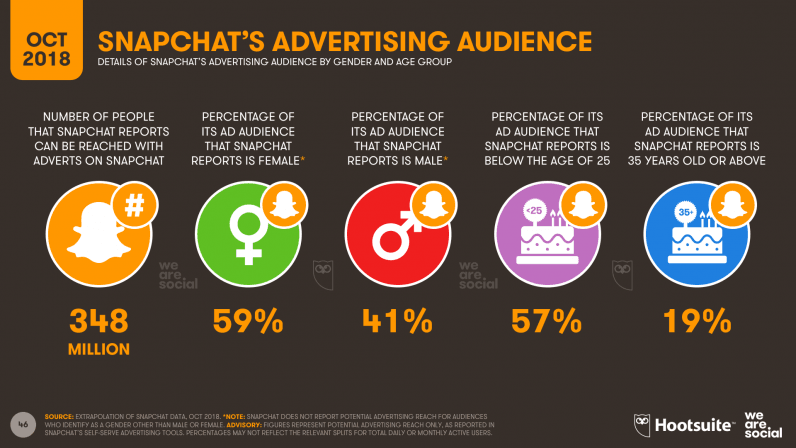
But Facebook’s loss may be Snap’s gain. We’re pleased to be able to offer detailed insights into Snapchat’s advertising audience for the first time in this new report, and the numbers are quite revealing.
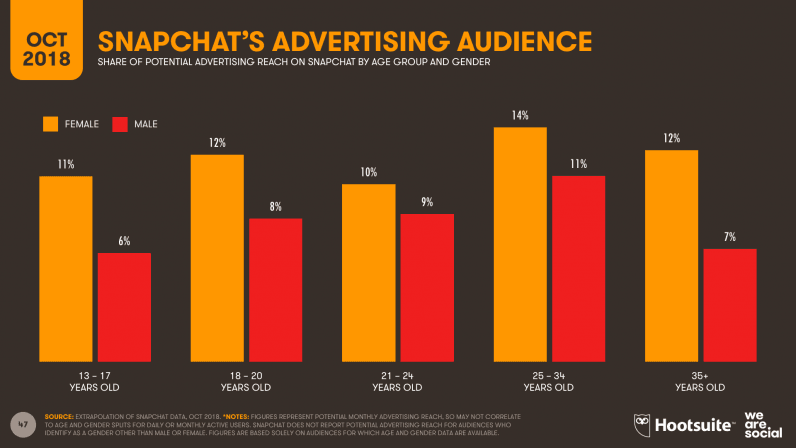
It might not come as a surprise that Snapchat’s average user is significantly younger than Facebook’s, but the gender balance will certainly be of interest, especially to marketers.
Almost six in ten users in Snapchat’s global advertising audience are female, compared to a 57:43 male:female skew on Facebook. In some countries however, Snapchat’s data suggests that the platform’s advertising audience is even more female-skewed. In Kazakhstan, for example, female users account for a whopping nine in ten of the total potential advertising audience.
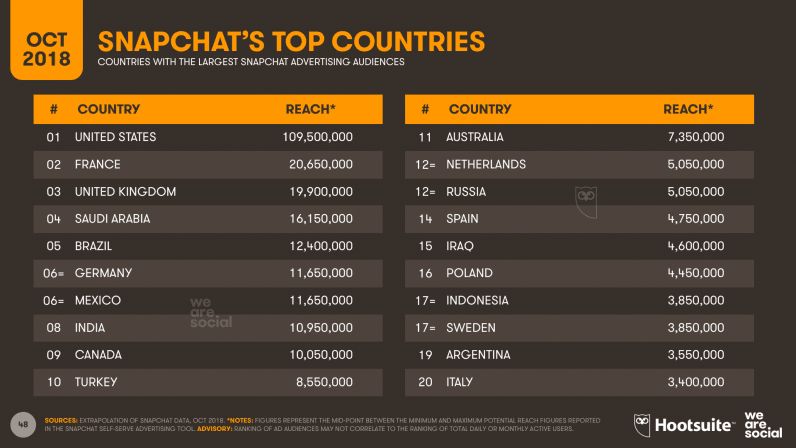
The United States accounts for slightly less than one-third of Snapchat’s total advertising audience, but the rest of the ‘top 20’ countries shows some good diversity. So, while the company’s latest user growth figures may have disappointed investors, the platform still offers global marketers an interesting opportunity to reach younger, female audiences.
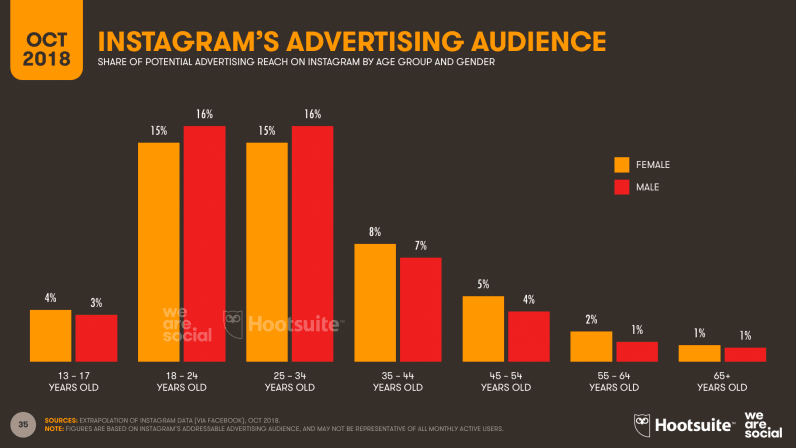
A key question remains though: is Snapchat the best channel to reach these younger audiences, or is Instagram a better bet?
Social climbing
The answer to that question depends on a large number of different factors, most of which will be specific to the advertiser’s particular needs and context.
However, audience reach will likely play an important role in decision-making, so it’s worth noting that Instagram’s overall advertising audience is more than double the size of Snapchat’s audience.
But what about that elusive, younger demographic?
Here are the cold, hard facts:
Global users below the age of 25 that advertisers can reach with Instagram ads: 196 million
Global users below the age of 25 that advertisers can reach with Snapchat ads: 329 million
But Instagram doesn’t just appeal to Gen Z. In fact, the latest figures show that brands can now reach more than 100 million users over the age of 45 via Instagram ads.
Perhaps Zuck still has something to smile about after all.
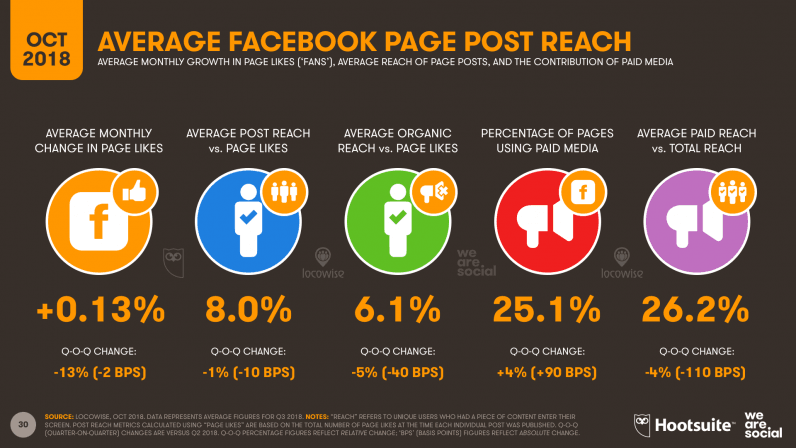
It’s not all good news for advertisers though, with the latest data from Locowise showing that organic Facebook reach continues to decline.
The average Facebook page reached 5 percent fewer people organically in Q3 versus Q2, and page owners can now expect to reach just 6 in every 100 of their fans if they don’t boost posts with paid media.
Recent algorithm tweaks seem to be working in Facebook’s favor, with the number of pages investing in paid media increasing by four percent in the past three months.
However, Locowise’s latest data suggest that these paid investments aren’t delivering the impact that they used to. The average contribution of paid reach as a percentage of total page reach has dropped by four percent in the past quarter, suggesting that either pages are getting less reach for their investment, or that they’re simply investing less (even though a greater number of pages now invest in paid media).
Either way, marketers should explore the broader trends in the Facebook reach and engagement numbers across our previous reports to help inform their social media strategies for 2019 – you’ll find the Q1 data here, Q2 here, and Q3 here.
Furthermore, if previous years are any indication of a ‘pattern’, it’s likely that Facebook will introduce yet more changes to its algorithm in early 2019, and it’s unlikely that these changes will work in brands’ favor.
As a result, my advice to marketers would be to take a more ‘balanced diet’ approach to social media in their plans for next year, and to avoid putting all of their eggs in one (Facebook) basket. You’ll find detailed breakdowns of the potential advertising for each of Facebook, Instagram, Twitter, LinkedIn, and Snapchat in the report embed at the top of this post.
Of particular note is the fact that the total amount of money spent on mobile apps around the world in Q3 reached $20 billion, up 20 percent versus this time last year.
This spend equates to roughly $3.70 for every smartphone in use today, with mobile games claiming the lion’s share of this revenue.
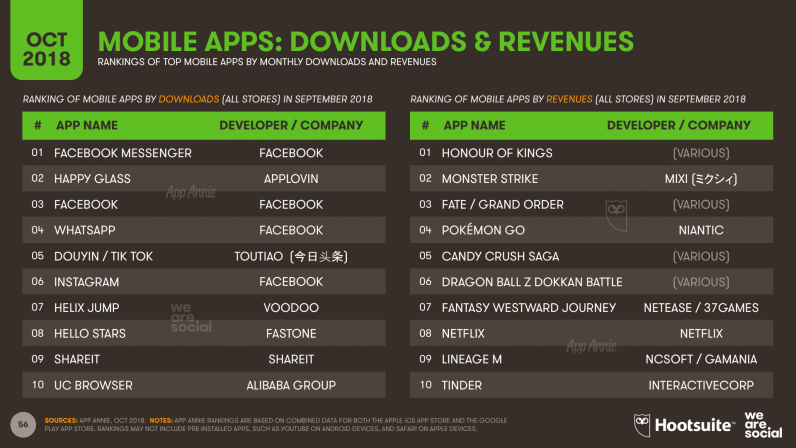
But it’s not all about games: Netflix and Tinder continue their impressive standing in the top-grossing apps in the App Annie’s global latest ranking.
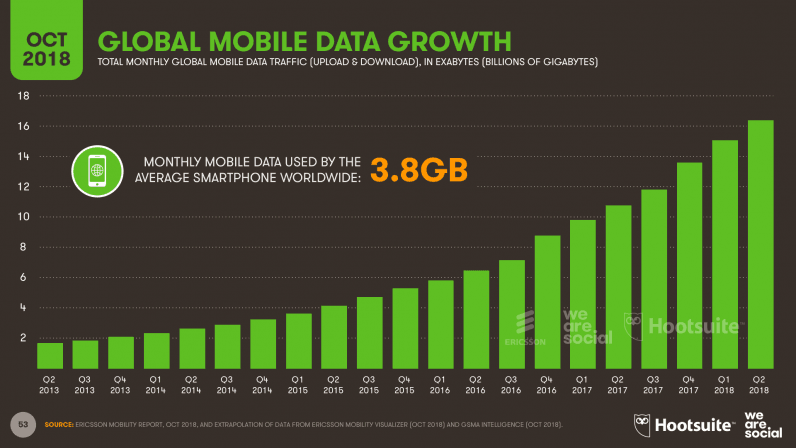
Our insatiable appetite for mobile data shows no signs of slowing either, with the latest numbers from Ericsson suggesting that the average global smartphone user now consumes more than 3.8GB of mobile data each month.
Forecasts for 2019
All the data in this final update report for 2018 suggest that we’ll have plenty of exciting stories to report in our flagship 2019 Global Digital report, which we’ll be publishing in late January.
In particular, look out for:
Accelerating growth in internet users across developing economies, especially in Africa.
Continued strong growth in overall social media user numbers, but some meaningful declines in the audiences of individual social media platforms.
A jump in the total value of consumer e-commerce spending, with strong growth in areas such as fashion and grocery.
We’ll also be reporting some longer-term growth trends based on the data we’ve collected over recent years, and we’ll be adding a wealth of new data points too.
To give you an idea of what you can expect, here’s a ‘replay’ of our January 2018 report:
Get the TNW newsletter
Get the most important tech news in your inbox each week.