The new 2018 Q3 Global Digital Statshot report from Hootsuite and We Are Social shows that there was plenty of change in the world of digital, social, and mobile over the past three months.
 There are many encouraging trends within this new data, but there are also some more worrying findings that marketers will need to monitor closely over the coming months.
In particular, the latest data from Facebook suggests that clicks on ads on its platform have dropped dramatically in the past three months, with the typical global user now clicking on 20 percent fewer ads than they did this time three months ago.
You can dig into all the charts in the new report in the SlideShare embed below (click here if that’s not working for you), but read on below for this quarter’s essential headlines, and a deeper analysis of that Facebook ad engagement story towards the end of the article.
Strong growth continues
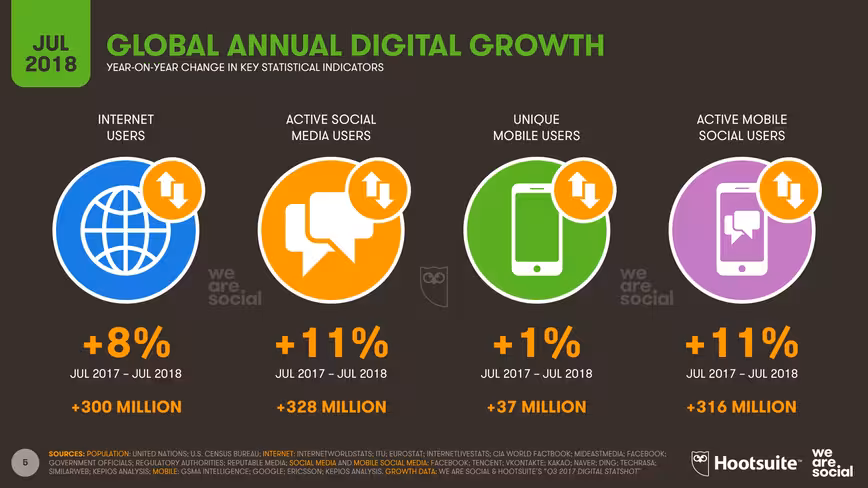
The number of internet users around the world grew by eight percent over the past year, with growth boosted by accelerating adoption across Africa and South Asia.
Roughly 300 million people came online in the twelve months to July 2018, equating to an average of almost 10 new users every second.
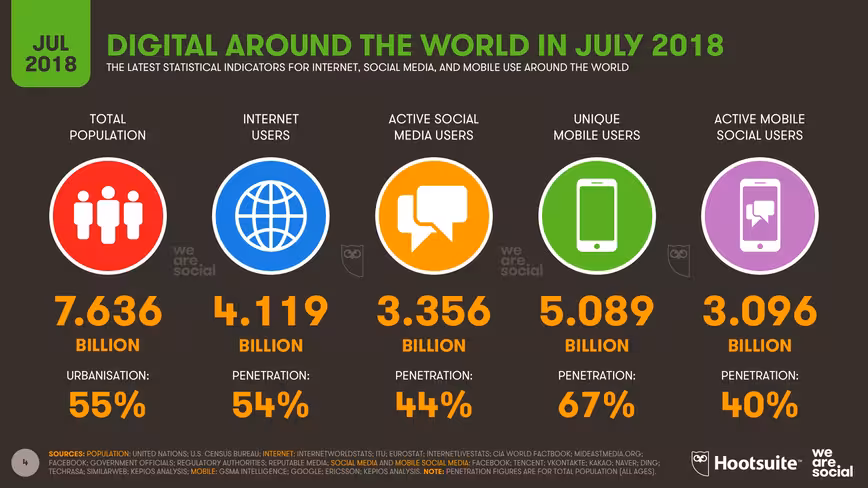
 More than 4.1 billion people are now online, meaning that 54 percent of the world’s total population is using the internet in July 2018.
The number of people using social media continues to grow at an impressive rate too, with the latest data showing that global users increased by 11 percent in the year to July 2018.
With 328 million new users adopting social media in the past 12 months, we’re still seeing additions of almost one million new social media users every day, although this growth isn’t quite as rapid as it was during the first three months of 2018.
Well over 3.3 billion people now use social media each month, with at least 92 percent of them accessing social media via mobile devices.
Upwardly mobile
Mobile phones now account for 52.5 percent of global web traffic, according to the latest data from StatCounter. That’s down slightly since July 2017, but up roughly two percent compared to global traffic in April this year.
In contrast, there was a slight decline in the share of web pages being served to laptops and desktops over the past three months, although the share of these devices grew roughly three percent year-on-year.
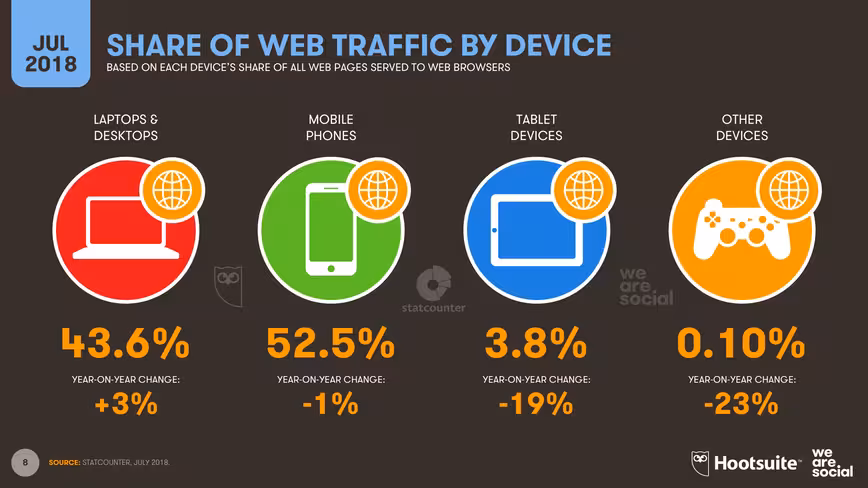 The relative share of web pages served to tablet devices continues to decline, but this trend may be the result of more pages being served to mobile devices, leading to a reduction in tablets’ overall share, rather than an actual decrease in tablet usage.
Google’s ongoing Consumer Barometer study offers a more dramatic take on people’s device preferences, with the latest data suggesting that the world’s internet users are almost five times more likely to turn to their mobile phone than a computer when they want to go online.
Just 12 percent of global users report that they’re more likely to access the internet via a PC or a tablet, compared to 57 percent who report that their phone is their go-to device.
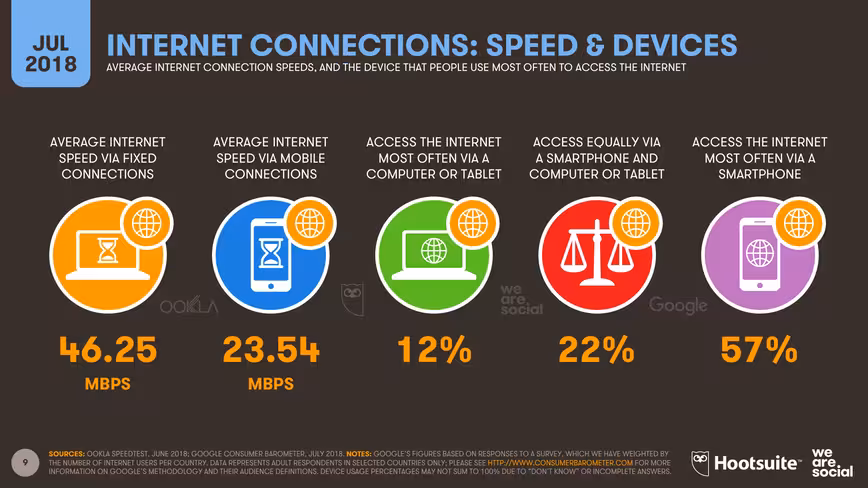 The differences between these two datasets may indicate that people are more likely to turn to their mobile phone for ‘quick-fix’ online activities, but – where possible – they prefer to use a computer for more in-depth browsing.
Connection speeds speeding up
Ookla reports that average internet access speeds surged in Q2, with the average fixed connection now eight percent faster than it was this time three months ago.
The speed of the average mobile connection increased by more than 1 MBPS (megabit per second) since April, representing a six percent improvement.
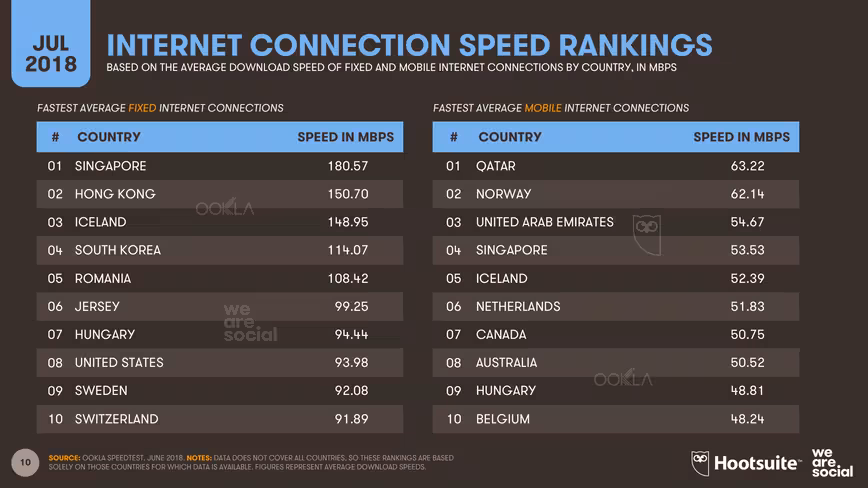
Singapore is still home to the world’s fastest average fixed internet connections, at more than 180 MBPS. That’s up almost 12 percent in just three months, and means that the average fixed internet connection in the Lion City is now 20 percent faster than the average connection in second-placed Hong Kong.
Qatar has jumped five places in the mobile connection speed rankings to take top spot from Norway. Mobile connections in the Gulf state now enjoy average speeds of 63.22 MBPS, up 22 percent compared to April 2018.
Shop without the drop
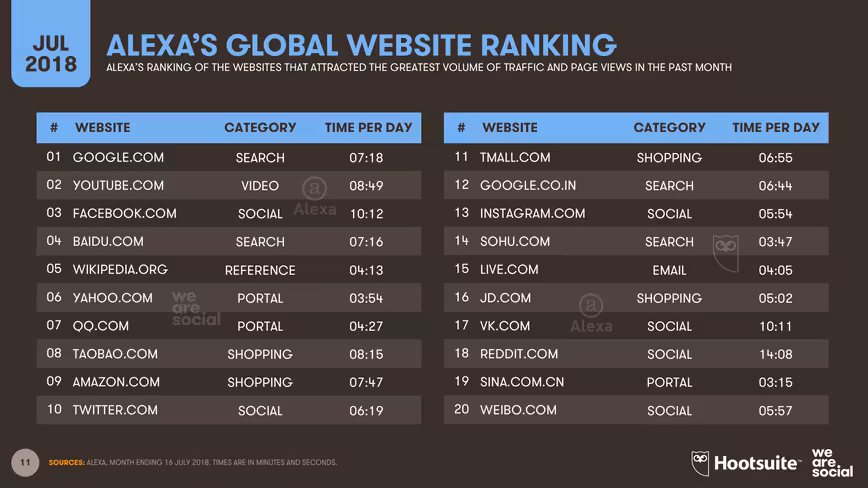
The latest global website rankings from Alexa show that both Taobao and Amazon have moved up the charts, with Reddit the biggest loser in this month’s figures, despite its impressive results in Q1.
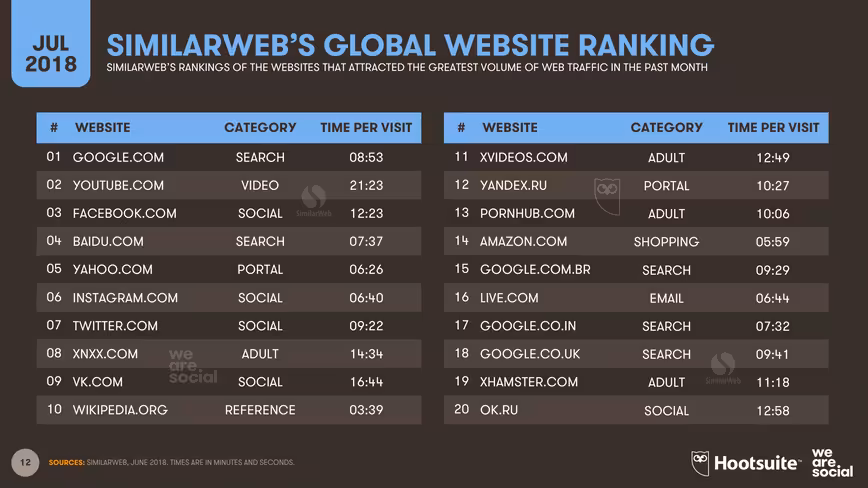
 SimilarWeb’s latest website rankings also reveal some notable changes, with YouTube overtaking Facebook to take second spot in their global rankings, behind first-placed Google.
Amazon also climbs three places in SimilarWeb’s rankings to take 14th spot. It’s worth noting that my team and I collected this data before the company’s flagship Prime Day though, so there’s a chance that Amazon will see further upward movement in our Q4 report.
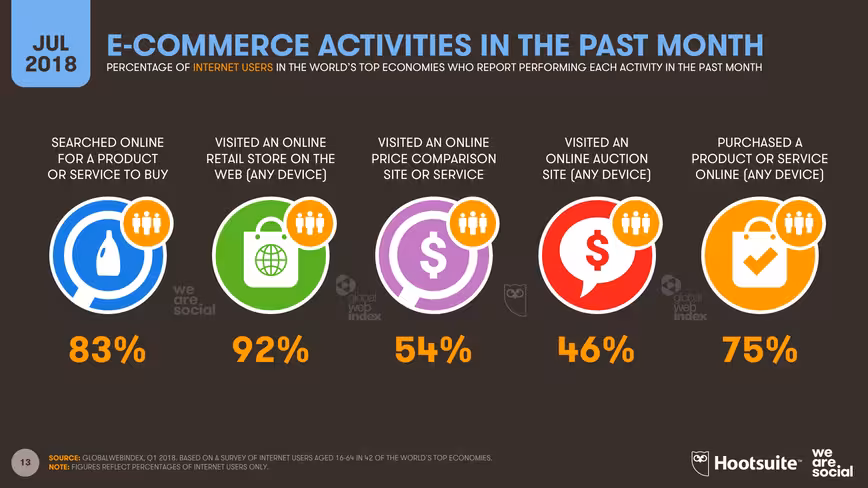
 Digging deeper into the latest ecommerce trends, GlobalWebIndex reports that the number of people visiting online retailers has grown slightly since our last report.
92 percent of the world’s internet users now visit online retailers each month, up from 91 percent this time three months ago.
More than three-quarters of these shoppers converted at least one of their visits into a purchase, with 75 percent of internet users reporting that they’ve bought something online in the past month.
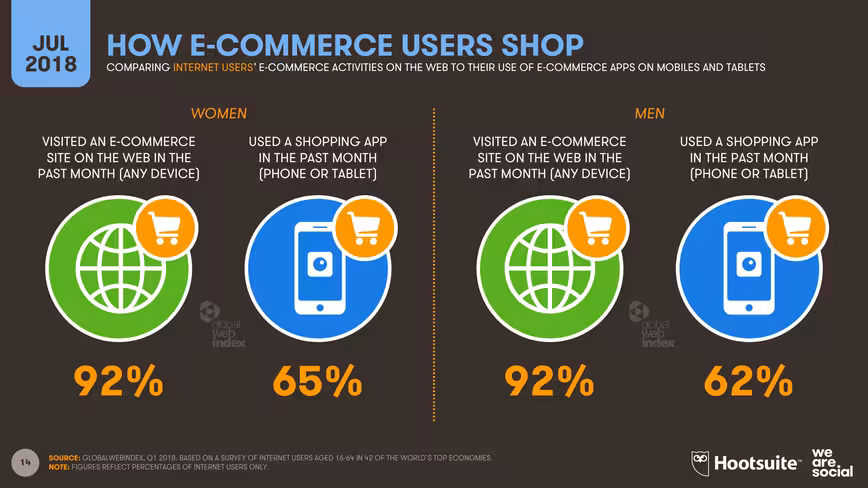
 It’s worth noting that GlobalWebIndex’s data shows meaningful growth in the use of shopping apps over the past three months as well.
65 percent of female internet users now use shopping apps each month (up from 61 percent last quarter), compared to 62 percent for men (up from 59 percent).
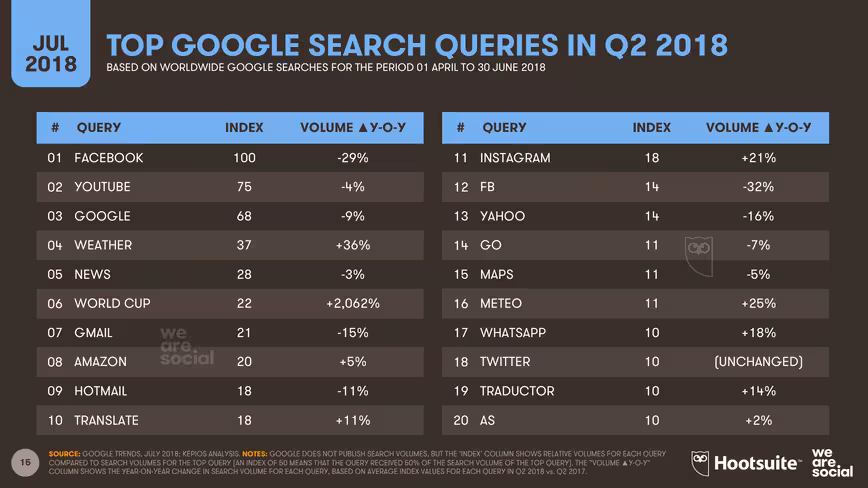
 The number of people searching for products to buy remained static over the past three months, but the latest insights from Google Trends tell some more impressive search stories.
The World Cup effect
The standout search trend for this quarter is – perhaps unsurprisingly – the explosion in queries relating to the recent FIFA World Cup, with global search volumes up a massive 2,000 percent versus this time last year.
 The players themselves seem to have done quite well out of the World Cup too.
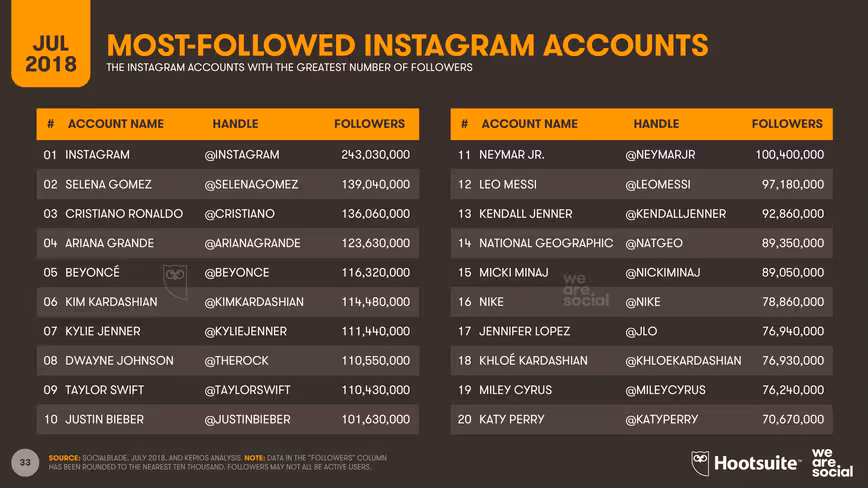
Cristiano Ronaldo added an impressive 6.7 million new followers to his Instagram account in the past three months, while Leo Messi added 7.7 million – one million more than Ronaldo – in the same period
However, Neymar Jr’s account scored the greatest growth amongst player accounts in Instagram’s top 20, adding a whopping 10 million new followers since April.
 App Annie reports that mobile apps that allowed people to live-stream matches on their mobile devices also saw impressive growth during the World Cup.
In the US, apps from Telemundo Deportes, FOX Sports GO, and FOX Sports ranked first, second, and third (respectively) for average bandwidth per user, while the same three apps were also new entrants into the top 10 apps by total time spent compared to the three weeks directly prior to the event.
Meanwhile, in the UK, people spent over six million hours using the top 10 sports apps on Android during the first three weeks of the World Cup – an increase of 65 percent compared to the three weeks prior to the start of the event.
Talking up voice
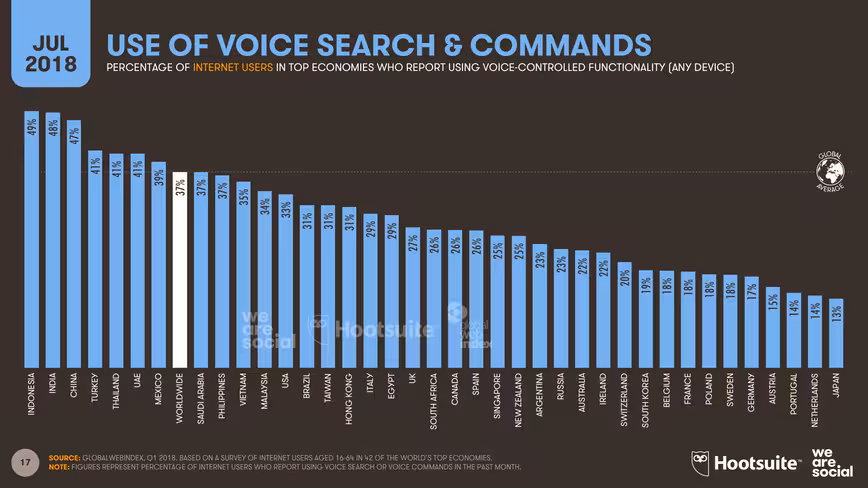
The latest numbers from GlobalWebIndex show that the use of voice search and voice commands is spreading around the world, with the highest rates of use in Asia.
Nearly half of all internet users in the world’s two largest countries – China and India – report using voice interfaces in the past month, although Indonesia tops the global rankings, at 49 percent.
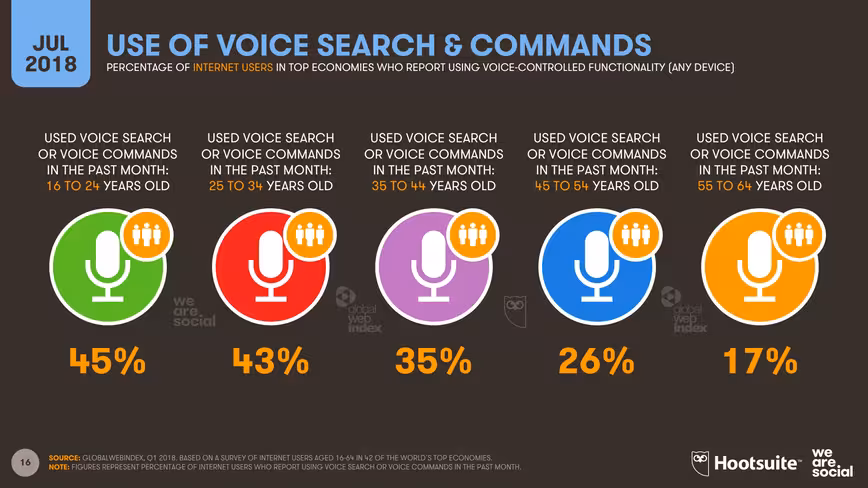
 Younger people are more likely to use voice, with 45 percent of the world’s internet users aged between 16 and 24 saying that they used voice interfaces last month, compared to just 17 percent of 55 to 64 year-olds.
 The global average has risen to more than 37 percent, but things vary significantly between countries, and barely one in eight internet users in Japan – 13 percent – say that they used voice search or voice commands in the past 30 days.
My interpretation of these global numbers is that cultural norms still play an important role in determining whether people feel comfortable using voice interfaces, especially in public places.
For example, the typical Japanese commuter would probably feel uncomfortable using voice interfaces on public transport, because most transport operators still forbid travellers from making voice calls in order to avoid disturbing other passengers.
However, the situation would likely be quite different in China, where the trend towards using voice on social platforms like WeChat (Weixin) means that most people are now used to speaking ‘to’ their devices in public – often multiple times per day.
Personal habits may also play a role too, with people who have been using text-based interfaces for many years more likely to resist moving to voice due to psychological inertia.
However, with all of the world’s largest internet companies – Google, Facebook, Apple, Amazon, Tencent, and Baidu – all weaving voice into the heart of their latest services, apps, and devices, it’s likely that we’ll see use of voice interfaces rise steadily around the world over the coming months.
YouTube surges
Facebook still dominates the social media landscape, with the company reporting 2.2 billion* active users on the ‘core’ platform in its latest earnings release (note: we have changed the methodology we use to report monthly active users for Facebook since our Q1 report, so Facebook user numbers on this chart will not be directly comparable to those we have reported in previous versions).
That’s up 67 million – or three percent – compared to the previous quarter, which is all the more remarkable when we consider the challenges that Facebook has experienced over the past three months.
YouTube appears to be closing the gap though, with the company’s latest statements suggesting that the platform now has more than 1.9 billion active users around the world.
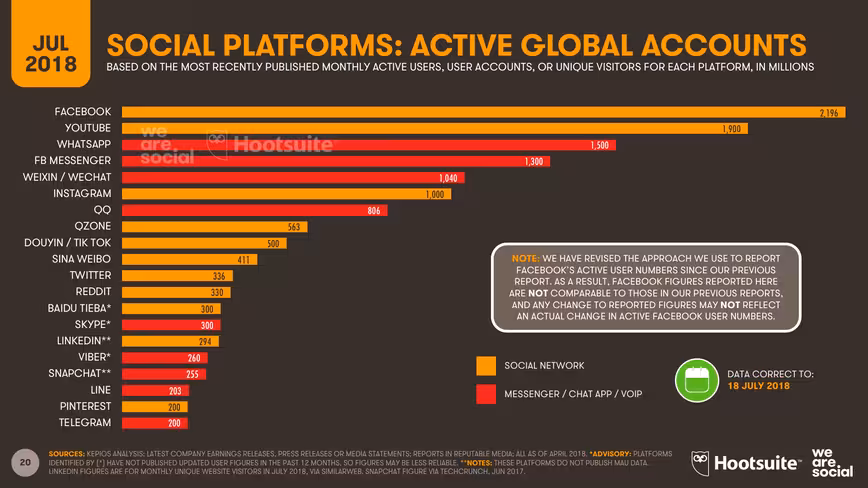 Instagram gained a lot of coverage in recent weeks for announcing that it is now “a community of more than 1 billion,” but the company later clarified that this represents active accounts, not active users.
The latest data from Facebook’s advertising tools suggest that marketers could potentially reach slightly more than two billion people on Facebook, compared to 844 million people via Instagram.
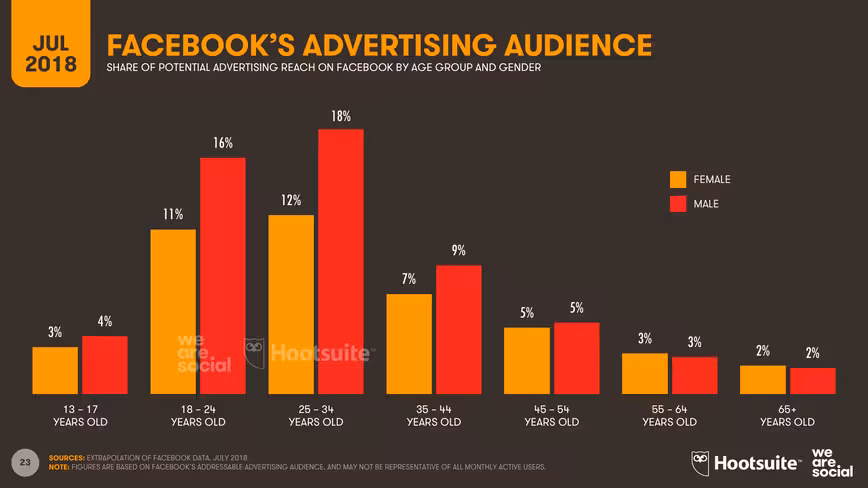
Closer analysis of these latest numbers confirm a steady increase in the average age of Facebook’s users, with just 34 percent of the platform’s advertising audience now below the age of 25, compared to 35 percent this time three months ago.
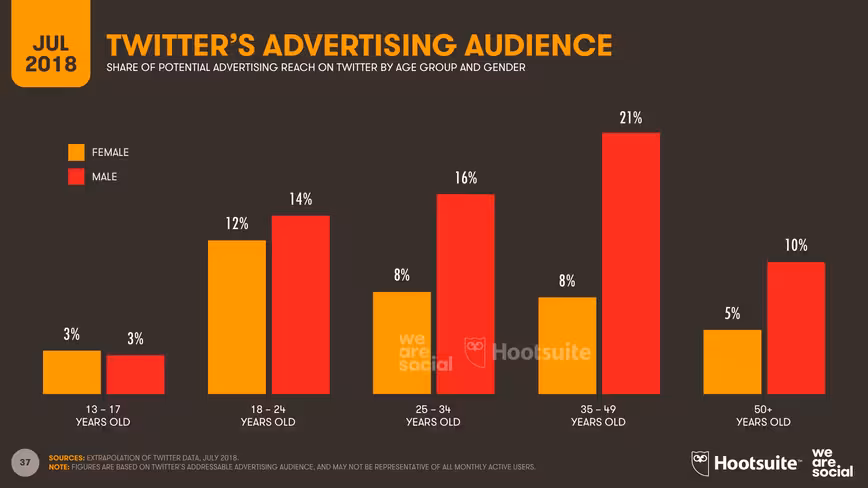
 Twitter has also seen some notable changes to its advertising audience, perhaps in part due to the dramatic culling of 70 million fake accounts that the company announced in recent weeks.
The biggest shift has been in gender balance, with male users now accounting for 64 percent of the platform’s addressable advertising audience – a significant increase compared to the reported 57 percent this time three months ago.
However, Twitter’s ‘corrections’ to its user base appear to have reduced the average age of its advertising audience, with users below the age of 25 now accounting for one-third of the total, compared to the 31 percent share we reported in Q2.
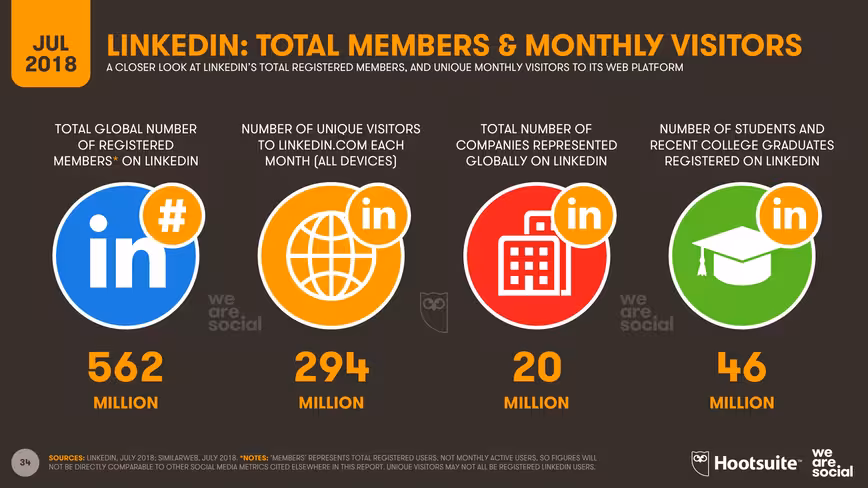
 LinkedIn have shared their latest numbers with us for this quarter’s report too, telling us that registered users are now in excess of 560 million.
That number represents total registered users though, as opposed to the monthly active users (MAUs) we report for many other platforms.
LinkedIn doesn’t publish MAU data, but the latest insights from SimilarWeb suggest that LinkedIn’s web platform attracts almost 300 million unique visitors each month.
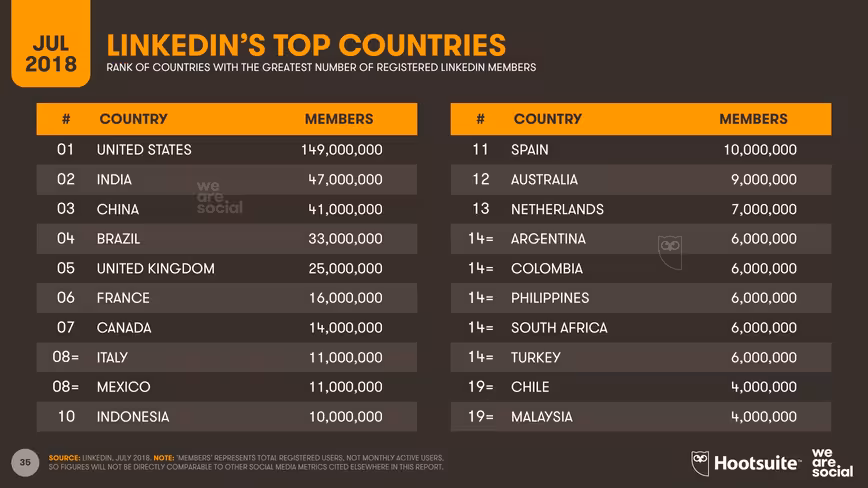
 LinkedIn reports that more than 70 percent of its global users are outside the USA, with India claiming second spot in the platform’s ranking of registered users.
However, perhaps more interesting is the number of registered users in China.
LinkedIn remains the only large Western social platform that isn’t blocked in China, and whilst its local user numbers are small compared to the country’s total population, marketers and recruiters will likely be interested in the economic profile of LinkedIn’s 41 million users in mainland China.
Clicks on Facebook ads tumble
Perhaps the most important finding in this quarter’s report relates to a dramatic 20 percent drop in Facebook ad clicks.
Facebook’s own data shows that the typical global user now clicks on a median of just eight adverts per month, down from the 10 clicks that the company was reporting three months ago.
It’s important to note that this change relates to user behavior, and isn’t necessarily an indication of any change in the performance of Facebook advertising. Facebook ads can be used for a variety of objectives that don’t require users to click on anything for the ad to achieve its intended outcomes (e.g. reach or awareness).
As a result, this drop in the median number of ad clicks may not have any immediate impact on Facebook’s revenues, but advertisers and investors will want to keep an eye on these figures over the coming months to see whether the trend is part of an ongoing decline.
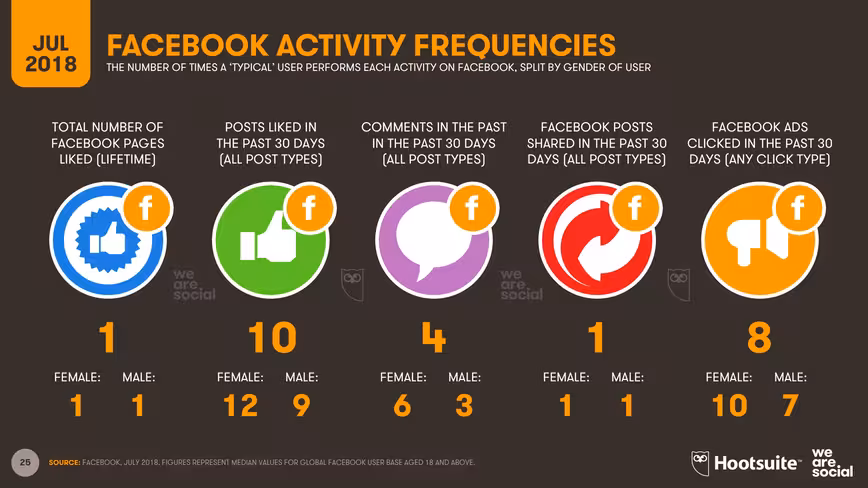 Digging into the data, the latest numbers show that women still click on more ads than men, but they’re clicking a median of 10 times per month today, compared to the 12 clicks per month I reported back in April here on TNW.
Meanwhile, men are clicking a median of just seven times a month in July 2018, compared to the nine clicks per month that my team and I reported in our Q2 report.
This story isn’t just about ads, though; Facebook’s data shows declines in other kinds of engagement too.
The typical global user ‘liked’ a median of 10 posts in the past 30 days, down from 11 posts this time three months ago.
Similarly, the number of times that the typical Facebook user comments on posts has also fallen, from five times per month back in April, to just four comments per month today.
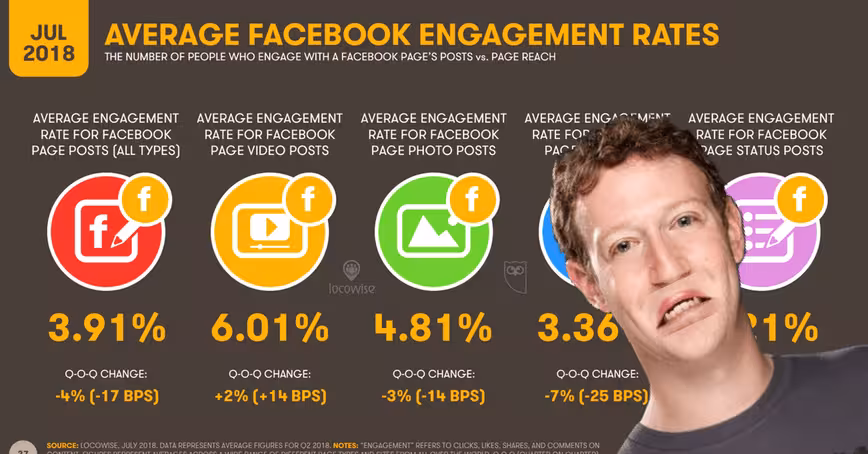
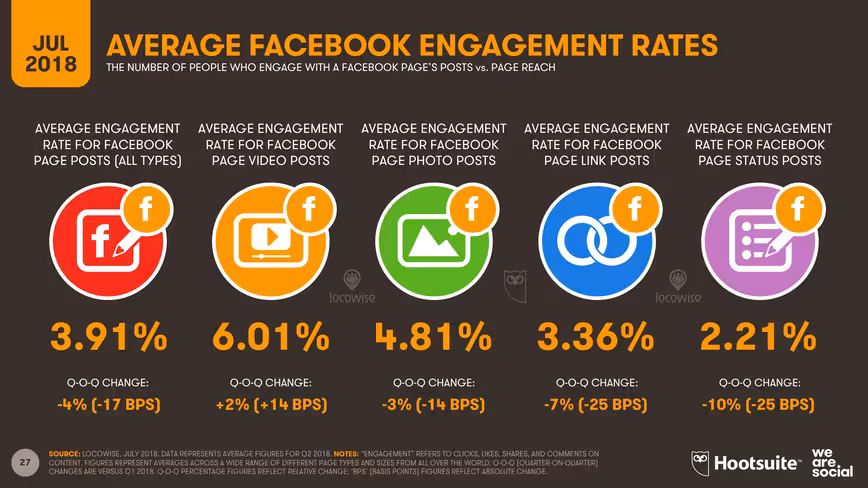
These declines are mirrored in the latest data from Locowise, with the social listening company’s latest data showing that average Facebook post engagement across all kinds of posts – organic and paid – has dropped by four percent in the past three months.
 There may be many different reasons why Facebook engagement has fallen so much in the past quarter.
It’s tempting to speculate that the drop may be the result of fallout from the Cambridge Analytica affair, but with Locowise reporting that 27 percent more pages used Facebook advertising in Q2 compared to the first three months of 2018, it seems unlikely that Cambridge Analytica was a significant factor.
 It may also be the case that advertisers have changed the ways in which they use Facebook advertising, and they’re now more interested in driving simple awareness than in generating some kind of engagement (i.e. click). However, it seems unlikely that a sufficient number of advertisers would change their behavior at the same time to trigger this level of change at a global level.
In reality, it’s likely that various different factors have combined to cause this change. Even something as simple as Facebook’s own efforts to refocus the Newsfeed may have played a role.
The drop may simply be a ‘seasonal variation’ too, and there’s a good chance that we’ll see ad clicks rebound in the coming weeks.
Regardless of the causes though, these latest findings are a timely reminder for marketers: your Facebook page may be ‘yours,’ but you’re still only renting the audience.
My advice: beware of becoming overly dependent on any one platform or channel, and always try to maintain a ‘healthy, balanced diet’ when it comes to content distribution – especially on social media.
If you’d like to dig deeper into the decline of Facebook engagement around the world, check out my separate, in-depth study of the country-by-country figures behind this story.
Smarter connections
The latest data from GSMA Intelligence and Ericsson’s Mobility Report suggest that there are now more than 5.3 billion smartphones in use around the world, accounting for more than 60 percent of all mobile connections.
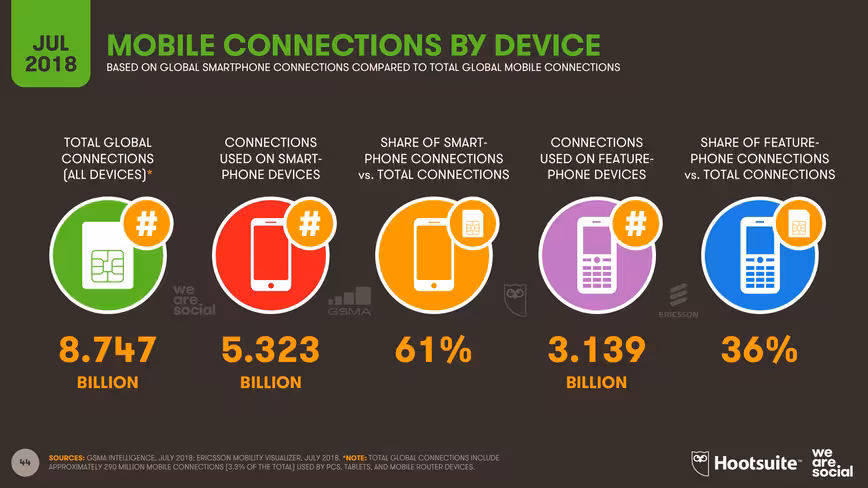 However, given that the total number of unique mobile users around the world is just 5.1 billion, it’s clear that an increasing number of mobile users now use two or more smartphones.
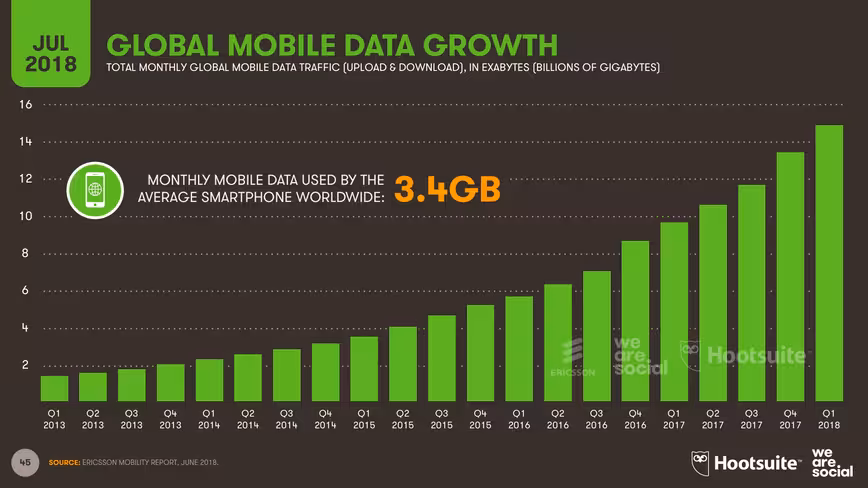
Despite the increasing number of people splitting their activities across multiple devices though, the amount of data consumed on each device continues to grow, with the average smartphone handset now consuming 3.4GB of mobile data every month.
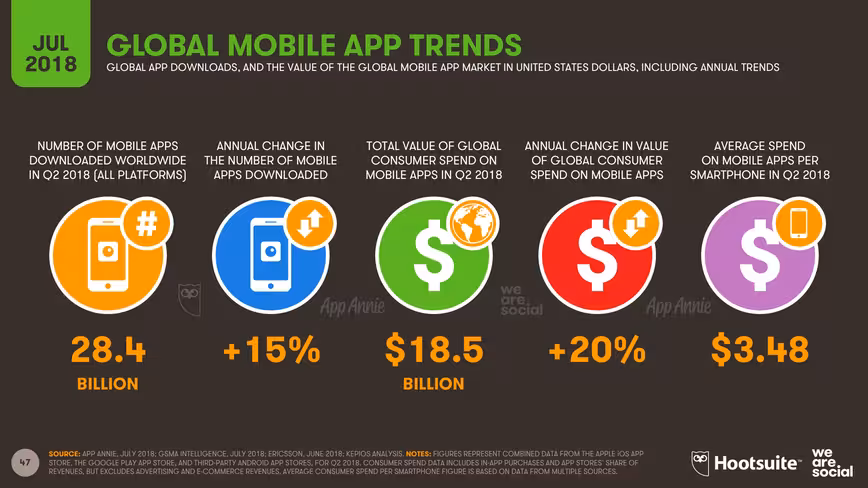
 We’re spending more on apps for our smart devices too. The latest data from App Annie shows that the world’s smartphone users spent $18.5 billion USD on mobile apps in the three months from April to June, equating to an average revenue per handset of $3.48.
App Annie reports that the total number of apps downloaded in Q2 2018 was more than 28 billion, meaning that the average global smartphone user downloaded at least five new apps in the past three months.
 This growth continues to be fueled by downloads in developing nations, with App Annie noting that users in India and Indonesia have played important roles.
Despite already dominating global social media user rankings, Facebook continues to top App Annie’s ranking of mobile apps by new downloads too, with the company’s various apps accounting for four out of the five most downloaded apps in June 2018.
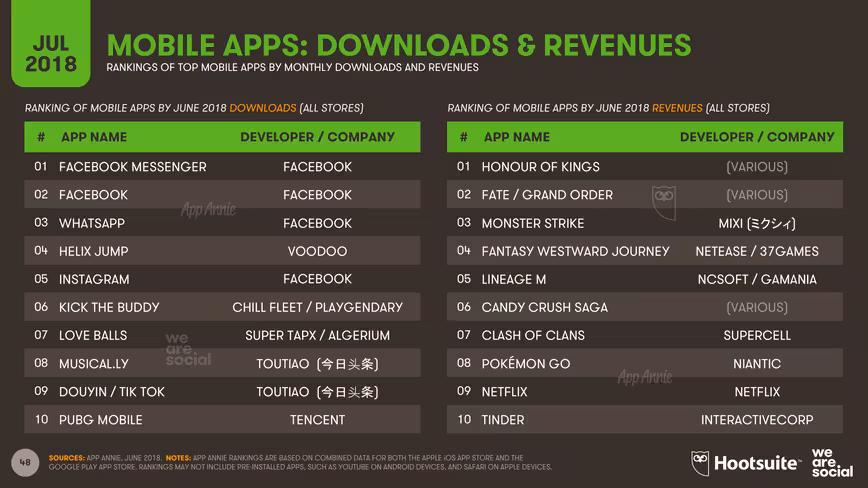 Games account for most of App Annie’s ranking of mobile apps by revenue, although Netflix and Tinder are notable exceptions towards the bottom of the company’s top 10 rankings for June.
iOS users tend to spend more on average compared to Android users, although the amounts spent vary considerably by country.
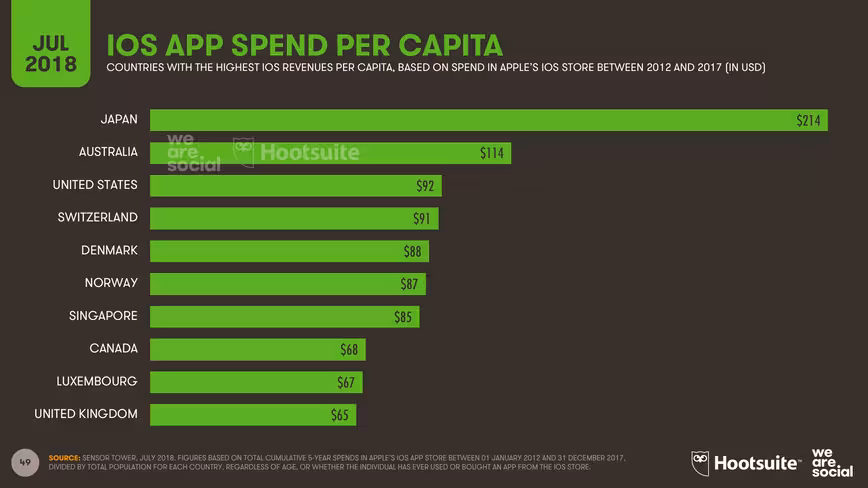
To celebrate 10 years of the App Store, Sensor Tower published a ranking of countries by per-capita spend over the five years from 2012 to 2017.
Japan tops this rankings by a considerable margin, with a per-capita spend that’s almost double that of second-placed Australia, and more than 3 times that of eighth-placed Canada.
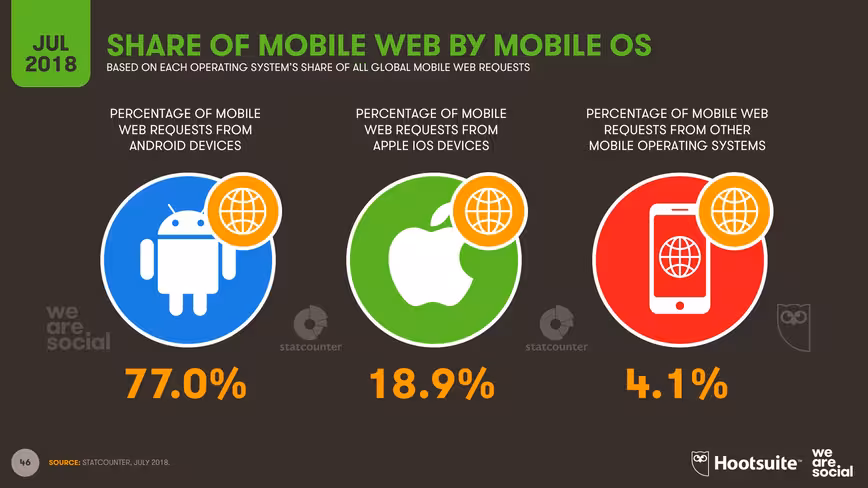
 On a broader level, Android has extended its lead over iOS, with StatCounter reporting that the Alphabet-owned operating system is now responsible for 77 percent of all web page requests from mobile devices.
Combined, Android and iOS now account for almost 96 percent of the global mobile market.
Parting thoughts
While trust and privacy remain important themes in the media, it appears that most everyday users continue to see more benefits than risks in the use of connected devices and services.
There are no obvious signs (yet) that these stories have significantly impacted people’s preferences or behavior, and as we head into the second half of the year, it looks likely that 2018 will be yet another year of standout growth in all things digital.
If you’d like to dig into all of our previous reports, as well as the latest country-by-country picture for 239 nations and territories around the world, simply click here.
Get the TNW newsletter
Get the most important tech news in your inbox each week.