As I mentioned in my last post, the data in my new 2018 Q3 Global Digital Statshot – produced in partnership with We Are Social and Hootsuite – shows that clicks on Facebook advertising have tumbled over the past three months.
The precipitous 20 percent drop in ad interactions has important consequences for marketers all over the world, so I’ll use this post to dig deeper into the data behind the headlines, and share some ideas for reducing the potential impact of this worrying trend.
What’s happened?
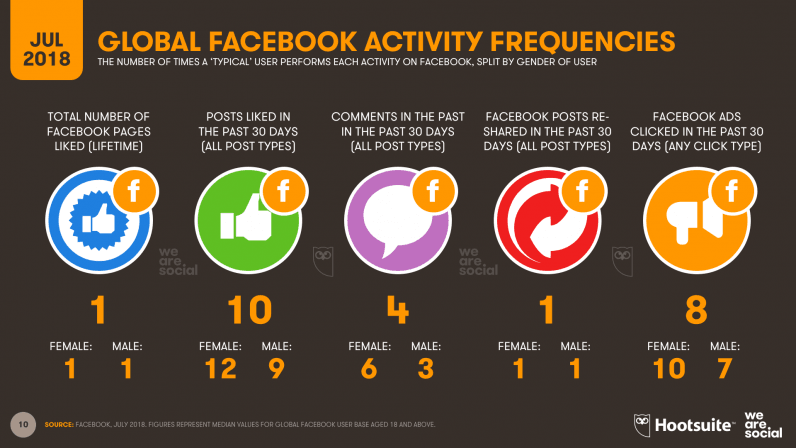
Facebook’s own Insights tool shows that the typical global user now clicks on a median of eight adverts per month, down from the 10 that the company was reporting back in April.
Also, as I noted in my analysis of our broader Q3 report, there may be many different reasons for this drop in interaction, and it’s difficult to determine whether this is just a temporary fluctuation, or part of a prolonged downward trend.
The only way to understand that would be to dig deeper into the data over time, so that’s exactly what I’ve started to do in this article, and my accompanying report, Facebook Engagement Insights & Benchmarks.
You’ll find a full breakdown of Facebook interactions for 225 individual countries and territories around the world in the SlideShare embed below (click here if that’s not working for you), but read on below for my comprehensive analysis of what all these numbers mean.
One more thing: at over 2,000 words, this post is a bit of a beast, so you might want to grab a coffee before you get stuck in…
Many users don’t seem to ‘like’ Facebook Pages
The most dramatic change in this set of numbers relates to the number of times that people click on Facebook adverts, but there’s another finding that has even greater significance for marketers.
Facebook’s Insights data shows that the typical global user has only ever ‘liked’ a median of one Facebook Page in all the time that they’ve been on Facebook.
Let’s put that startling finding in context.
The latest data show that well over two billion people use Facebook every month, with two-thirds of that audience using the platform every single day.
However, in the eleven years since Facebook launched Pages, the platform’s users have liked a median of just one Page each.
A global story
Before I analyzed the country-by-country data, I wondered whether this finding might vary by country, but Facebook’s latest data shows that users in 179 countries out of 225 have only ever liked a median of one Page each.
That means that a significant number of users in those countries have never liked even one single Page on Facebook.
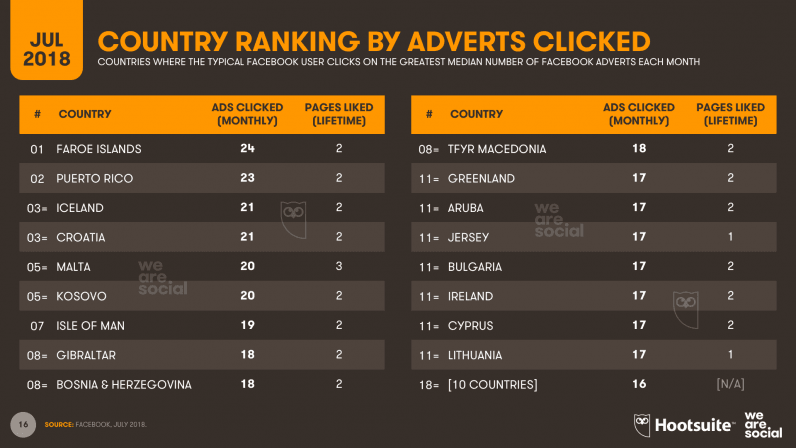
Users in 45 countries have liked a median of two Pages each, with users in just one country – Malta – having liked a median of three Pages each (for context, Malta has around 360,000 active Facebook users, or 0.01 percent of Facebook’s total user base).
Remember that these are lifetime likes, too – not likes per month.
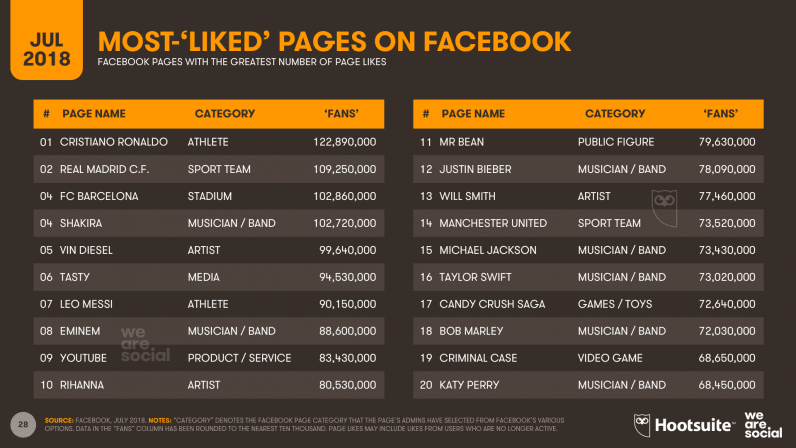
What’s more, when we look at the kinds of Pages that people ‘like,’ it quickly becomes clear that consumer brand Pages aren’t people’s first choice for that once-in-a-lifetime click.
Rethinking Facebook strategies
In simple terms, trying to grow a Facebook ‘fanbase’ probably isn’t the best use of your marketing budget.
That doesn’t mean that Facebook isn’t a good place for brand marketing, though.
Indeed, used correctly, Facebook activities can be a highly efficient and effective part of a brand’s marketing mix.
However, investing money, time, and effort in trying to increase your Facebook Page ‘likes’ probably won’t deliver the ROI you’re looking for, for two key reasons.
Firstly, as I noted above, most people only ever like one Page, and that ‘like’ is far more likely to go to a celebrity or a sports team than it is to go to a shampoo brand or a government department.
Secondly, and perhaps more importantly, even if you do succeed in growing a sizeable Facebook Page fanbase, you’ll still need to pay to reach most of your ‘fans’ every time you want to reach them.
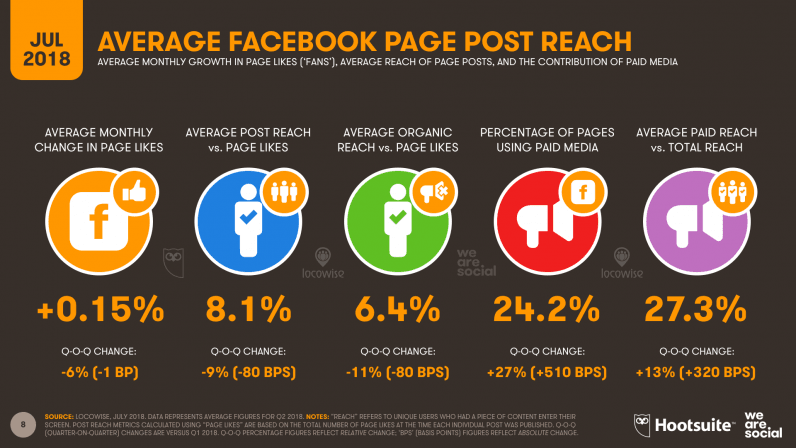
The latest data from social listening company Locowise suggest that the average Facebook Page post reaches just 6.4 percent of its Page’s fans organically (i.e. without paid support), meaning that just 1 in 15 of your Page’s fans will see any given post unless you promote it using paid media.
Based on that, you might be wondering why brands would ever try to build a Facebook fanbase in the first place.
And you’ve have a point; I ask the same question too.
The current situation seems a bit like buying a cup of coffee for $5, but then being charged $1 again for 14 out of every 15 sips you take from that cup.
But the irony is that you don’t need to buy the cup of coffee in the first place.
Facebook’s ‘promoted posts’ products allow advertisers to reach audiences on the platform regardless of whether those people have ‘liked’ the brand’s Page.
So, it’s probably time to ask yourself whether it’s really worth going to the effort and cost of building a fanbase in the first place.
Key takeaway: if you need to reach a sizeable audience on Facebook on a regular basis, go straight for the efficiency play, and use promoted posts instead of trying to build your Page’s fanbase.
No comment?
Analyzing the median number of times that people comment on Facebook posts each month may offer deeper insights into users’ ongoing levels of engagement with the platform as a whole.
It’s worth highlighting that Facebook reports a single figure for the median number of comments its users make per month, and doesn’t offer a breakdown by content format (videos, photos, links, etc.).
However, the numbers are still quite revealing.
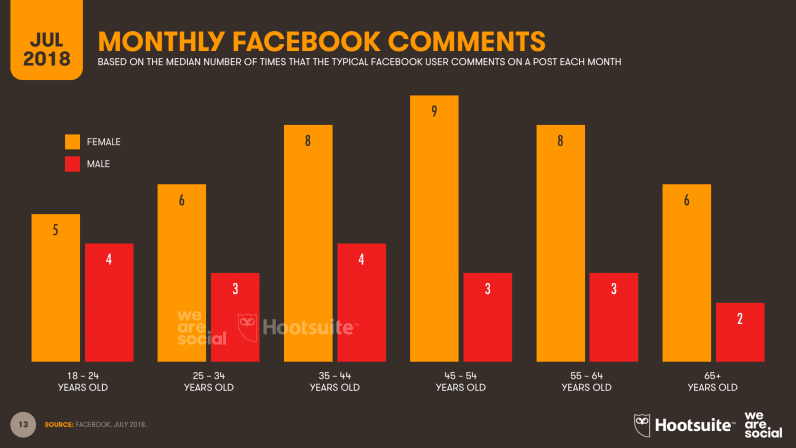
At a global level, the typical Facebook user posts a median of just four comments per month, with women twice as likely to post a comment compared to men (six for women, versus three for men).
In general, older users are more likely to post comments than younger users, with women in their 40s and 50s the most active ‘commenters.’
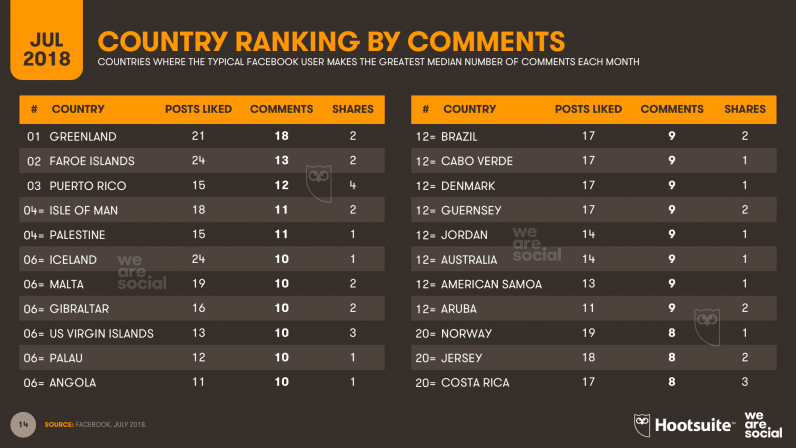
However, Facebook’s isn’t the top social platform in any of those three countries, so it may be that users in these countries use Facebook for different purposes and in different ways compared to the typical global Facebook user.
Key takeaway: with the typical Facebook user only posting a median of four comments per month, it’s unrealistic to expect significant numbers of your Page’s fans to comment on your posts. You’ll need to look for more inspiring ways to engage your audiences in meaningful conversation if driving comments is an important part of your strategy.
If sharing is caring… people don’t seem to care
Talking of expectations, brands are even less likely to inspire people to re-share their Page’s posts.
At a global level, the typical Facebook user re-shares a median of just one post per month, meaning that a significant number of users never re-share any posts at all.
The data show that women in their 40s and 50s are slightly more likely to re-post content, but even amongst this group, the median number of re-shares is still only two per month.
Key takeaway: if you want people to re-share your content, you’re going to need to publish something pretty extraordinary. In reality, if you’re hoping to increase the reach of your Page’s content, paid post promotion is a more reliable approach compared to relying on your audience to re-share your Page’s posts.
But how do you make sure that your promoted posts are as efficient and effective as possible?
The good news is that the data offer some insights there, too.
Facebook ads: diminishing returns?
As I noted above, the number of times that users click on Facebook ads has dropped dramatically in the past three months, from a median of ten adverts clicked per month in mid-April, to a median of just eight adverts clicked per month by mid-July 2018.
That still translates into literally billions of clicks every month though, and Facebook advertising still offers huge potential for marketers who understand their brand’s audience.
So what do you need to know about Facebook ad clicks?
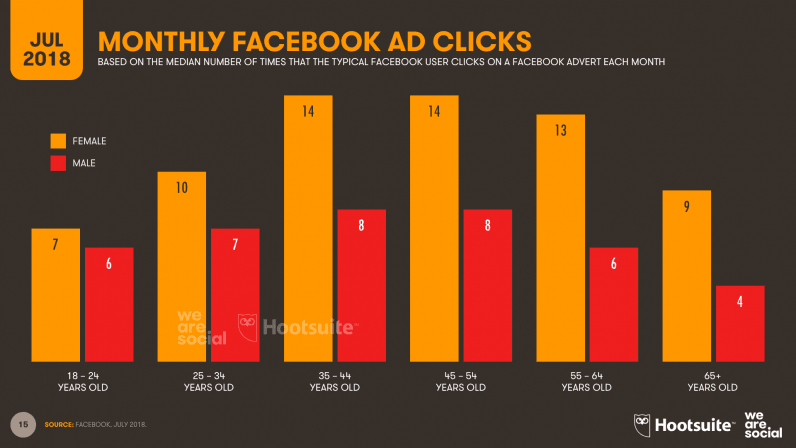
The first thing to note is that women click on Facebook adverts more frequently than men do.
The typical female user clicks on a median ten Facebook adverts per month, compared to a median of just seven for male users.
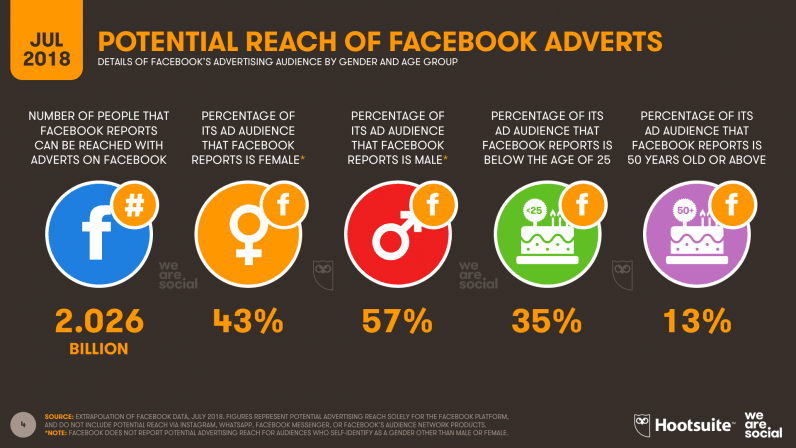
The latest data suggest that just 43 percent of the platform’s total audience self-identifies as female, compared to 57 percent who identify as male [note: for safety reasons, Facebook doesn’t offer advertising insights for users who identify as a gender other than binary ‘male’ or ‘female’].
Ad clicks vary considerably by age too, with users between the ages of 35 and 54 clicking on the greatest number of adverts each month.
Conversely, users at the two ends of the age spectrum are less likely to click on Facebook ads, with users over the age of 65 the least likely to click on adverts.
These age findings hold true across male and female users.
Ad engagement also varies meaningfully between countries, with users in countries across Africa and developing Asia much less likely to click on adverts compared to the typical global user.
However, it’s unclear whether this difference is due to individual perceptions of advertising, or whether there are simply fewer companies advertising on Facebook in these regions, resulting in fewer adverts for users to click on.
At the other end of the scale, The Faroe Islands tops the ranking of countries by median number of ads clicked each month, with the typical user in the North-Atlantic archipelago clicking on a median of 24 Facebook adverts per month.
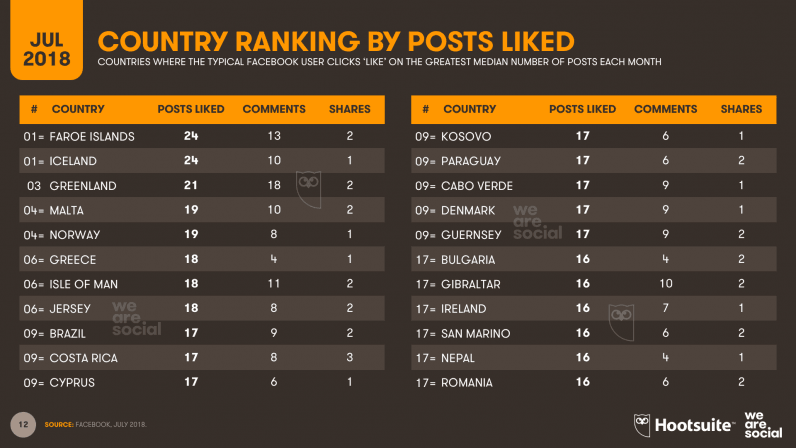
Users in both North European countries ‘like’ a median of 24 posts per month in the past 30 days, with these likes spread across organic and promoted content.
Critically, if you post content to Facebook every day, you’ll probably struggle to drive meaningful click rates on each individual post.
My advice: adopt a ‘varied diet’ approach to Facebook advertising, with some posts designed to increase basic awareness or salience without any need for interaction, and only a handful of carefully crafted posts designed to elicit more direct engagement (e.g. a click).
But how can you maximise the likelihood that people will actually click on your content when you need them to, without resorting to tricks or clickbait?
The case for video
Facebook doesn’t offer insights into post performance by content format, but fortunately, Locowise does.
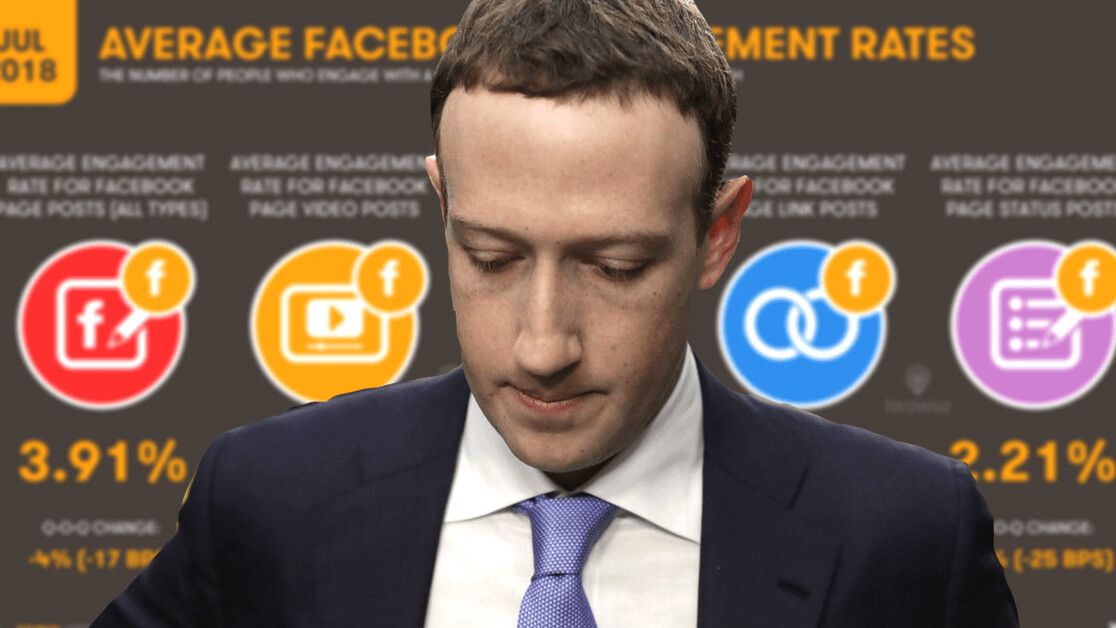
The social listening company’s latest findings suggest that less than four percent of the people who see the average Facebook post interact with it in some way.
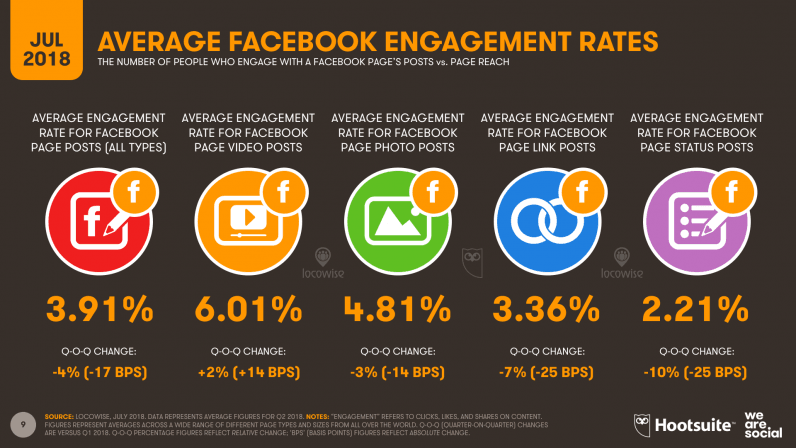
As a result, you may see quite different results on your own Page. Moreover, engagement rates vary considerably by content format.
Video seems to perform best, with an average of six percent of users who see a video post in their Facebook Newsfeed going on to click, like, comment on, or re-share the post.
Photos are the second-most engaging content format, although the latest data suggests that less than five percent of those users who see a photo post in their Newsfeed will go on to engage with it.
At the other end of the spectrum, ‘status’ (i.e. text-only) updates deliver the lowest levels of average engagement, and Pages can expect just 1 in 45 of those people who see a status update in their Newsfeed to engage with it in any way.
Key takeaway: if you’re going to invest in paid promotion of Facebook content, you’ll likely see a better return on that media spend if you invest in quality video content.
My advice: focus on creating video content that adds genuine value to your audience – based on their interests and needs – rather than continuously pumping out brand-centric ‘propaganda’.
Digging deeper: the country-level data
The full Facebook Engagement Insights & Benchmarks report contains local data for 225 countries and territories around the world, so marketers should dig into the specific findings for their focus market(s) before making any decisions based on the global figures outlined above.
You’ll find the full report in the SlideShare embed at the top of this post, but click here if you’d like to download a PDF of the report for easy reference.
Get the TNW newsletter
Get the most important tech news in your inbox each week.