In this series of blog posts, I’ve enjoyed shedding some light onto how we approach marketing at The Next Web through Web analytics, Search Engine Optimization (SEO), Conversion Rate Optimization (CRO), social media, and more. This piece focuses on what kinds of data and metrics we track around engagement.
You’re reading this blog post and we’ve already counted this as a page view in terms of web analytics (thank you!). But that’s not the only information we have about your engagement with our page.
We know what kind of links you’re clicking within the article, the related stories you’re clicking on, and if you’re sharing our content via the social sharing buttons at the top and bottom of the article. This data provides us with better insights into your behavior – if you like the content or not and what that says about our performance.
Below I’ll share what we track, how we track it, and what we do with the data. Content analysis versus engagement metrics!
What are we tracking?
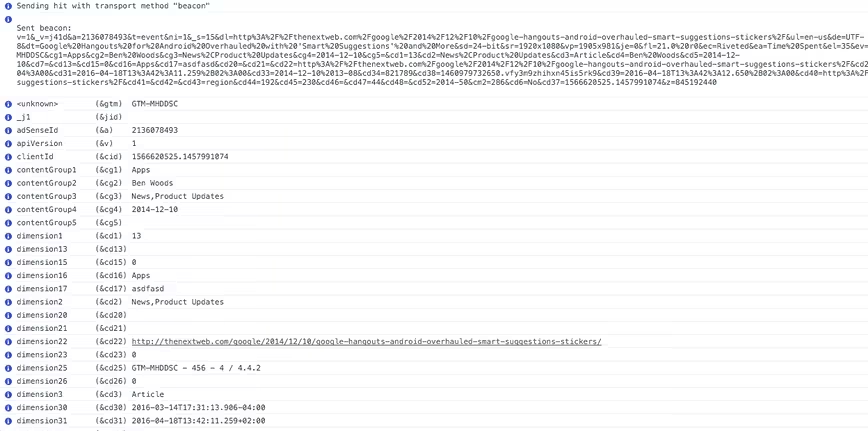
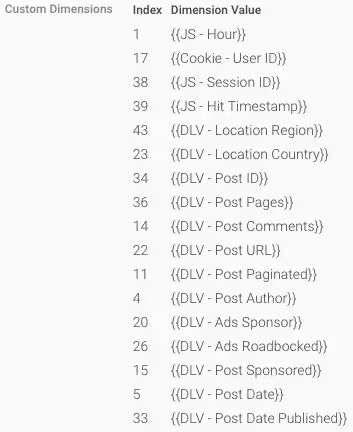
There is a lot of information about our posts that we’d like to save in our Google Analytics setup. The real analytics geeks already noticed via the Google Analytics browser add-ons that we’re sending a couple dozen custom dimensions on hit level to our account. The information contains for example:
- Author
- Published date
- Category
- Tags
- Related companies
- Number of videos within the post
- Number of images within the post
- Etc.
This kind of data doesn’t say anything about your engagement yet, but as we publish over 30 to 40 new articles a day, we want to be able to, over time, analyze in depth the articles that work and the ones that don’t.
We could not save the data and only go with post IDs (this is the ID that would be saved in our WordPress database). But that makes our lives a bit harder as we need to cross reference two data sets – Google Analytics plus our WordPress database – instead of having it in one: Google Analytics. As it’s just more work to cross reference the data sets, it’s something we don’t like to do.
The data we send provides us with way more context in a (mostly) quantitative way, helping us make easier connections between the data on a larger scale.
For example: We use these custom dimensions to get deep insights into what makes a post work out and what doesn’t (which is super hard).
How do we track it?
In earlier posts in this series we’ve already mentioned that we love the dataLayer, that’s why most of the data around posts that we’re working with is powered by it. The meta data is saved on a post level in the dataLayer and set-up in GTM as variables. In our Google Analytics Tag in Google Tag Manager it is then powered as a custom dimension, as you can see in the screenshot below.
Event tracking
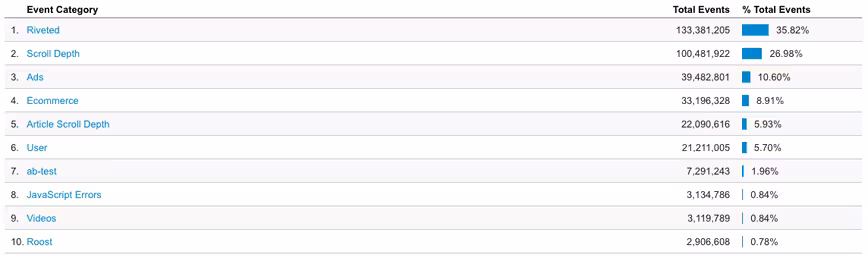
Besides the data that we send in custom dimensions we do track dozens of events per pageview via event tracking. We do that via a couple of libraries:
- Riveted: Every five seconds if you’re still in view we send an extra event to Google Analytics to make sure we keep the time on page up to date.
- Scroll-depth: For every 10 to 25 percent you scroll on an article page we send an extra event to know how much you go through the article.
- In/Out view: Ever wondered how many times you leave this pageview to go somewhere else? Quite a lot, that’s why we’re tracking for some browsers (mostly depending on JS support) if you leave the focus in the view. If you do, we track it and send an event for it.
- Ads: For every ad that loads we send events to our Google Analytics account in order to make sure that we know what ad units do or don’t load. On average we send four to five events just after DOM Ready (the moment you can interact with the page).
Why do we track so many events?
There is a problem with having a very high bounce rate: our time on pages can be very low. What would mean that the data that Google has on the time on page is very inaccurate. People who leave the page would not have a time set.
That’s what tracking a lot of events helps with – every time we do this, the time on page will be adjusted, so these days we’re pretty sure we’re not more than five seconds off (the time our riveted scripts take into account) as at least every 5 seconds we will send an event.
The metrics do we focus on
All of this event tracking adds a ton of data to our Google Analytics, but what do we do with it and what are the metrics we’re focused on in tracking engagement/reader loyalty? That’s why we love custom metrics so much. So the core metrics we focus on:
- Pageviews per visit: as we get more engagement it makes it easier to push the user through a certain journey. If we can get him more engaged with TNW, we’re probably able to convert him into a more loyal user.
- Pageviews per user: We created this custom metric in order to track how many pageviews a user is doing. If we influence this number we know that we’re improving two things at the same time – more users are returning and we’re increasing engagement to trigger more pageviews in a session.
- Time on page: A user that spends more time on a page (taking into account the length of the content and video/images) is more useful to advertisers as he can be more easily influenced.
Why these metrics?
The core metrics for TNW are quite obvious being a publisher as we focus on increasing our unique user base in terms of unique users. Followed by that, the data that we look at is returning users on a monthly basis, so we get a sense on the people who tend to like us. The last two bigger metrics are focused on pageviews per visit and the average time on site/page.
We chose these metrics because they are the most helpful to show us how this data affects our growth at TNW. Influencing the number of pageviews per visit would make sure that we grow the revenue and our goals.
Why not focus on conversion rates?
We do, but still selling 10,000 tickets based on millions of traffic is a very low conversion rate. That’s why the conversion rates can differ easily with very high percentages on a daily/weekly basis so we don’t tend to look at it too much.
Insight examples
We save so much data not just because we like ‘bigger data’ (although we love it). We do it because it also makes our lives easier knowing in what ways you consume our content, it teaches us what we can bring to the web in the future and how to write the content you’d like to see. Here are two examples of what we can conclude from some of the data we collect:
- We look at bigger areas on the page that can influence you to click through to another article or feature on the site. We can tell what is the impact of you sharing an article on Facebook if you visit the site through a link on Facebook. Based on the data that we have, it’s way higher than if you’re coming from Twitter.
- We know that the influence of a video or multiple images on a blog post is often very small based on the data that we have these days. That’s why we knew we didn’t have to go forward (for now) with certain partnerships around this topic.
What kind of data would you be tracking or how is your content analysis set up? Share your ideas around this in the comments!
If you missed the previous posts in this series, don’t forget to check them out: #1:Heat maps , #2: Deep dive on A/B testing and #3: Learnings from our A/B tests, #4:From Marketing Manager to Recruiter, #5 Running ScreamingFrog in the Cloud and #6 What tools do we use?, #7 We track everything!, #8 Google Tag Manager , #9 A/B Testing with Google Tag Manager and #10 Google Search Console, #11: 500 Million Search Results.
This is a #TNWLife article, a look into the lives of those that work at The Next Web.
Get the TNW newsletter
Get the most important tech news in your inbox each week.