
It’s easy to root for Kickstarter. The company has made it possible to bring new, innovative products to market and finance projects that would never get off the ground before the popularization of crowdfunding. It’s created an entirely new class of entrepreneur, and the way it turns the investment business on its head is a textbook example of disruptive technological innovation. But mostly, we’re all still just amazed at how money much the company has managed to help independent entrepreneurs raise.
Last year, to celebrate the company’s second anniversary, Kickstarter posted some metrics to the company blog. Among the most impressive figures was $40M pledged to 7,496 successfully funded campaigns, or 85% of the total amount pledged on the site.
As Kickstarter’s third year comes to a close, The Next Web wanted to know: How much did the company help raise? Since we know the company takes 5% of funds raised, this also gives us insight into its revenues.
Methodology
To find out, I wrote a short script (available here) using a simple scraping library which I forked on github. After fixing a bug caused by a change in Kickstarter’s URLs, I was able to pull down all of the successfully funded campaigns from the past year on Kickstarter’s website. The charts below were generated by importing the resulting comma-separated file into Excel and organizing the data into pivot tables. They cover the period from April 28, 2011 until the afternoon of April 21, 2012.

The 💜 of EU tech
The latest rumblings from the EU tech scene, a story from our wise ol' founder Boris, and some questionable AI art. It's free, every week, in your inbox. Sign up now!
Before we begin, some caveats: first, this is not official data from Kickstarter. Second: we are discussing actual money raised, not total pledged; the total amount pledged is not our concern here, as it includes projects which did not meet their funding goal. Third: we’re only looking at projects which have officially ended, as funds are not charged until the campaign end date, so some larger projects like the Pebble Watch, which ends May 18, are not counted. Fourth: the site has no API, so these numbers were pulled using screen scraping, a technique that is reliable if done well, but can introduce errors into the data if the HTML being scraped is not consistent and well-formed. I made every possible effort to verify the data being pulled by matching the data on the site, but there still may be some slight inconsistencies with the company’s official numbers.
Amount raised for successful campaigns
The results are awe-inspiring. In the year since Kickstarter reported its numbers, the company helped raise a total of $119.6M for successfully-funded projects. That’s almost three times as much as the amount raised during the company’s first two years. Taking into account Kickstarter’s 5% commission, we can estimate that the company took home just shy of $6M in commission revenue in its third year. And it’s not the only one cashing in: with Amazon’s commission of 2.9% plus 30¢ per transaction, the online retailer pulled at least $3.M in fees during the same period.
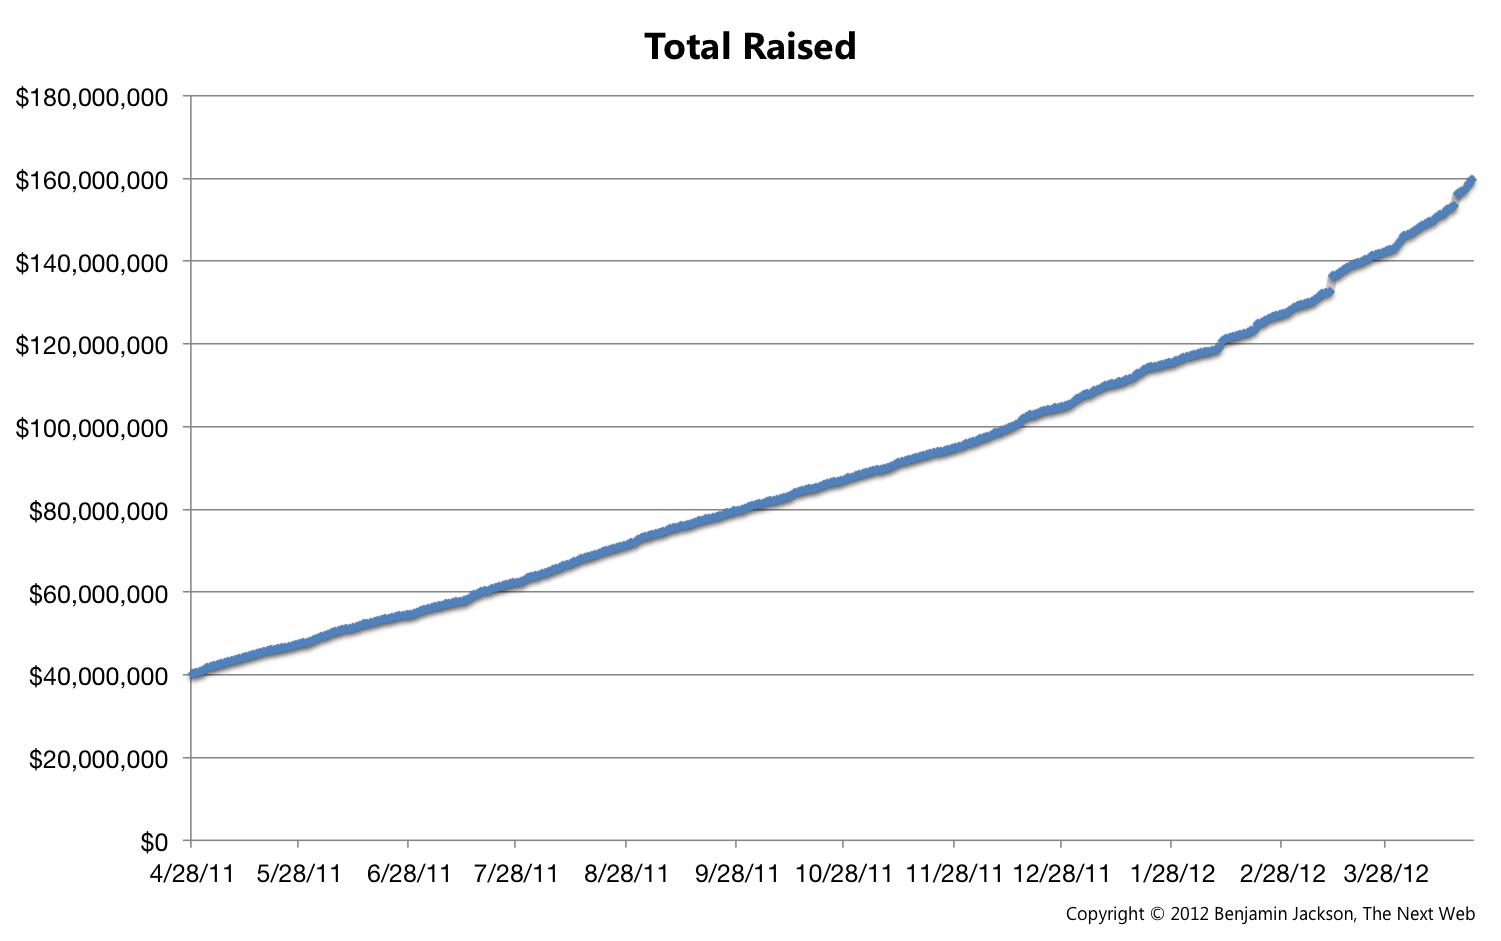
Adding in the figures from last year, it looks like Kickstarter has helped raise a total of $159M since its inception.
Growth in projects funded and average funds raised
Kickstarter’s accelerated growth in total funds raised is directly related to two other trends: an increase both in the number of projects funded, and in the amount raised, on average, by successful projects.

 Both of the charts above show a positive linear trend: more projects are being funded every day, and on average they’re pulling in more money per project as well. The average number of projects funded rose from a little over 30 to 45 per day in the last year, and the average funding per project — excluding those which raised over half a million dollars, in order to keep outliers from skewing the averages — rose from around $5k to just over $10k.
Funding by Category
What kinds of projects brought in the most money over the last year? Kickstarter has 13 categories ranging from Film & Video, by far the most popular, all the way to more niche interest areas such as Comics. We can break down the successful projects to get more insight into how the different categories stack up.
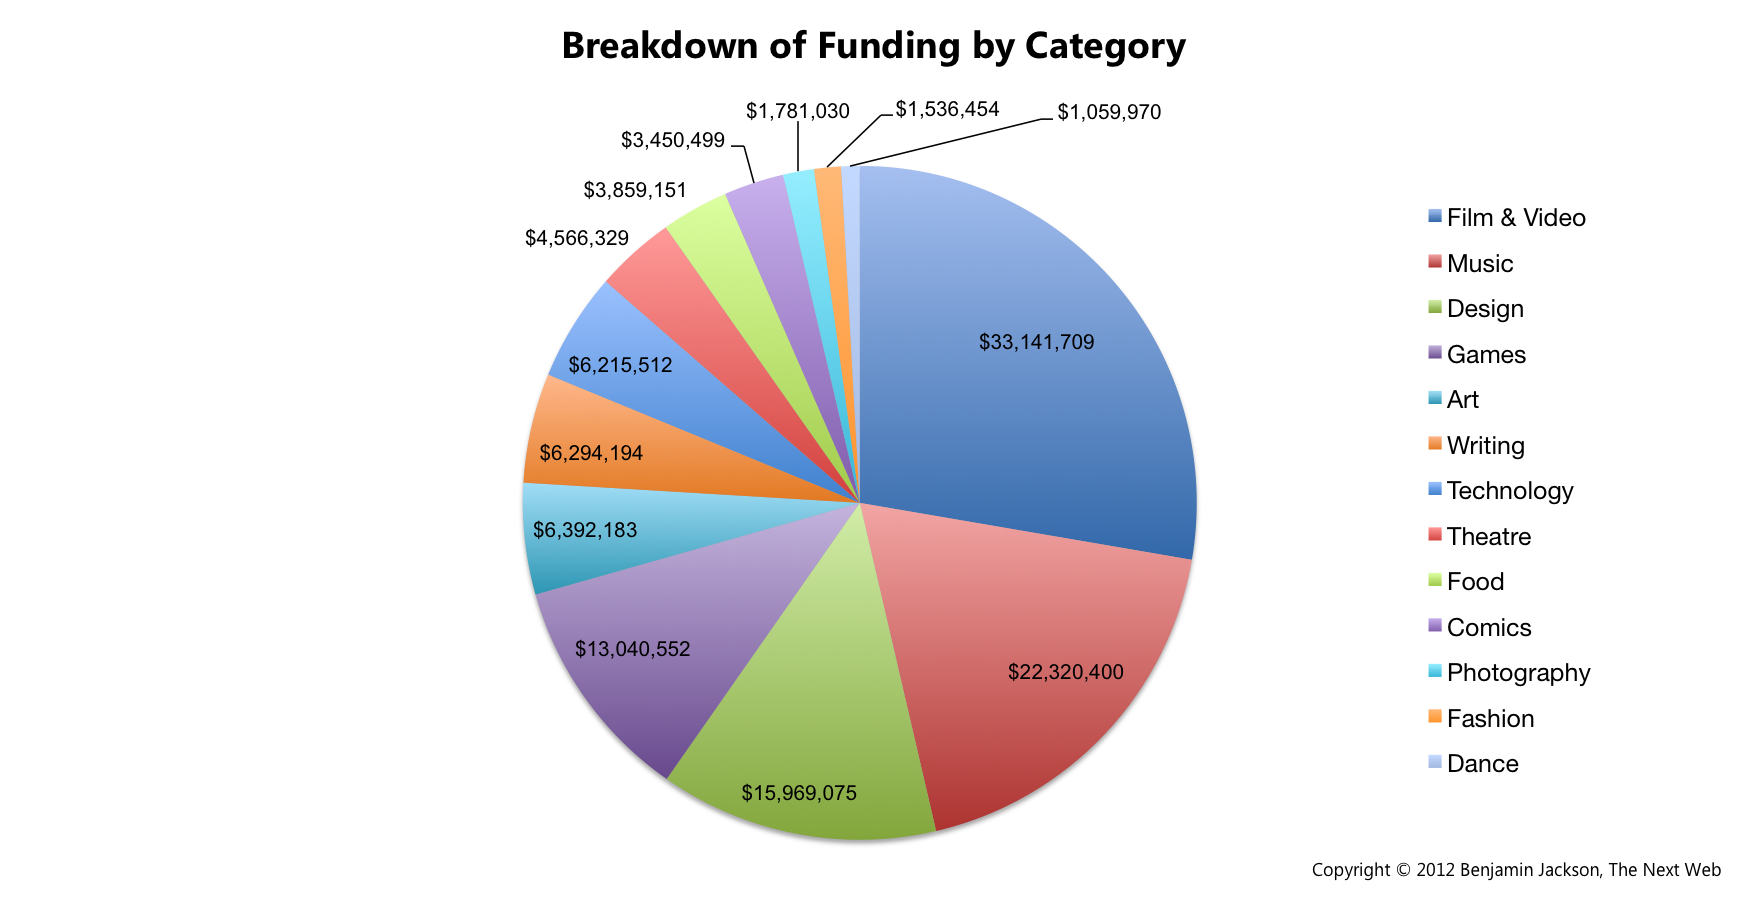 The first thing we see when splitting out the projects is that funding is still dominated by Film/Video and Music: together, the two make up almost half of the money raised over the past year. Dance and Fashion are still on the tail end, but Games went from tenth place last year according to Kickstarter’s official data to fourth this year in our study, no doubt aided by the massive success of projects like Double Fine Adventure and Wasteland 2.
What’s most surprising, however, is the disparity between the typical amounts raised by Technology, Games and Design projects and the other categories:

Projects in those three categories raised between $30-40k on average, while those in the other categories raised an average of $10k or less. While the averages above are somewhat skewed by projects, like Double Fine Adventure, which were hugely successful in those categories, they are still considerably higher than others when excluding projects which raised more than $500k.
Another interesting metric is by how much successfully funded projects exceed their funding goal:

When we look at these numbers, Design is a huge outlier, with the average successful project generating ten times its funding goal. The average percent funded for other categories ranges from 130% to 500%.
Finally, let’s look at the leaderboards to see which projects have raised the most money, as well as which ones exceeded their funding goals by the largest amount.
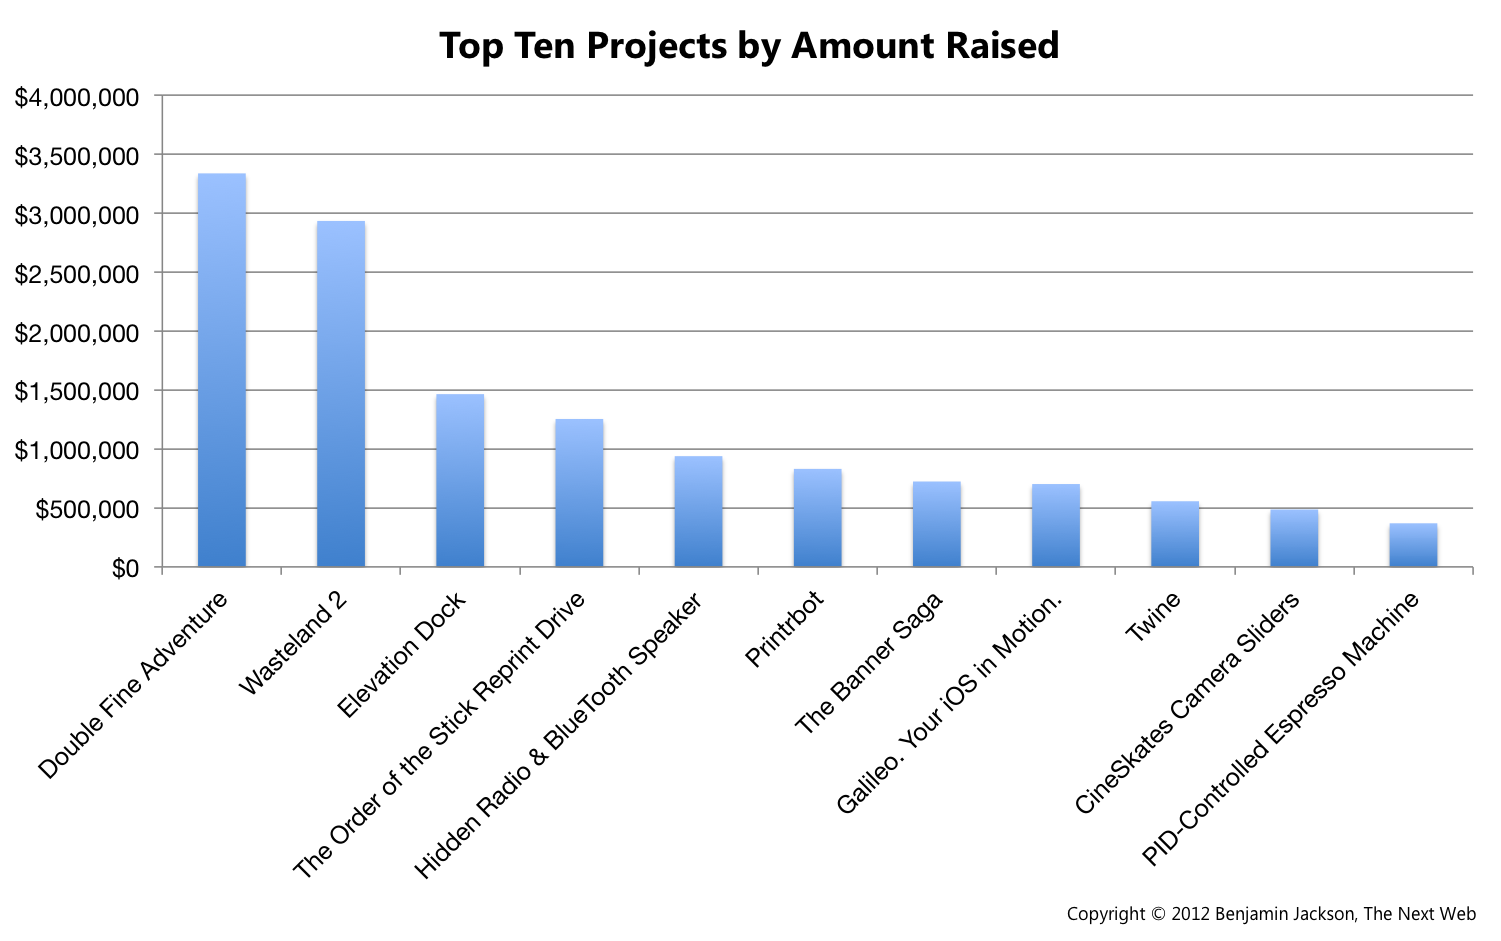
The names on the gross revenue leaderboard should be familiar to anyone who’s followed Kickstarter news recently: Double Fine Adventure, The Elevation Dock and Twine all feature prominently.
The percent funded leaderboard looks very different. (Note: projects with very low goals or which made less than $100k were excluded to avoid skewing the results.) The only projects to make both lists were the Printrbot, The Order of the Stick Reprint Drive, and the Capture Camera Clip System. It would appear that some — though less than half — of the highest-grossing projects are “sleeper hits” that wildly exceeded their creator’s original hopes.
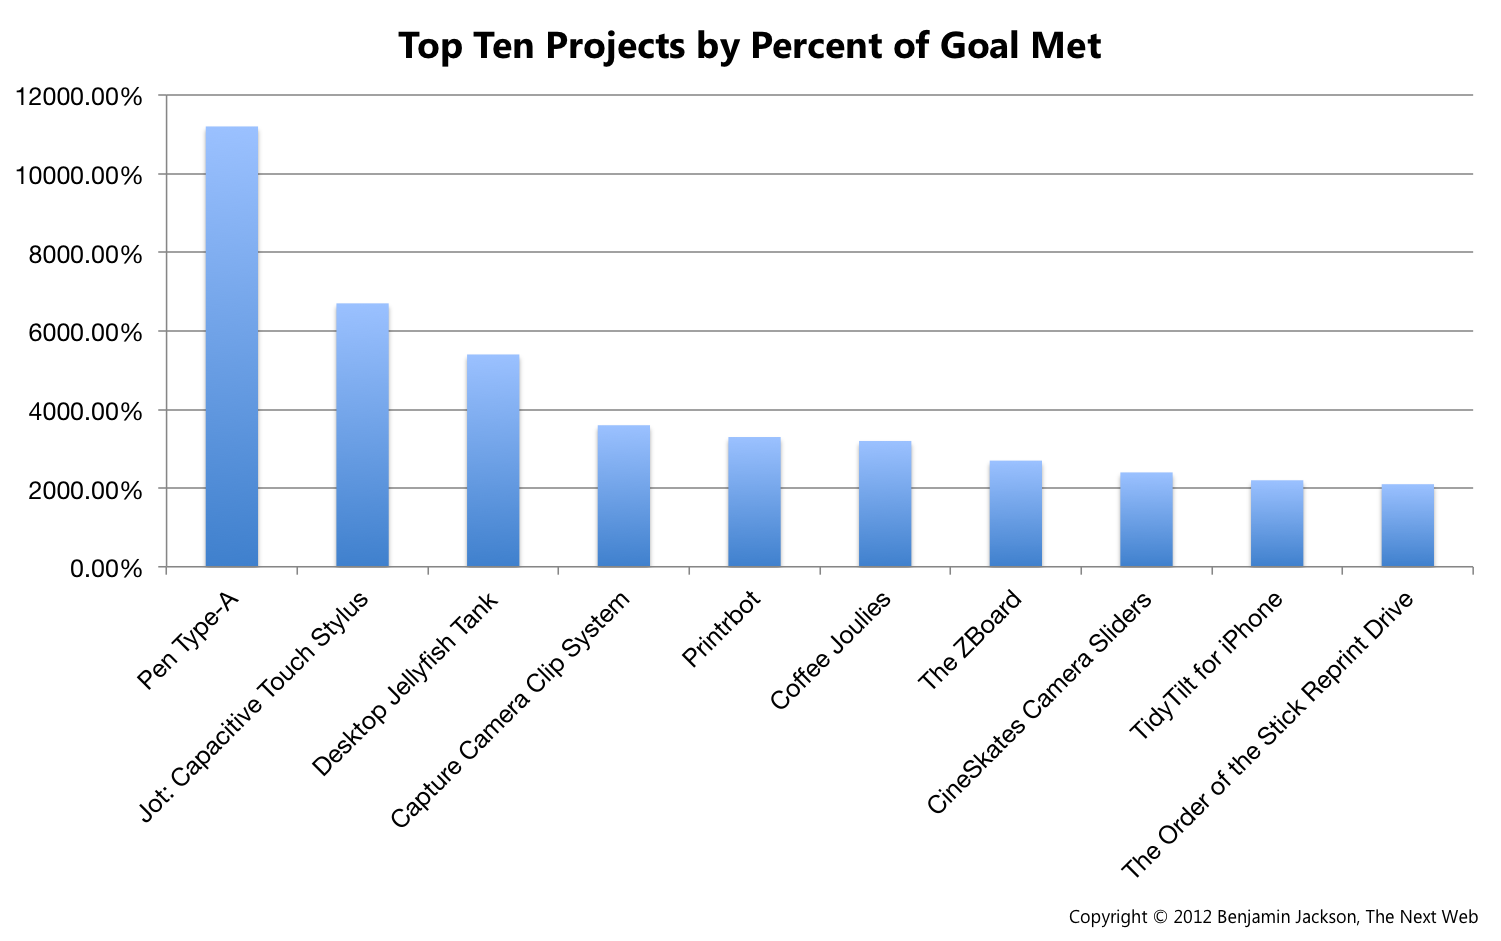
Some of these projects went way over their funding goal. Pen Type A, the leader in percent funded, raised over 112 times CW&T’s original goal of $2,500.
What about next year?
If we look at a year-long extrapolation of the total amount raised on Kickstarter, we can make an educated guess about how much the company will raise in its fourth year. The question we have to ask is: Do these numbers reflect a linear growth pattern, or an exponential curve?
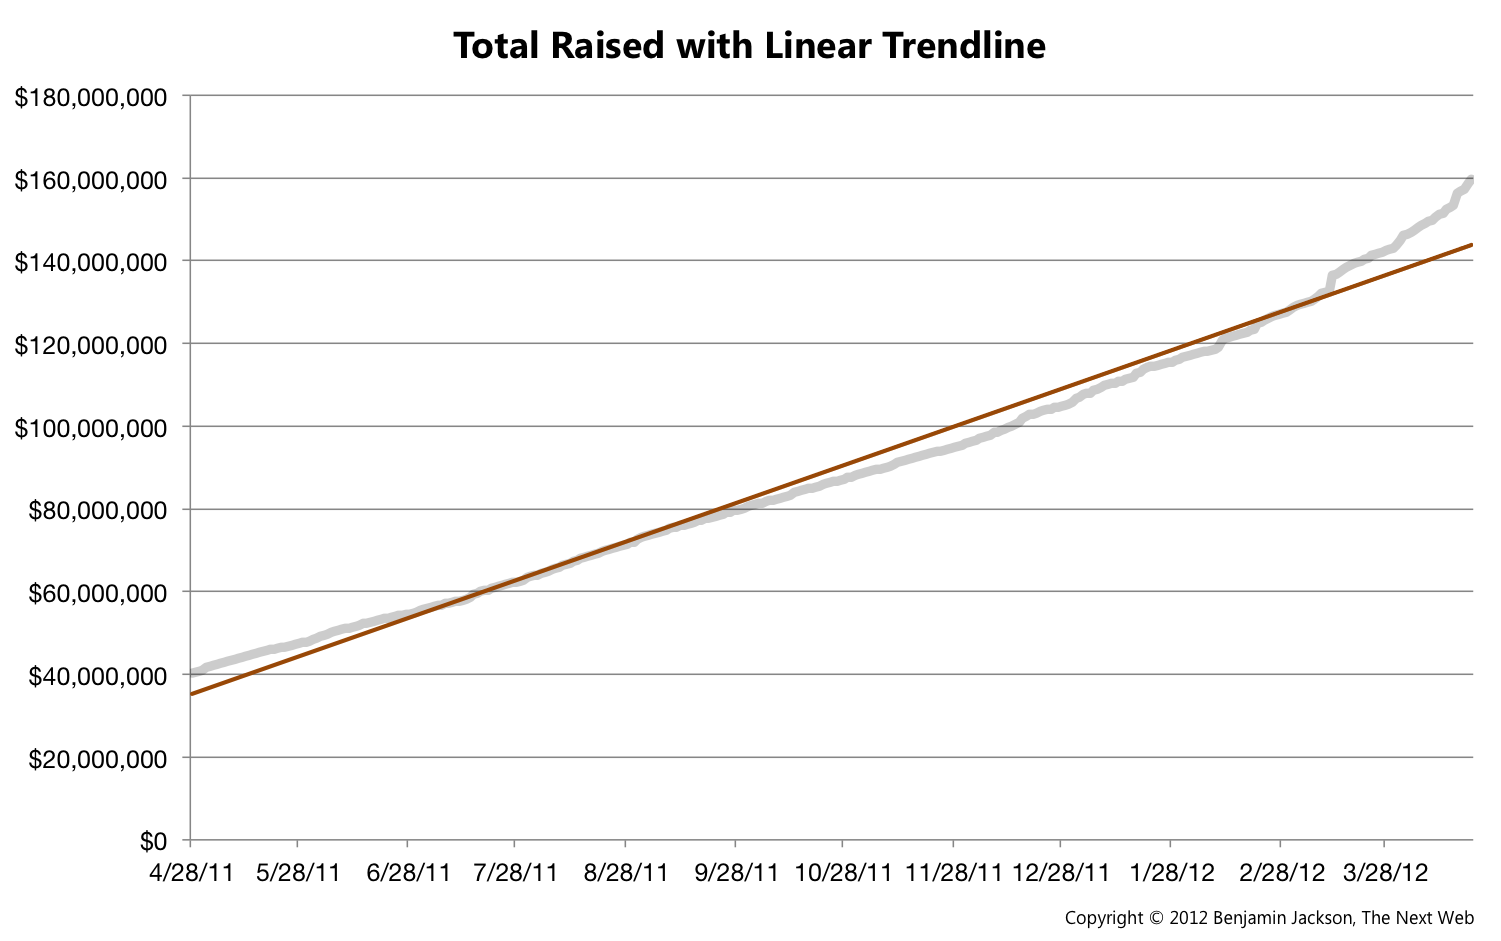
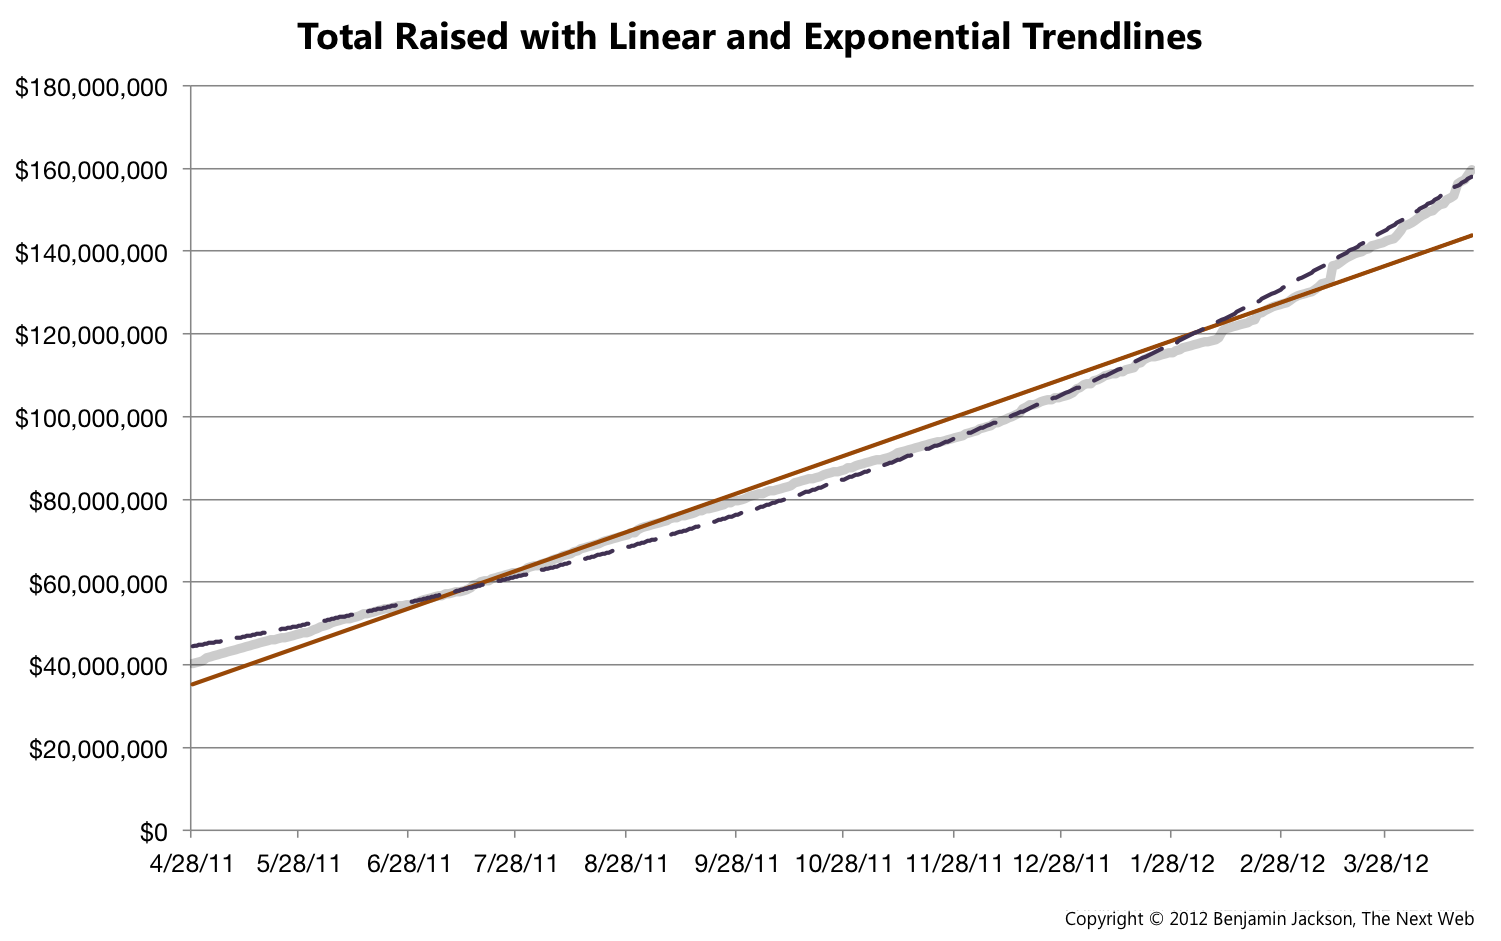
It’s clear from the data above that the growth is faster than linear. Here’s the same chart with linear and exponential trendlines overlaid (the dashed curve is exponential):
We can find further evidence of an exponential growth curve by looking at the same chart graphed on a logarithmic scale. A log scale chart of an exponential curve will show a perfectly straight line. Here we see that a linear trendline, while not a perfect fit, fits the data fairly well:
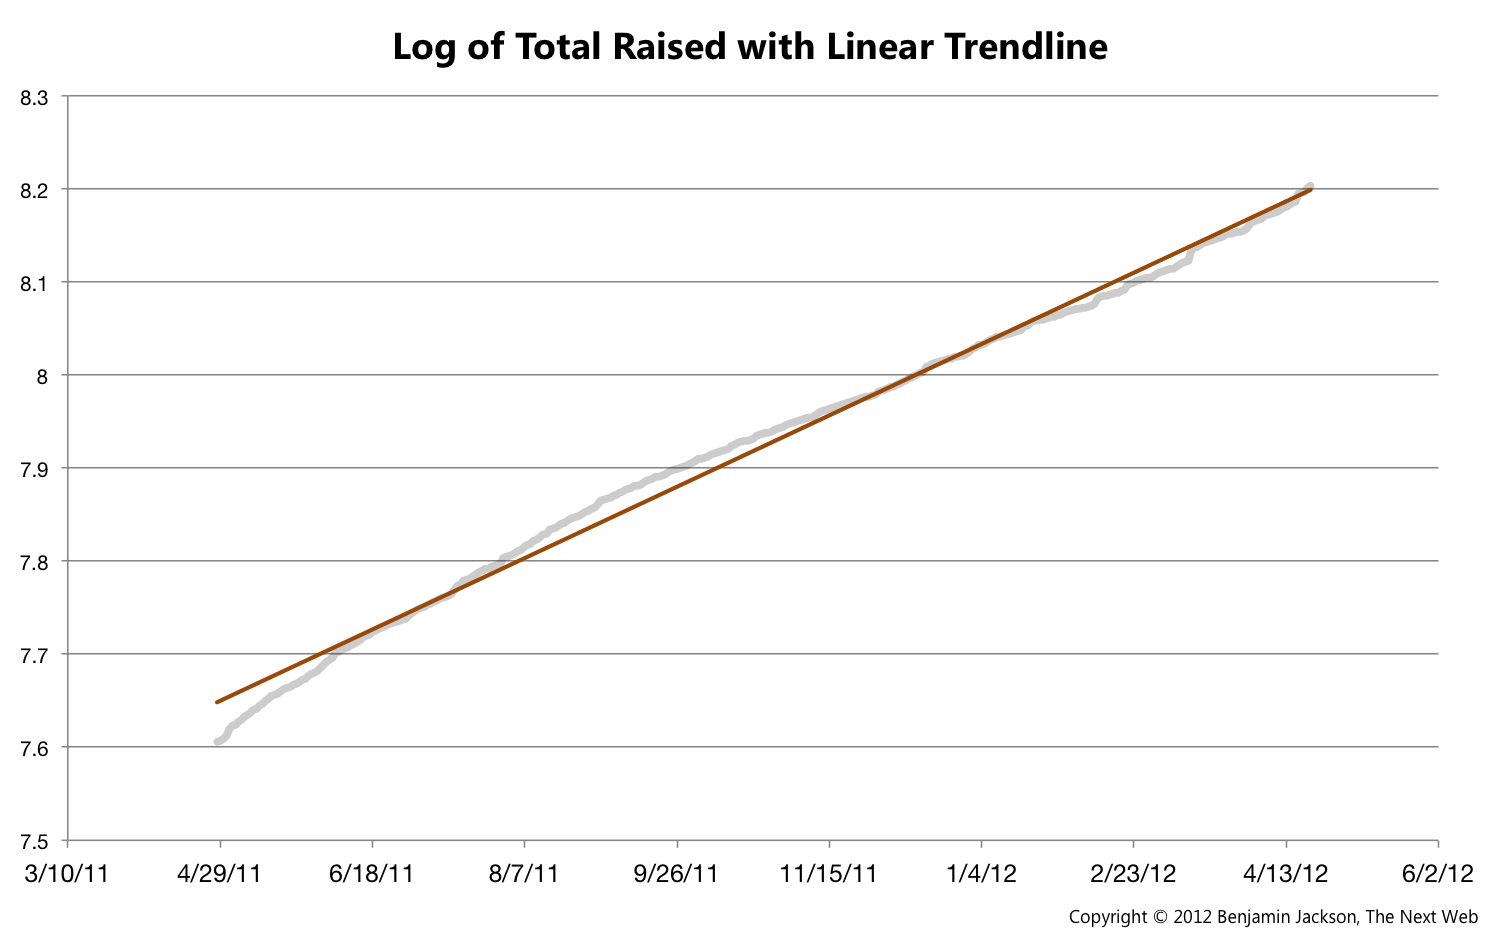
Based on this, we can make a fairly safe assumption that Kickstarter’s growth will be greater than linear, but may not be quite exponential. The following chart shows the upper and lower bounds of what we can expect the company to generate in funding for projects which meet or exceed their goals:

The trendlines put the total raised at between $250M and $550M by this time next year. It appears to be a safe bet that the company will hit $200M sometime between June and November.
Between the huge success of Double Fine Adventure, which raised over $3M, and the string of million-dollar campaigns that have appeared in its wake, the company seems set for another record-breaking year. And if the numbers from the past twelve months are any indication, I doubt the team will be able to fit into their current office on New York’s Lower East Side for long.
Update: the original version cited an incorrect figure, $156M, as the total amount raised since launch, which failed to include projects from the final data set. Charts have also been updated with links to the full-size image.
gualtiero boffi via shutterstock
Get the TNW newsletter
Get the most important tech news in your inbox each week.