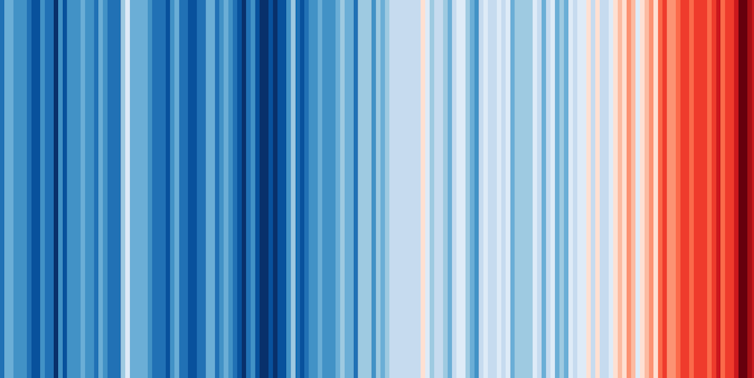
It seems that people are finally waking up to the threat of climate change. The most poignant sign of this for me was seeing an infographic I created adorning the main music stage at Reading Festival 2019.
While the majority of those in the crowd may not have grasped its true meaning, or been in the frame of mind to understand it, it was a significant moment. A popular rock band publicly endorsed climate research and literally put it centre stage.
The climate stripes illustrate the global average temperature for every year since 1850 in the form of a colored stripe. Shades of blue represent cooler years and red, warmer years. The overall effect is a striking trend towards hotter temperatures in recent decades, as a result of human-caused climate change.

The climate stripes follow other visualizations of climate data that I’ve created in recent years, including an animation depicting global temperature rise data as an ever-expanding spiral. This was used in the opening ceremony of the Rio Olympics in 2016 – more public recognition of science where you’d perhaps not expect it.
These graphics are simple and bright, but they’re based on solid science and carry a serious message. They translate complex data into an easily accessible format that transcends language and needs almost no context to explain it. The climate stripes have already been used on posters, on placards in the youth climate strikes and on banners and t-shirts around the world.
Helping science to make this leap from the lab to social media is crucial to changing mindsets. My research has often focused on communicating the impacts of climate change to new audiences. The more people that see and understand this huge problem, the better chance we have of solving it.
Earlier in 2019 we created a website that allows people to download climate stripes for around 200 countries and individual US states. This allowed people to share stripes which charted the recent climate history of their own corner of the world. TV weather forecasters around the world joined the campaign and used the stripes to talk about climate change in their regular broadcasts.
After a million downloads in the first week, dozens of examples appeared online of people wearing the stripes on ties and scarves, or even printing them on their Tesla. A town in Germany even printed them on a tram.
Explaining climate science to the public can be tricky. The scientific consensus is that the world is warming, but each region of the world is warming at a very different rate. Most parts of the UK are about 1℃ warmer than they were a century ago, while parts of the Arctic are almost 3℃ warmer. The climate stripes can communicate this nuance almost instantly.
If we want climate action to become the demand of a mass movement then we can’t expect discussions to be restricted to po-faced conversations between scientists and politicians. As grave a matter as it is, it needs to become a conversation we have everywhere, whether it be over the fence to our neighbors, on television soaps or while dancing at festivals. These simple graphics have helped start those conversations.
Climate change is inevitably reported in a negative way, but we can be positive about the story we tell. Infiltrating popular culture is one way scientists can help trigger a step change in attitudes that will lead to mass action. We face some difficult choices, but we still have time to make changes that will create a hopeful future.
This article is republished from The Conversation by Ed Hawkins, Professor of climate science, University of Reading under a Creative Commons license. Read the original article.
Get the TNW newsletter
Get the most important tech news in your inbox each week.


