Even though it probably affects our lives every single day, most of us have no idea what a “knowledge graph” is. Asking your favorite voice assistant what the weather will be like tomorrow? That’s thanks to a knowledge graph.
But what exactly is a knowledge graph? Well, there’s actually some debate on what the best definition is, but a recent research paper put it like this:
A knowledge graph acquires and integrates information into an ontology and applies a reasoner to derive new knowledge.
In other words, a knowledge graph is a programmatic way to model a knowledge domain with the help of subject-matter experts, data interlinking, and machine learning algorithms. The easiest example is probably the box you see in Google’s results.

A knowledge graph is typically built on top of the existing databases to link all data together at web-scale combining both structured information (i.e. the list of startups attending our TNW events) or unstructured (articles like the one you are reading now).
Connecting datasets in a meaningful way is strategic for every business as it helps decision makers, users, and (above all) computers gain context within the existing knowledge of an organization. That’s why tech giants like Amazon, Facebook, and Google invested millions of dollars to create their own knowledge graphs. But how do knowledge graphs work in practice? Well, one of the best examples is its effect on SEO.
How knowledge graphs work with SEO
Google’s Knowledge Graph was introduced in 2012 to provide more useful and relevant results to searches using semantic–search techniques. Google Knowledge Graph uses the relationships between words and concepts to understand the context of a query and to assign specific meaning to user intents.
I find it very useful to present the effect of connected data on SEO with a simple query about TNW that you can ask your Google Home or Google Assistant powered devices. Try asking Google “Who are the founders of The Next Web?” As you can see in the screenshot below, Google intercepts the query and translates the search string into specific instructions to provide us with an immediate answer.
Interestingly, we can also see that Google is capable of properly disambiguating “The Next Web” into the entity that describes “TNW.”
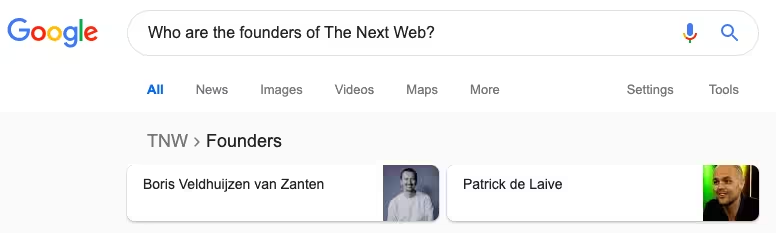
This is possible because “The Next Web” is a concept (or an entity) – in the Google Knowledge Graph – that describes an organization along with its main attributes (the founders Boris and Patrick).
This information is encoded, among billions of other entities, in a data structure called triples made of subject–predicate–object statements. What my colleagues and I have done at TNW is to create our own unique Machine Readable ID (kgmid=/m/0h7njwd) in Google’s big brain. This allows the query parser to understand what the user is asking and to fetch the right answer.
Google, to respond to this type of query, will always fetch its knowledge graph entities first and only look for an answer on the open web if they are missing. This has a clear impact on the traditional organic opportunities that are slowly shrinking. Rand Fishkin has collected and shared a good dataset if you want to dig deeper on the topic.
This is clearly a great method to boost your company visibility, but there are some important questions that pop up: first of all, where is this data coming from? And how can I influence the data in the Google Knowledge Graph?
Getting into Google’s Knowledge Graph
As described in another article I wrote on structured data, we at TNW have much like other media organizations around the world been providing precise facts in key/value pairs to Google as an alternative to the HTML-based content.

In other words, by publishing structured data we’re giving the information Google needs to provide answers rather than blue links.
As publishers we have decided that the structured data should be not only shared with search engines and social networks to run their business, but also stored and published in our own enterprise knowledge graph to help us grow our audience, to bring together structured and unstructured information and to drive the user experience across our channels.
But why do you want this?
SEO has always been about helping machines understand and index the content on our website. The idea of building a knowledge graph in a way is similar. As a SEO manager, I want to make sure we transfer our know-how on emerging technologies and startups to help machines understand and promote our work.
Having the Google Assistant aware of our conferences helps us spread this information to thousands of potential attendees in the most immediate way. AI is all about serving the needs of users with personalized information and this only becomes possible with semantically rich data.
Traditional SEO is also covering other aspects, some of these areas of work are becoming less relevant as search engines evolve, others are still crucial. Take speed, for example. If our pages don’t render in less than two seconds we’re less likely to appear on voice search.
Is it only about SEO?
As obvious it may sound from a publishers perspective, our content is the one and only thing we can measure. But how do we define or categorize a specific output? Compared to an ecommerce player, we don’t have very specific product features which we can use to break down it’s performance. So what is it?
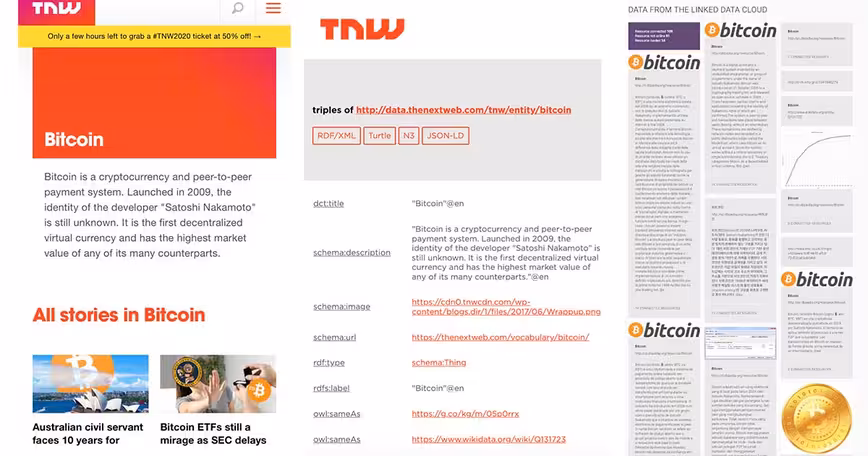
Here is where WordLift and semantic web technologies came into play (also thanks a lot to Andrea Volpini for his inputs on this article) and helped us build our knowledge graph to control and measure the performance of our content; in the graph each topic has its own unique ID and references back other large graphs like DBpedia and Wikidata.
Knowledge graphs are powerful when it comes to organizing the vast amount of unstructured information that a publisher creates on a daily basis. With a graph built using semantic standards, it is possible to relate knowledge to language in a direct way. Language provides a way to access the graph using concepts that are interlinked with public knowledge bases.
Knowledge graphs also allow us to create structures to properly categorize and tag the content that we produce. We can tell a graph that an article has as its main topic ‘blockchain’ but also talks about Ethereum. Providing such descriptive information in the form of relationships allows new information to be inferred from the graph such as the fact that both Ethereum and Bitcoin are cryptocurrencies and that cryptocurrencies use blockchain as their core technology.
Most interestingly, this information is not necessarily encoded in our knowledge graph but it can be inferred by using the links that the graph has with the same entities on other large graphs of connected knowledge, such as Wikidata.
TNW is a versatile company, but in our role as a publisher, the most important asset in our work is the content that we produce. Extracting value from content is done in many different forms but the more we can organize it the better we get at monetizing it.
When tagging is consistent, we can do the following things in the graph:
- Profile the audience by analyzing what are the trending topics for each cluster – while user behavior will remain anonymous and we respect the privacy of our users we can now retarget all users interested in a topic (without knowing them) much as Facebook or Google do.
- Improve the user experience, as in the example above we can create content hubs to let people read the latest articles on blockchain that talk about Bitcoin for example.
- Generate reports and dashboards using topics and subtopics to understand our readership and improve the content we write.
- Train machine learning models with our own data to get better at recommending relevant content.
- Help Google and other search engines understand and promote our content more effectively.
Publishers like many other digital enterprises create value when content — whether it’s data products or articles — can be identified, curated, and tied into a knowledge graph.
It can be queried and referenced for many different tasks from insights, to advertising, from SEO to monetization.
For example, the scatter plot below of eCPM vs Pageviews we got from our analytics. The aim is to show correlation between two or more variables. The only difference between a regular scatter plot and a bubble scatter plot is that here an additional value is added, which in this case is revenue. So the size of the circles is the revenue generated per each entity.

Several questions can come up when looking at it:
- Are there any potential content clusters in our archive we missed?
- Do we need to change topics we write to meet advertising clients needs?
- Is it even something we want to change? Arguing it from a traffic perspective is always easy. But it can have a huge impact on our editorial guidelines and brand.
These are now only insights we got from our own data. But what if we want to know more about one of these topics to enrich our content and monetize it better? Here the knowledge graph comes into play by querying it and looking for related topics or content cluster.

What’s next?
This is just the start of our knowledge graph and we already mentioned things we might want to analyze with it in the future to improve TNW.
I hope this article was an inspiration for you to try taking advantage of knowledge graphs at your company.
Get the TNW newsletter
Get the most important tech news in your inbox each week.