If you’re looking for the latest digital insights and social media stats, you’ll find them all in our new Digital 2021 reports series.
Published in partnership between We Are Social and Hootsuite, this year’s reports reveal that connected tech became an even more essential part of people’s lives over the past year, with social media, ecommerce, streaming content, and video games all seeing significant growth in the past 12 months.
Some of the key themes to look for in this year’s reports include:
- Changes in how people search for information and brands
- The evolving demographics of online audiences
- The rapidly growing importance of ecommerce
- Why mobile is essential, but not the only answer
- And why it’s time to change the metrics that guide marketing’s social media ‘mix’
Just before we get stuck into the numbers, I’d like to thank all of the data partners and providers who’ve made this year’s reports possible, especially:
I’d also like to draw your attention to the important notes on changes to our methodology, which you’ll find on page 6 of the report.
The Digital 2021 Global Overview Report
You’ll find our complete Digital 2021 Global Overview Report in the SlideShare embed below (click here if that’s not working for you), but read on below for my analysis of this year’s top stories.
Essential headlines
Here are the headline stats and trends for the global ‘State of Digital’ in January 2021:
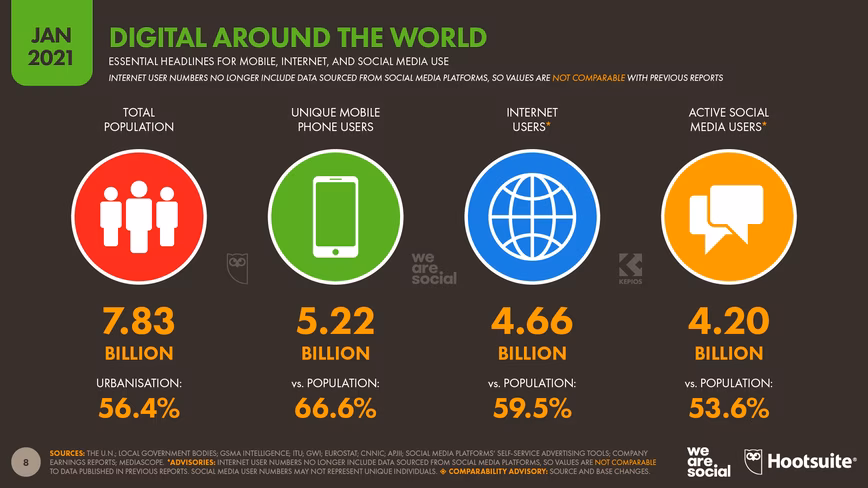
- Population: the world’s population stood at 7.83 billion at the start of 2021. The United Nations reports that this figure is currently growing by 1% per year, which means that the global total has increased by more than 80 million people since the start of 2020.
- Mobile: 5.22 billion people use a mobile phone today, equating to 66.6% of the world’s total population. Unique mobile users have grown by 1.8% (93 million) since January 2020, while the total number of mobile connections has increased by 72 million (0.9%) to reach a total of 8.02 billion at the start of 2021.
- Internet: 4.66 billion people around the world use the internet in January 2021, up by 316 million (7.3%) since this time last year. Global internet penetration now stands at 59.5%. However, COVID-19 has significantly impacted the reporting of internet user numbers, so actual figures may be higher.
- Social media: there are now 4.20 billion social media users around the world. This figure has grown by 490 million over the past 12 months, delivering year-on-year growth of more than 13%. The number of social media users is now equivalent to more than 53% of the world’s total population.
But beyond tasty trivia, what does all of this data tell us about what people are actually doing online?
You’ll find my handy summary of all this year’s top trends below, but if you’d like to dig into any of these stories in more detail – together with some other stories that aren’t included here – head over to DataReportal.com, where you’ll find our complete collection of Digital 2021 reports and analysis.
1. Social media adoption surges
Social media user numbers jumped by more than 13% over the past year, with nearly half a billion new users taking the global total to almost 4.2 billion by the start of 2021.
On average, more than 1.3 million new users joined social media every day during 2020, equating to roughly 15½ new users every single second.
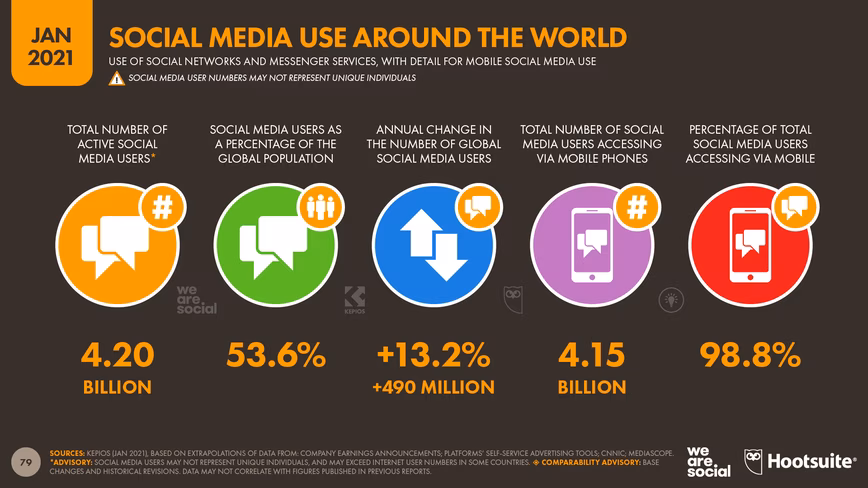
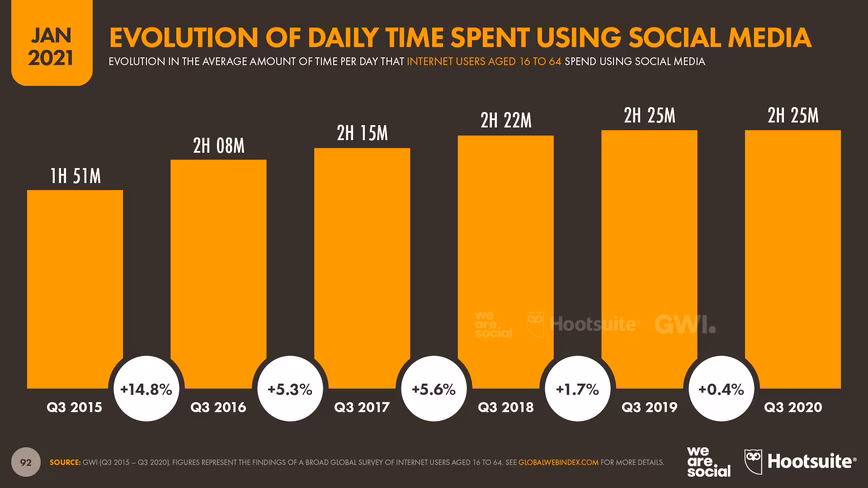
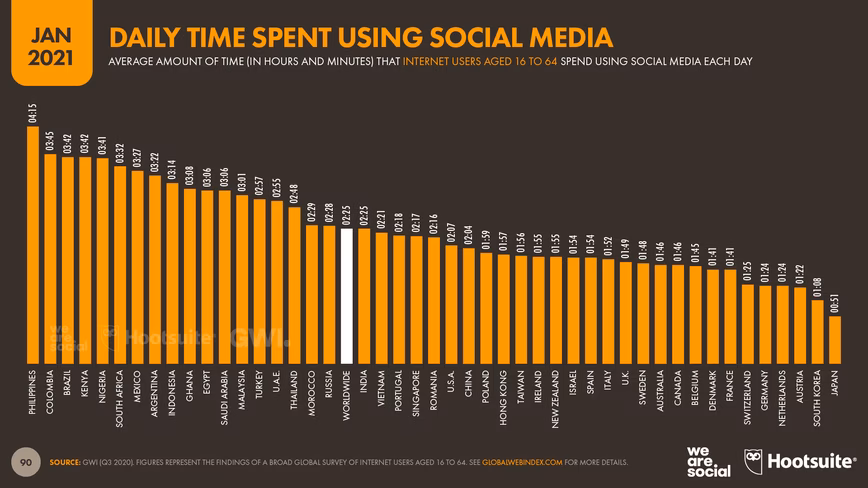
The typical social media user now spends 2 hours and 25 minutes on social media each day, equating to roughly one waking day of their life every week.
Added together, the world’s social media users will spend a total of 3.7 trillion hours on social media in 2021 – equivalent to more than 420 million years of combined human existence.
As we’ve seen in previous years though, there are significant differences between countries.
GWI reports that Filipinos are still the world’s biggest consumers of social media, spending an average of 4 hours and 15 minutes per day using social platforms – a full half an hour more than second-placed Colombians.
At the other end of the scale, users in Japan say they spend less than an hour a day on social media, but this year’s figure of 51 minutes is still 13% higher than the figure we reported for Japanese users this time last year.
2. Mobiles have become our ‘first’ screen
Data from App Annie shows that Android users around the world now spend more than 4 hours each day using their phones.
In total, that means Android users spent more than 3.5 trillion cumulative hours using their phones over the past 12 months.
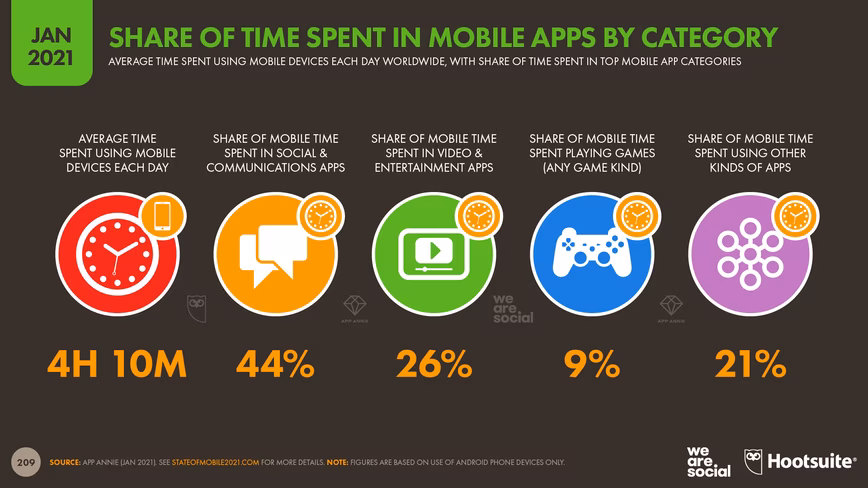
App Annie’s State of Mobile 2021 report also reveals that mobiles now account for a greater amount of people’s time than live TV.
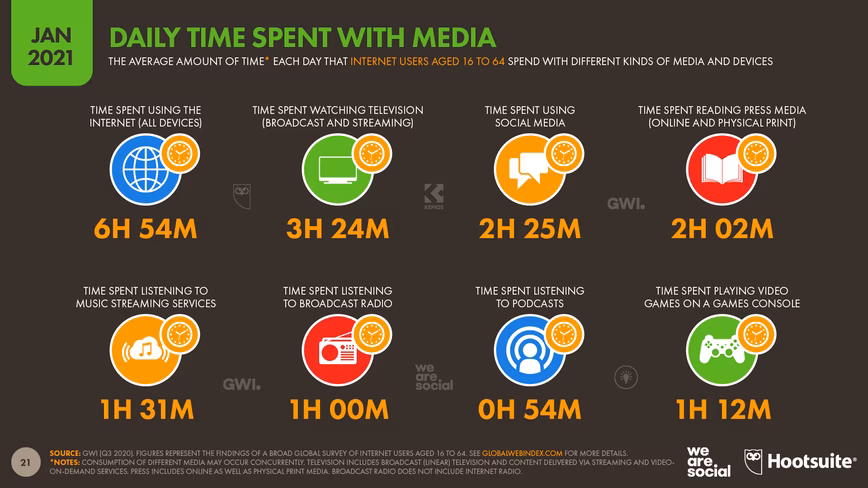
GWI’s data tells a similar story. The company’s latest research finds that the typical global internet user now spends 3 hours and 39 minutes each day using the internet on their mobile phone, compared to a total of 3 hours and 24 minutes per day watching television.
For context, that means the average internet user now spends roughly 7% longer using connected services on their phone than they do watching TV.
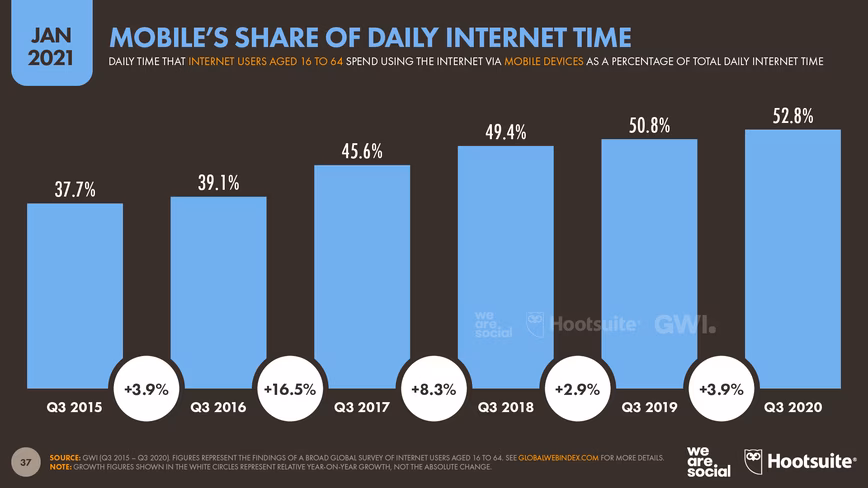
However, as we’ll see below, mobile devices still only account for about half of our daily internet time.
3. Online time jumps
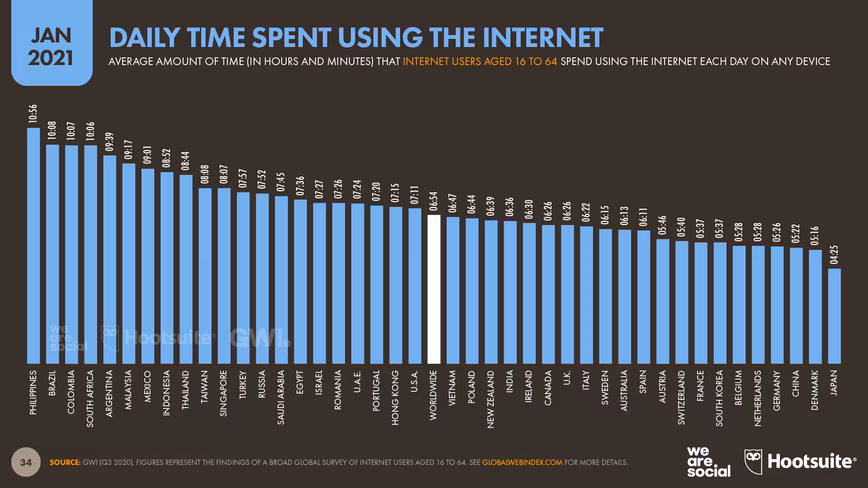
In total, the average internet user now spends almost 7 hours per day using the internet across all devices, equating to more than 48 hours per week online – that’s 2 full days out of every 7.
Assuming that the average person sleeps for between 7 and 8 hours per day, this means that we now spend roughly 42% of our waking lives online, and that we spend almost as much time using the internet as we do sleeping.
The figures also show that people are spending more time online each day than they did in previous years.
The latest findings from GWI show that the typical internet user spent 16 minutes longer online each day in Q3 2020 than they did in Q3 2019, representing a year-on-year increase of 4%.
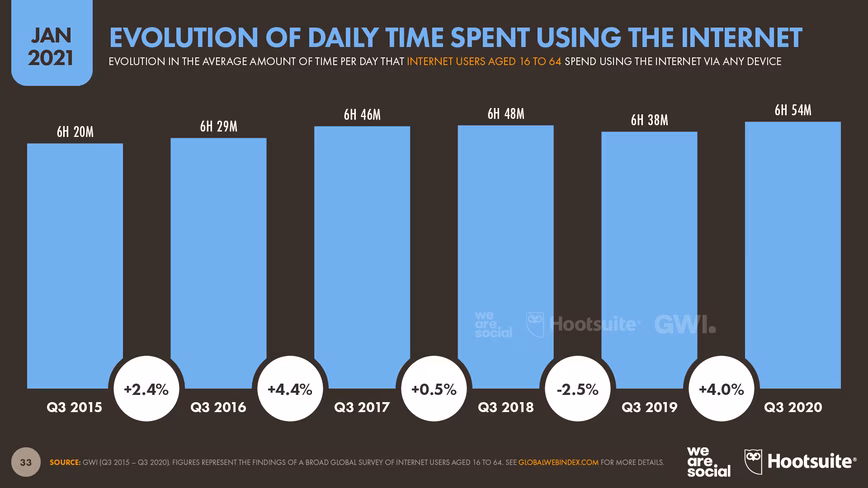
If internet use remains at these levels throughout 2021, the world’s internet users will spend almost 12 trillion hours online this year, which translates to more than 1.3 billion years of combined human time.
However, as we saw in last year’s report, there’s a significant variation in the amount of time that people in different countries spend online.
Filipinos report spending the greatest amount of time online, at an average of almost 11 hours per day.
Brazilians, Colombians, and South Africans also say they spend an average of more than 10 hours per day online.
At the other end of the scale, the Japanese report spending the least amount of time online, at less than 4½ hours per day.
Interestingly, the figure for China also falls at the lower end of the spectrum, at just 5 hours and 22 minutes per day – 1½ hours less than the global average of 6 hours and 54 minutes.
4. Online search behaviors are changing
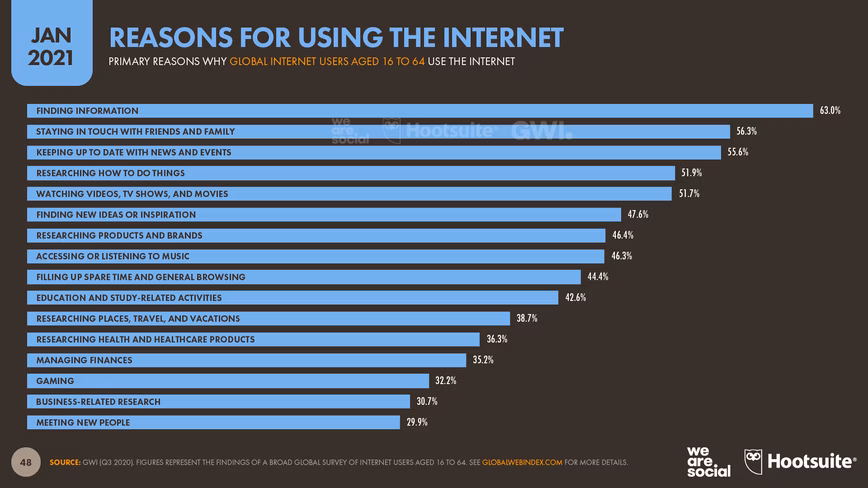
Finding information is the main reason why people go online, with almost two-thirds of the world’s internet users saying this is one of their top motivations.
However, the latest research from GWI shows that the world’s search behaviors are evolving, and this changing behavior has important consequences for anyone hoping to engage a digital audience.
Conventional search engines are still an essential part of the mix, with a massive 98% of respondents saying that they use a search engine every month.
However, more than 7 in 10 respondents also say that they now use at least one tool other than text-based search engines to find information online each month.
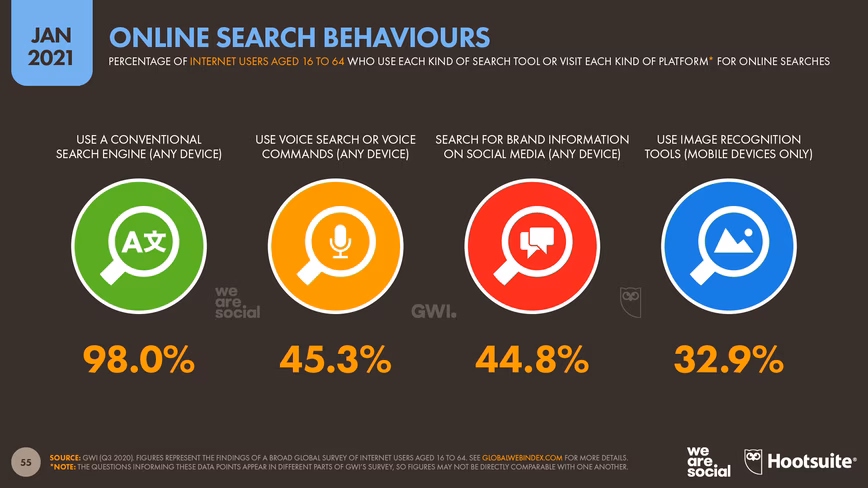
Voice interfaces are the most popular alternative, with 45% of global internet users saying that they used voice search or voice commands in the past 30 days.
Meanwhile, almost a third of the world’s internet users also use image recognition tools on their mobiles each month, with tools like Pinterest Lens and Google Lens seeing particularly strong adoption across Latin America and Southeast Asia.
But perhaps the most interesting trend in evolving search behaviors is the rise of social search.
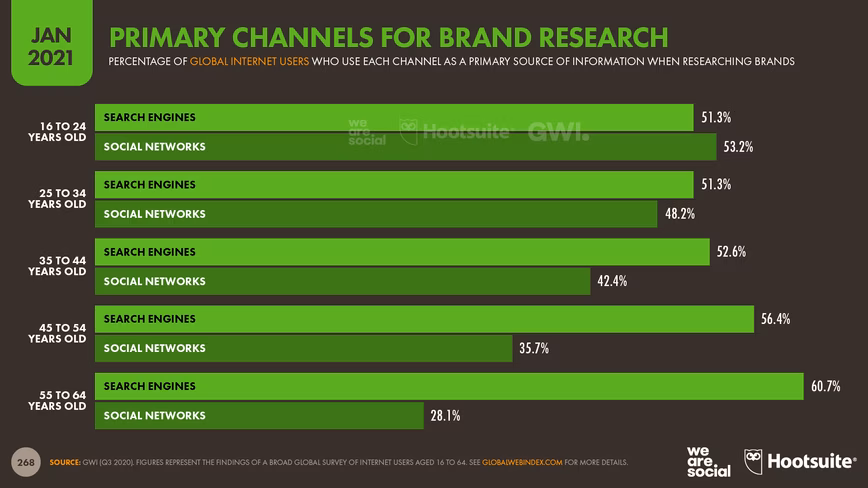
Roughly 45% of global internet users now say that they turn to social networks when looking for information about products or services that they’re thinking of buying.
However, this figure is even higher amongst younger users, with Gen Z users saying that they’re more likely to search for brands on social media than they are to look for them on search engines.
5. A multi-device strategy is still essential
Mobile phones now account for 53% of the time that the world spends online, but the data clearly shows that other devices still play important roles in our connected lives.
GWI data shows that 9 in 10 internet users go online via their smartphones, but two-thirds also say that they use a laptop or desktop computer to access the internet.
It’s worth highlighting that mobile phones are now the most widely used internet device in all countries, but the gap between mobiles and computers is often quite small, especially in Western Europe.
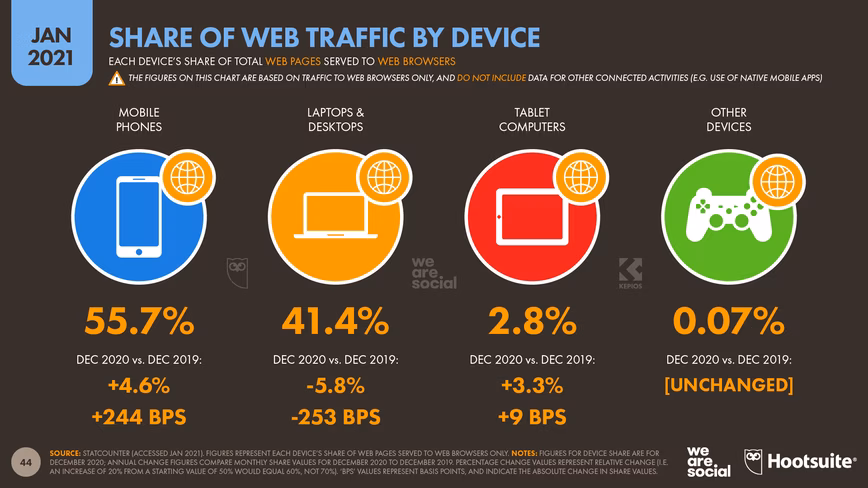
Meanwhile, the latest data from StatCounter shows that computers still account for a meaningful share of the world’s web activity.
More than 40% of web pages served in December 2020 were requested by web browsers running on laptop and desktop devices, although the overall share of these devices is down slightly compared to December 2019.
6. A more strategic approach to social media marketing
Kepios analysis of data collected by GWI shows that at least 98% of the users of any given social media platform also use at least one other social platform.
Individual social platforms are also subject to significant audience overlaps, with 85% of TikTok users aged 16 to 64 saying they use Facebook, and almost 95% of Instagram users in the same age group saying they also use YouTube.
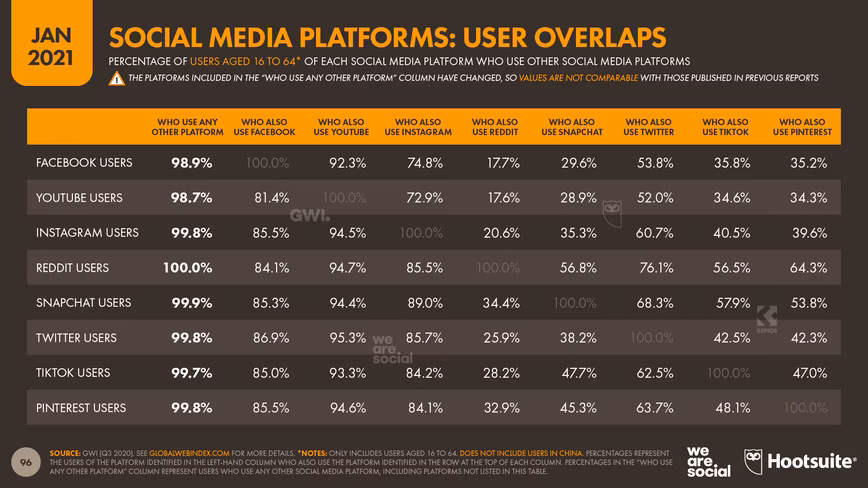
While the general concept of audience overlap may not come as a surprise, the extent of these overlaps has particular relevance to marketers.
The key takeaway is that brands do not need to be active on every single platform, and in fact, the data show that a presence on just one or two of the larger platforms offers the potential to reach almost all of the world’s social media users.
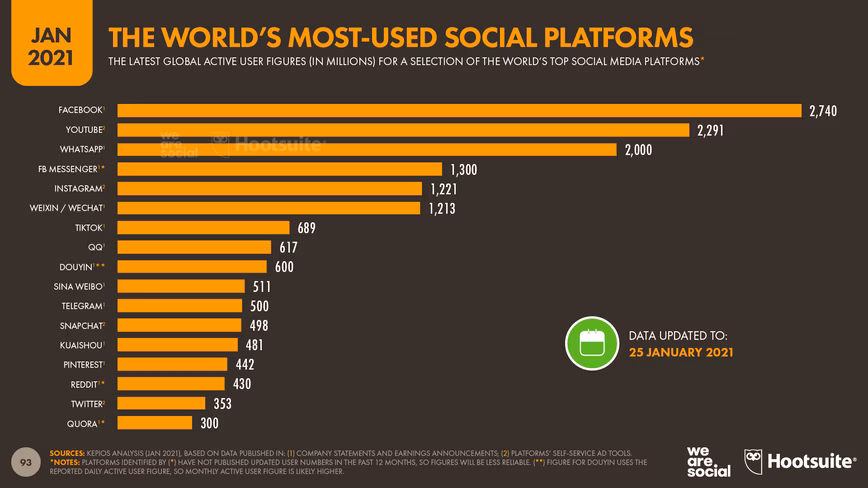
For context, at least 6 platforms now have more than 1 billion monthly active users, while at least 17 have more than 300 million.
However, this doesn’t mean that marketers should focus solely on these larger platforms.
Indeed, the data support the argument for a more strategic, portfolio-based approach to social media.
Rather than focusing all of their attention on reach, it’s time for marketers to explore other factors, such as the specific creative opportunities offered by each platform’s content formats, or the different engagement opportunities available on more ‘niche’ platforms.
So, rather than getting distracted by platform user numbers, try asking yourself:
- Who do I want to engage?
- Why might they be using social media?
- Which platform(s) will be most relevant to their motivations?
- How can I use these channels to achieve my desired outcomes?
7. Digging deeper into online audience demographics
We’ve included a wealth of new charts in this year’s reports that offer insights into connected activities by age and gender.
One of the most revealing of these charts shows how the adoption of ecommerce varies by demographic.
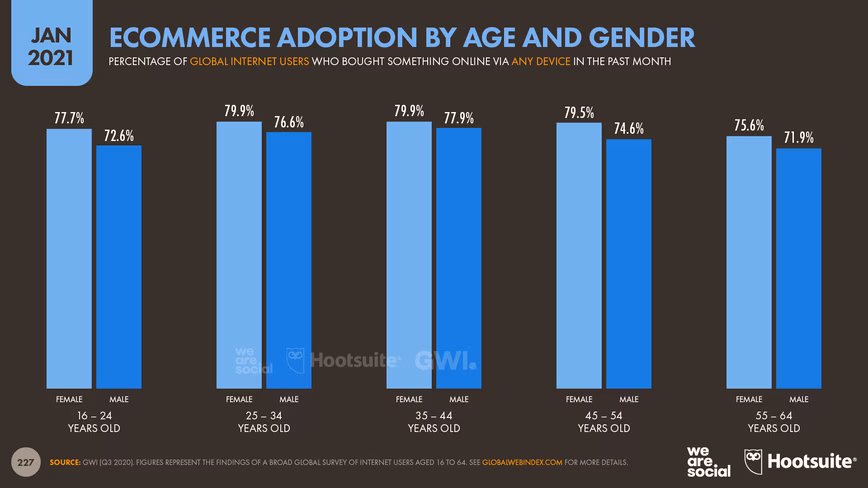
And the clear takeaway from this GWI data is that internet users in the Baby Boomer generation are only marginally less likely to use ecommerce than Gen Z and Millennial internet users.
Moreover, female internet users aged 55 to 64 are actually more likely to shop online than male internet users aged 16 to 24.
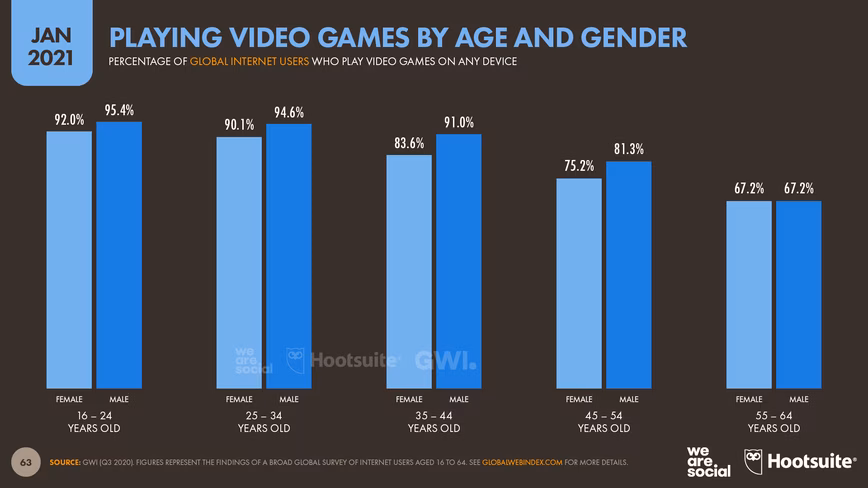
It’s also interesting to note that a significant share of older internet users play video games.
Perhaps unsurprisingly, gaming adoption rates amongst older generations aren’t as high as they are for Gen Z, where more than 90% of internet users say they play games.
However, GWI’s data still shows that more than two-thirds of internet users aged 55 to 64 around the world play video games.
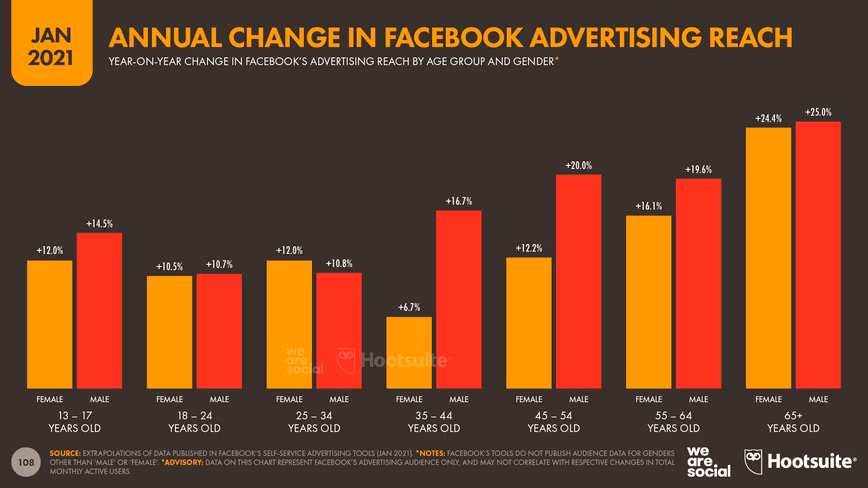
Another age-related trend is evident in the latest social media data, which shows that older age groups are the fastest-growing segments amongst some of the top platforms’ audiences.
For example, Facebook saw users over the age of 65 increase by roughly 25% over the past year – that’s almost double the overall average of 13%.
Perhaps surprisingly, users over the age of 50 also represent Snapchat’s fastest-growing demographic.
The number of users aged 50 and above that advertisers can reach on Snapchat has grown by roughly 25% in the past 3 months, with male users in this age group increasing by a third.
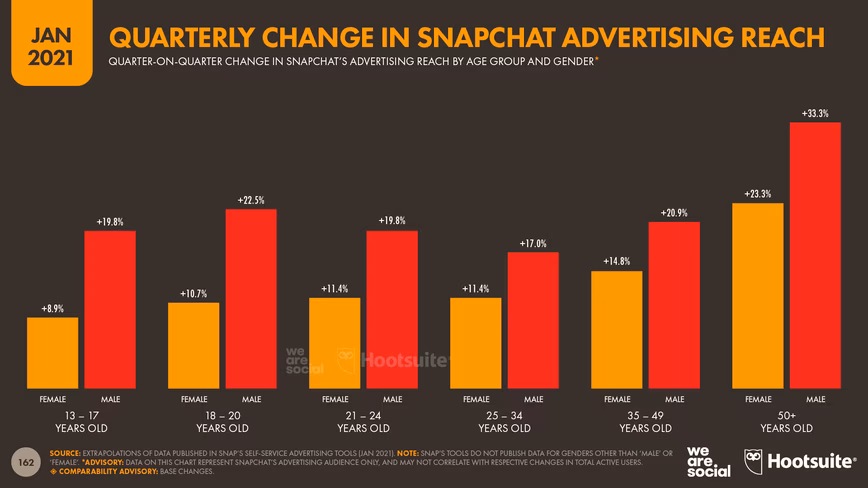
Note that these Snapchat figures represent quarterly growth, while the Facebook figures above showcase annual growth.
It’s also worth noting that these figures represent relative growth, not a share of the absolute increase in user numbers.
For context, users aged 25 to 34 still accounted for the greatest number of new Facebook users over the past year, despite already being the platform’s largest demographic segment.
However, the relative growth figures still demonstrate that a greater number of older users are joining social platforms.
These evolving demographics may bring new opportunities for marketers, together with new revenue streams for platforms and publishers.
8. Online grocery and the rise of ecommerce
One of the standout digital stories in 2020 was the rise of ecommerce, with the COVID-19 pandemic driving consumers all over the world to embrace online shopping.
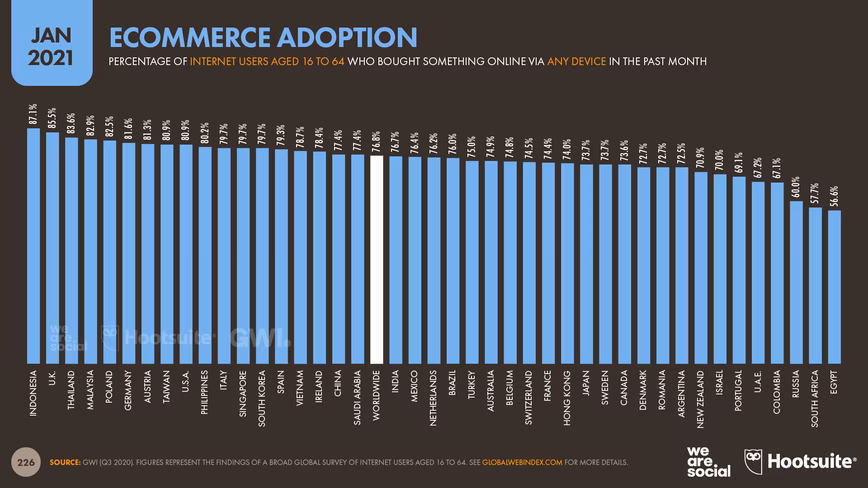
At a global level, nearly 77% of internet users aged 16 to 64 now say that they buy something online each month.
Internet users in Indonesia are the most likely to make ecommerce purchases, with more than 87% of the country’s respondents to GWI’s survey saying that they bought something online in the past month.
At the other end of the spectrum, just 57% of internet users in Egypt say that they made an online purchase in the past 30 days.
Meanwhile, what people have been buying over recent months also makes for interesting reading.
Statista reports that the Fashion & Beauty category accounted for the largest share of global B2C ecommerce revenues in 2020, at more than $665 billion USD.
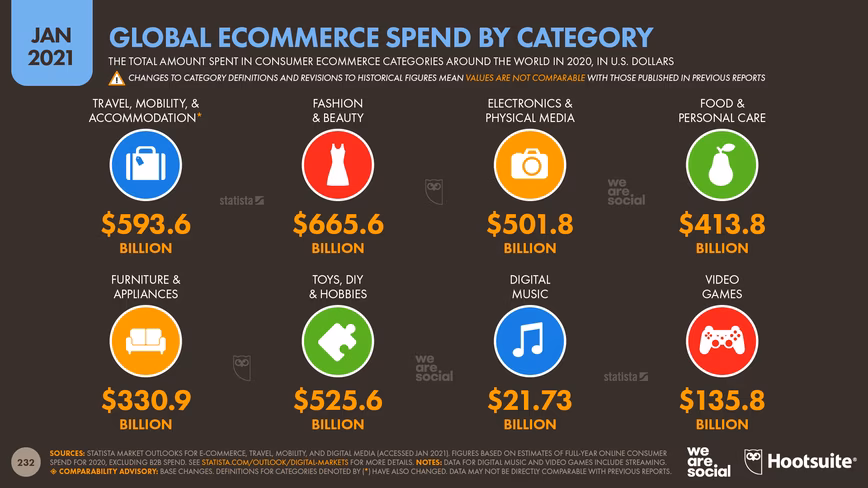
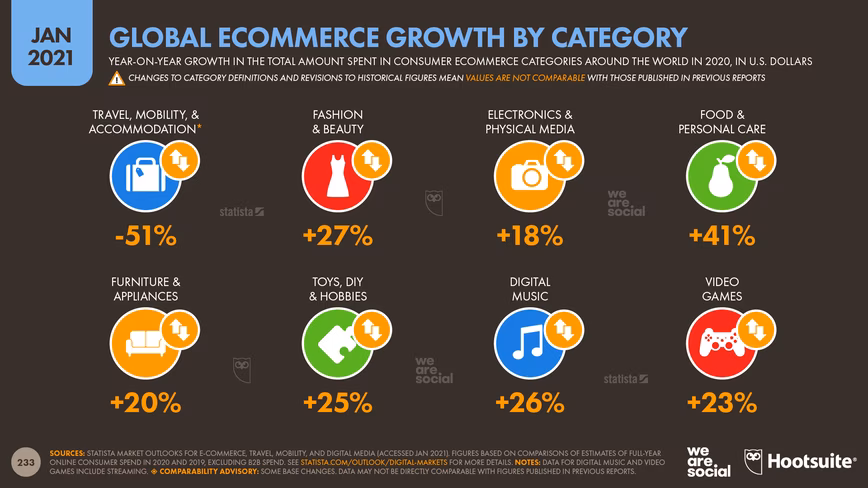
This is the first time in our ongoing series of Global Digital Reports that the Travel category hasn’t claimed the largest share of revenue, highlighting just how difficult recent months have been for travel and tourism brands.
Indeed, Statista reports that online revenues in the Travel, Mobility & Accommodation category were down by more than 50% year-on-year, resulting in a drop of well over half a trillion US dollars in annual consumer spending.
On the other hand, many other categories saw strong growth in ecommerce revenues in 2020.
Food & Personal Care was the fastest growing consumer ecommerce category in 2020, with COVID-19 lockdowns and social distancing measures acting as a catalyst for significant increases in online grocery shopping.
Worldwide, the category saw annual revenues exceed $400 billion USD in 2020, up by more than 40% compared to the previous year.
These numbers support findings that we shared in our Digital 2020 July Global Statshot Report, when many internet users said that they expected to continue with new online shopping behaviors that they’d adopted during COVID-19 lockdowns.
However, the impact of this trend should extend well beyond the Food & Personal Care category.
Grocery shopping tends to be a high-frequency activity, which means that people have had the chance to develop and embed new online shopping habits over recent months.
As most marketers know, it can be very difficult to inspire this kind of behavior change – especially in high-frequency activities – so these new habits represent an unparalleled opportunity for brands and retailers to redefine the status quo.
9. What to look out for in 2021
Hopefully, that’s given you a solid understanding of the ‘state of digital’ today.
But what does the future hold?
Based on my analysis of the data in our ongoing series of Global Digital Reports, here are some of the things that I’ll be monitoring closely over the coming months.
The demise of third-party cookies: Google’s Chrome browsers will end support for third-party cookies at the end of 2021, so we can expect significant changes in ad tech this year, especially as programmatic platforms reinvent themselves.
Flexible working: ‘working from home’ looks like it will remain an enforced part of many people’s working lives for the foreseeable future, so we should see further innovation in products and services designed to help with remote working over the coming months, especially in the areas of communication and ‘team cohesion’.
Digital disruption: connected products and services will continue to shake up existing categories and create new ones, but I’ll be watching three industries with a particular interest in 2021:
- Healthcare, especially telemedicine and connected services that help with mental wellbeing
- Finance, with insurance and cross-border payments both strong contenders for innovation
- Education, with governments and philanthropists coming together to create more effective solutions for connected schooling, while corporates focus their attention on the burgeoning opportunities of online ‘upskilling’
The big tech breakup: this has been a long time coming, but lawmakers around the world are signaling that 2021 may be the year of the big showdown. However, the big question is whether Google, Facebook, Amazon, or Alibaba will beat them to it, spinning off component parts on their own terms before governments force them to do so.
Portable digital identities: with privacy once again in the spotlight following the recent updates to WhatsApp’s terms and conditions, a ‘decentralized’ approach to digital sign-on may come to the fore. Inrupt is definitely one to watch, but it’s certainly not the only contender.
Are there any other trends that you’ll be watching in 2021? Send me your tips on Twitter.
10. And finally…
We couldn’t finish this year’s analysis without an update to our Pulitzer-worthy coverage of one of the internet’s most hotly contested battles.
Despite raising the alarm this time last year, it appears that many people still haven’t received the memo about the internet being invented for sharing pictures of kittens.
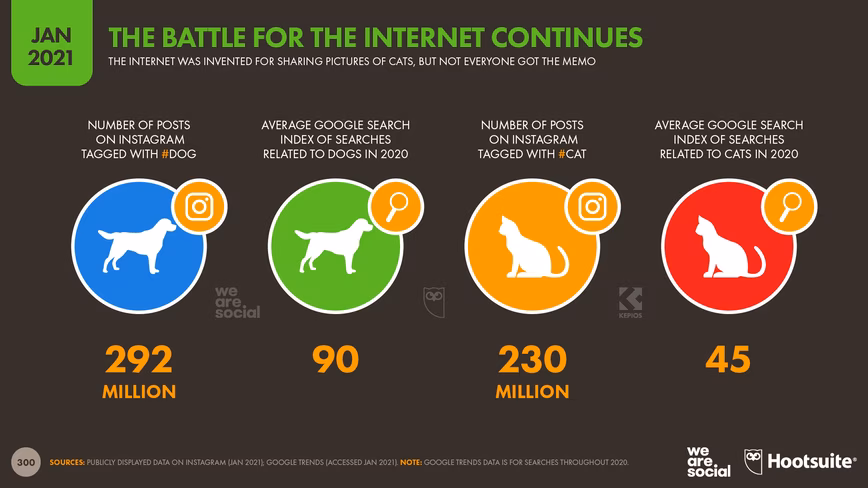
#TeamDog managed to publish an additional 44 million #dog posts to Instagram in the past 12 months, while #TeamCat only managed 33 million new #cat posts.
It’s a similar story over on Twitter, where the platform’s advertising tools reveal that 307 million users are ‘interested’ in dogs today, compared to just 23 million who are ‘interested’ in cats.
That’s a marked improvement on last year’s thousand-to-one ratio (250 million vs. 250 thousand), but dog lovers still outnumber cat lovers on Twitter by a factor of 13 to 1.
We’ll be keeping tabs tabbies on this story again this year, so look out for future pupdates.
All of this pun-ditry’s probably taken up enough of your 6 hours and 54 minutes for today though, so I’ll paws this year’s analysis there.
I’ll be back in a couple of weeks with the first of our Digital 2021 local country reports.
Until then, if you need any more stats, check out our complete (free!) library of Global Digital Reports.
Did you know TNW is organizing Boost, an online event for Digital Marketing, in April? Partner with TNW to engage decision-makers, build brand awareness, and generate leads that have budget.
Get the TNW newsletter
Get the most important tech news in your inbox each week.