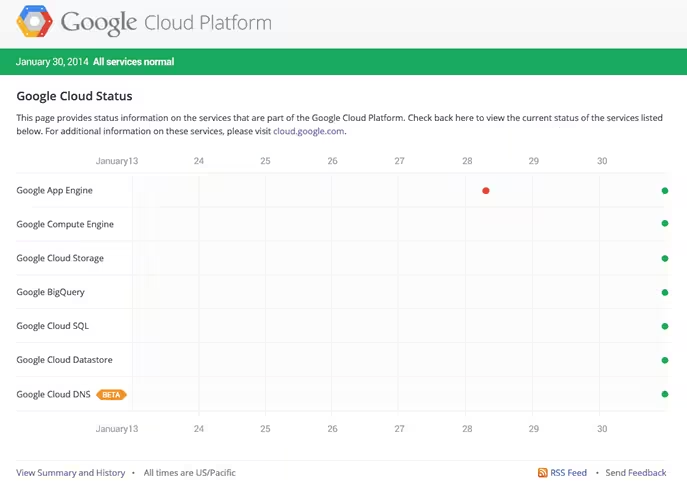
If you’re a developer using Google’s Cloud Platform, the company is introducing a new tool you’ll likely find handy. You can now view a Web dashboard to check status updated on Cloud Platform services.
Current service status is shown with a column of green indicators on the right side of the dashboard’s graph. Whenever a service disruption occurs, a red bar appears and persists until the issue is fixed.
The dashboard shows service status over the last seven days by default, but you can see more information on the last 90 days by clicking on “View Summary and History.”
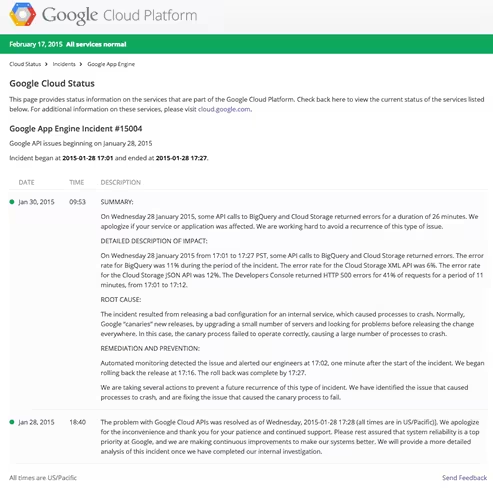
If you want more specific details on an incident, you can just click on it to see a description including a summary of the problem, its impact, causes and prevention.
You can also sign up to a service status RSS feed by clicking on the link at the bottom of the dashboard page. Developers already using Google’s Cloud Monitoring events log will also see this information integrated.
➤ Introducing Google Cloud Platform Status Dashboard [Google Cloud Platform]
Get the TNW newsletter
Get the most important tech news in your inbox each week.