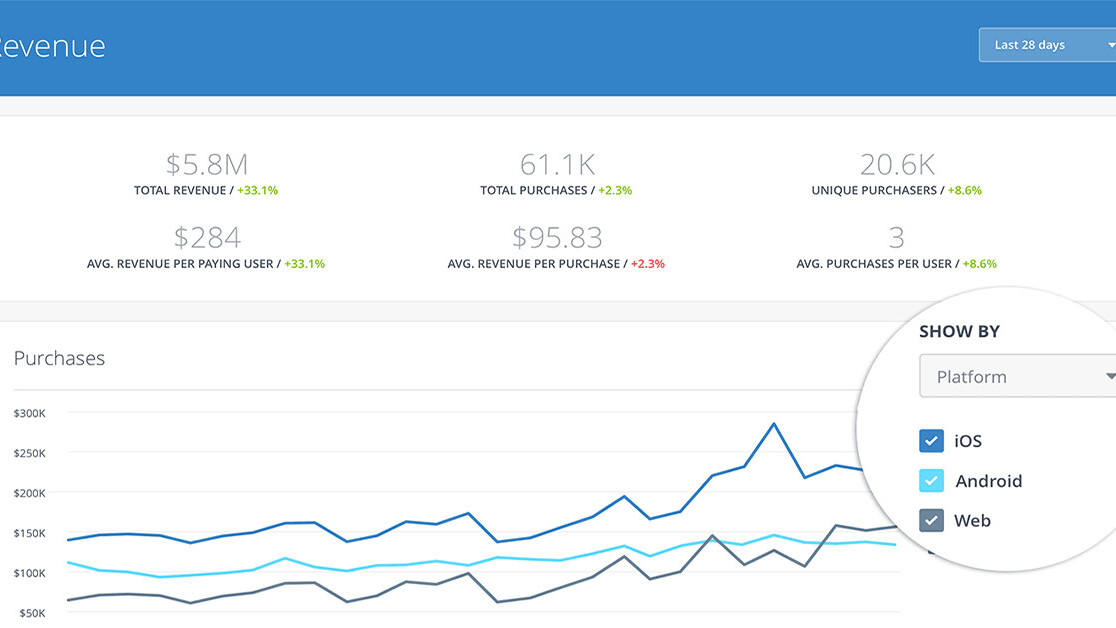
Facebook announced its free Analytics for Apps tool last year as a way to help developers grow the customer base, and now the company is adding several new features for deeper insights.
The biggest change is that Analytics for Apps can now track cross platform metrics all in one dashboard. To be clear, the app could previously track metrics for apps on various platforms – including iOS, Android, Windows and more – but now you can view information for all of them in one place.
According to the company, about 53 percent of people with 2 devices switch between them to complete activities; 77 percent of people with 3 or more do the same. Basically, most people now use the same app on various devices, and being able to keep track of how users are switching between devices is a valuable metric.
There are a couple of more updates. For one, a tool simply called ‘user properties‘ lets you integrate online and offline data from your customers for better measuring user acquisition lifecycles.
Perhaps a bit more interestingly, there’s an update to your sharing insights which now offers a ‘virality’ metric for how often a link from your website is shared on Facebook. The company’s own description:
This allows you to see when your content is becoming popular on Facebook based on all articles published in the last 10 hours and which URLs have been shared the most in the last 5 hours. You can use this data to create strategies that make your website content even more popular or create similar content in the future.
Additionally, you can now create a Custom Audience from people who have shared specific content from your website on Facebook. Just click the Create Custom Audience button in sharing insights to get started.

Facebook says Analytics for Apps has been used by ‘over 800,000 unique apps, so it’s proved pretty popular so far. The new features are rolling out to everyone today.
Get the TNW newsletter
Get the most important tech news in your inbox each week.


