
Can we quantify different features of music? Apparently yes; folks at Spotify have identified and measured songs’ features like danceability, accoustiness, valence, energy, pitchiness, and more. In this humble study I’ll use Spotify data to analyze the greatest Christmas songs of all time and find out how the musical features are connected, in addition to finding the most positive and danceable Christmas songs for the party!
Now, you might ask yourself ‘why not just pick the songs you like the most?’ Not a chance, I believe in data and I’ll prove to you which songs you should like. So let’s get ready for some zestful musical insights!
The dataset
Since I don’t have the skills to select top 100 Christmas songs of all time, I’ll leave it to the experts, i.e., Topsify (part of Warner Music Group) to narrow our subject. This is primarily a song curation tool that can be used with Spotify to access various playlists. Some of the examples are ‘UK top 40’, ‘House music 2018’, ‘Morning coffee acoustic’, and ‘100 greatest Christmas songs ever’. Yes, that’s the playlist with which I’ll work.
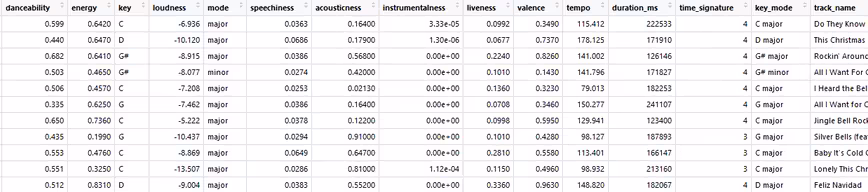
I used the amazing spotifyr package for R to grab all the details of the songs in the playlist. It requires access to Spotify API which can be obtained via official developer platform. Here is a snapshot of the customized dataset which shows the important data fields:
Goals
I’ll begin with the top artists who have the most number of songs in the top 100 list and move to relationship between the musical features. Precisely here is what we’re going to understand in this meticulous yet Christmasy article:
- Top artists with greatest Christmas songs
- Distribution of the duration of songs
- Frequently used keys
- Top 10 most danceable songs
- Top 10 most positive songs
- Correlation of the musical features
- Distribution of the related features
- Key and tempo combination required to create positive music
Sounds fun, right? Go grab a hot chocolate and let’s get started.
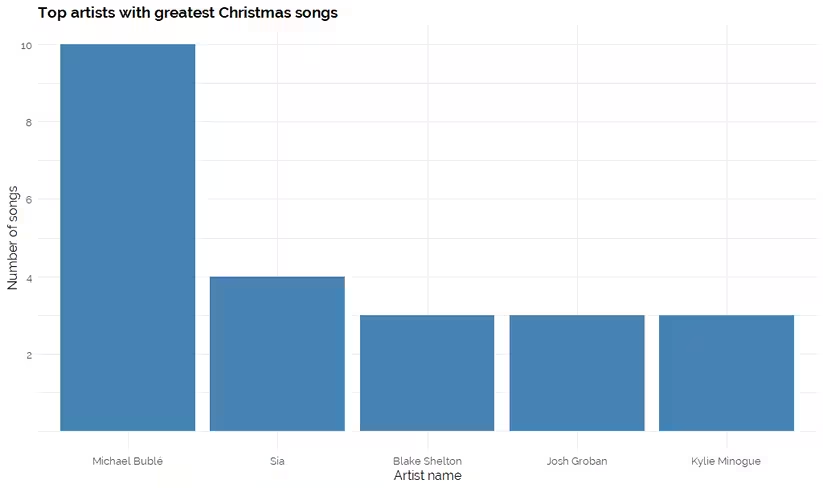
Top artists with most number of hits
Canadian singer, Michael Bublé tops the list with 10 songs in the top 100 and Sia (my favourite artist) comes second with 4 songs. Some of the notables tracks by Michael are ‘All I Want For Christmas Is You’, ‘It’s Beginning To Look A Lot Like Christmas’, ‘Cold December Night’.
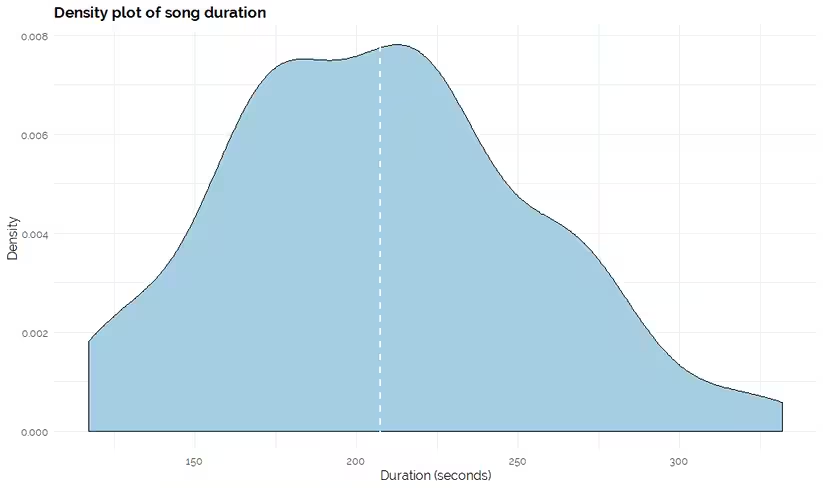
Distribution of song duration
This plot shows that majority of the songs’ duration fall in the range of 175 seconds to 212 seconds. Also, note that the average length of all the songs comes close to 207 seconds. Riveting.
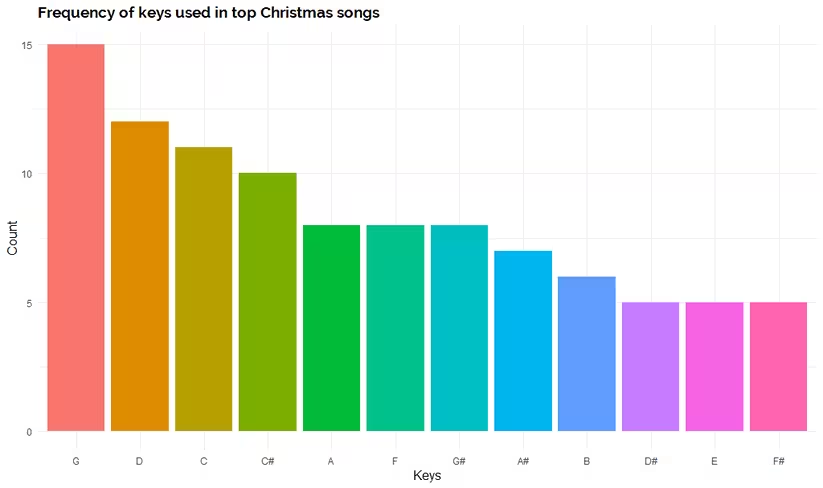
Frequently used keys
So, which are the frequently keys used in these Christmas hits? The plot given below shows that G, D, and C are top three ones while D#, E, and F# are least used. Probably this will help the musicians looking to produce next popular Christmas song in terms of key selection.
Most danceable songs
Since Spotify API has given us the data on danceability of the songs, I’ll use that to create a bar plot of the top 10 most danceable songs in ‘<track name> – <artist name>’ format — just in time for your office Christmas party.
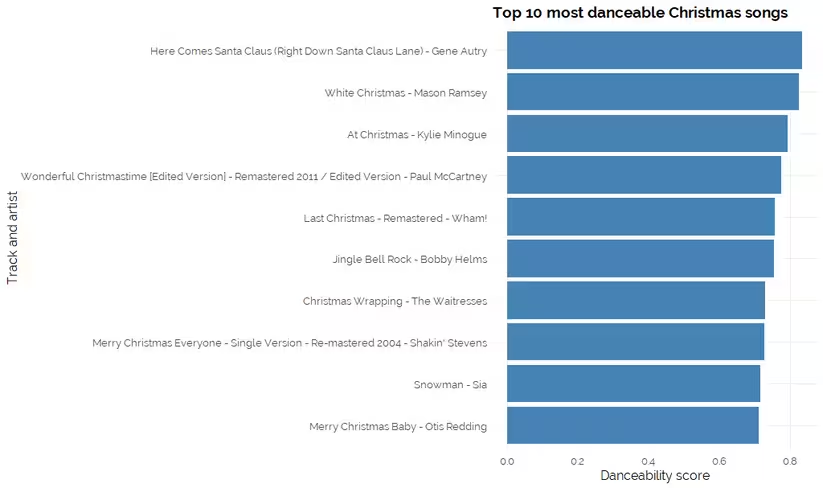 This shows that artist Gene Autry’s song, “Here Comes Santa Claus” (1947) is the most danceable song. No wonder so many artists have been covering this song for decades. So if you want a crazy dance party, the answer has been right in front of you since 1947.
Most positive songs
There is a feature called ‘valence’ in the data set which essentially conveys ‘positiveness’ of songs. Here‘s the explanation directly from the horse’s mouth — “tracks with high valence sound more positive (e.g. happy, cheerful, euphoric), while tracks with low valence sound more negative (e.g. sad, depressed, angry).”
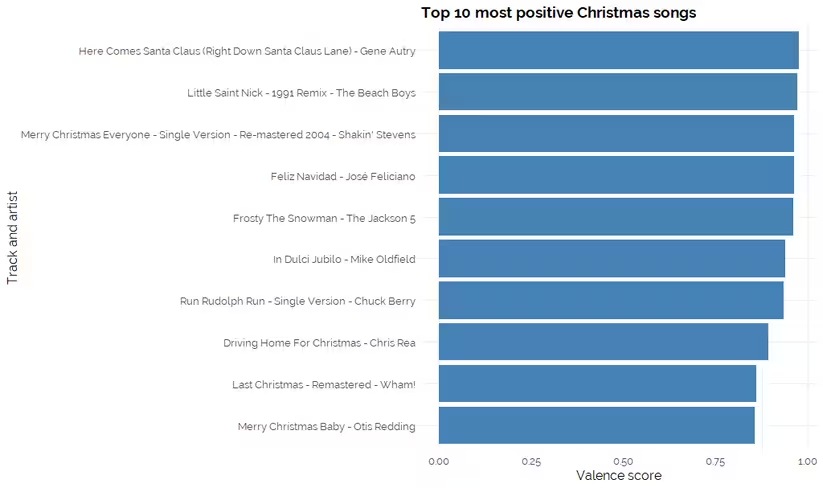 Again the most danceable song is also the most positive song. Number 2 and 3 spots have been taken up by “Little Saint Nick” and “Merry Christmas Everyone” which are older classics (guess music was better back in the day). Apart from the tracks at number 1 and 3 spot, we can see “Merry Christmas Baby” and “Last Christmas” are also common in the to 10 most danceable and most positive list.
So, is there a statistically significant relationship between these features? Let’s answer that in next visualization!
Correlation of the musical features
Simply put, correlation test is a statistical technique used to find out if pairs of variables are related apart from the strength and direction of their relationship. For instance, in India, during Diwali firecracker usage lead to higher hospitalization rate because of burn injuries. For correlation between the musical features, I’ll create a colour-coded correlation matrix using ‘ggcorrplot’ package.
 Correlation in this matrix is based on the p-value which shows positive correlation in peach color and negative in bluish color. Statistically insignificant correlation between variables have been crossed out.
Now we can infer the following:
- There is strong positive correlation between ‘loudness’ and ‘energy’.
- ‘Valence’ has strong positive correlation with ‘energy’ and ‘danceability’
- ‘Acousticness’ has negative relationship with ‘energy’ and ‘loudness’.
Important point: correlation doesn’t always mean causation.
Distribution of the valence, energy, and danceability
Now that we know there is positive correlation between these three features, let’s visualize the distribution of their values over the 100 tracks.
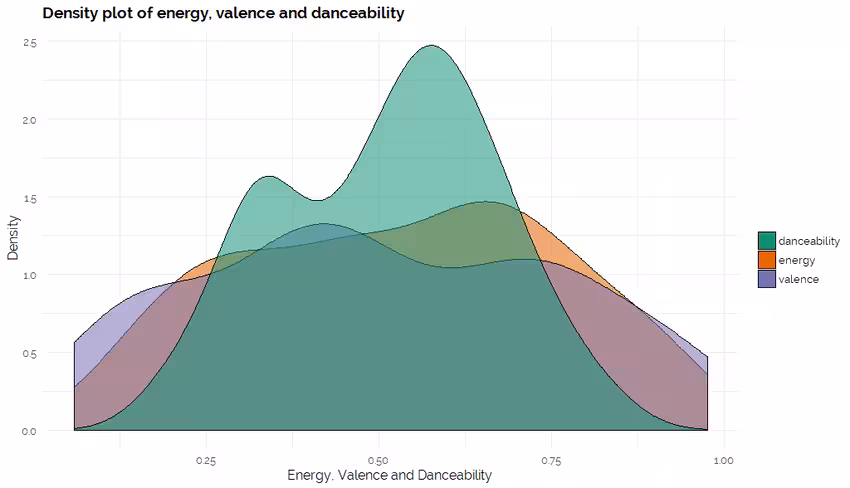 As expected, these features have similarity in terms of distribution. However, what causes higher ‘valence’? In other words, what attributes to positiveness in music?
Key and tempo for positiveness in music
The original data set contains key and mode data which we have already visualized in this article. Another, important variable is ‘’tempo,” which is the speed of the musical piece. Although the original data was numeric (beats per minute), I converted that to categories such as Adagio (66–76 bpm), Andante (76–108 bpm), Vivace (156–176 bpm).
Now I’ll use a heatmap to visualize how key and tempo combination increase positiveness of a song.
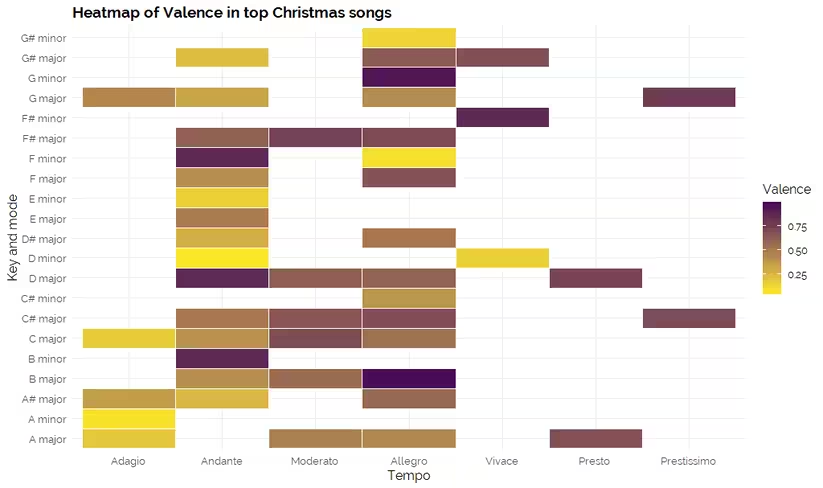 This shows that ‘Allegro’ tempo (120–156 bpm) with the key and mode combination of ‘B major’ and ‘G minor’ are the ones that lead to higher ‘valence’. Apart from these, ‘Andante’ tempo with ‘B minor’, ‘D major’, ‘F minor’ and ‘Vivace’ tempo with ‘F# minor’ result in higher ‘valence’.
Conclusion
We’ve arrived at the end note of our musical data journey — I hope this has given some interesting insights for this year’s Christmas playlist.
We found out that the average song length of the top 100 tracks is around 3.5 minutes with ‘G’ being the most frequently used key. We also uncovered the positive songs along with the correlation of musical features. The last visualization showed that ‘Allegro’ and ‘Andante’ tempo feature in the songs with higher positive score (are musicians paying attention?).
I hope that this insightful and beautifully detailed data analysis has gotten you into the Christmas spirit — I for one will not be a Grinch this year!
Get the TNW newsletter
Get the most important tech news in your inbox each week.