Analytics tool ChartMogul has overhauled its website, bringing in a fresh interface and some new tools that will bring better insight on customer behavior.
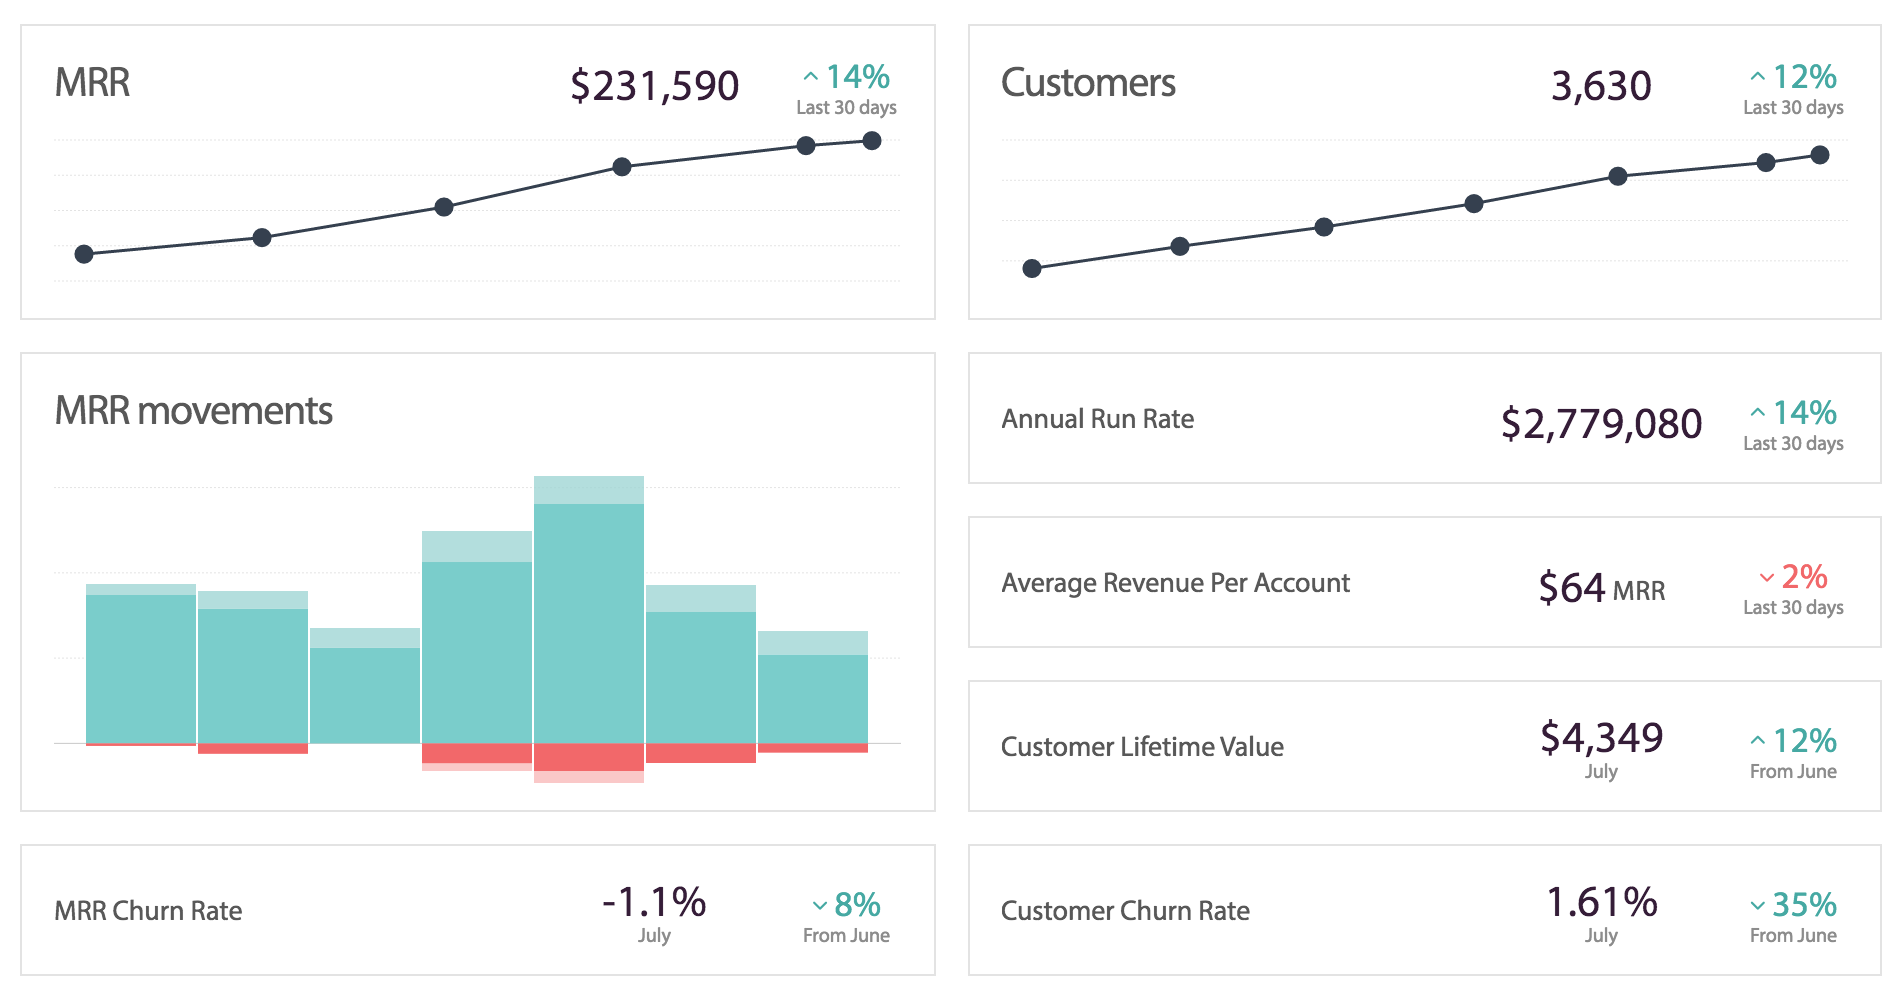
The interface has been completely overhauled, which is nice for aesthetics, but also serves its new custom dashboard feature. Rather than get a static set of insights, a business can now choose which analytics features they would like to know about.
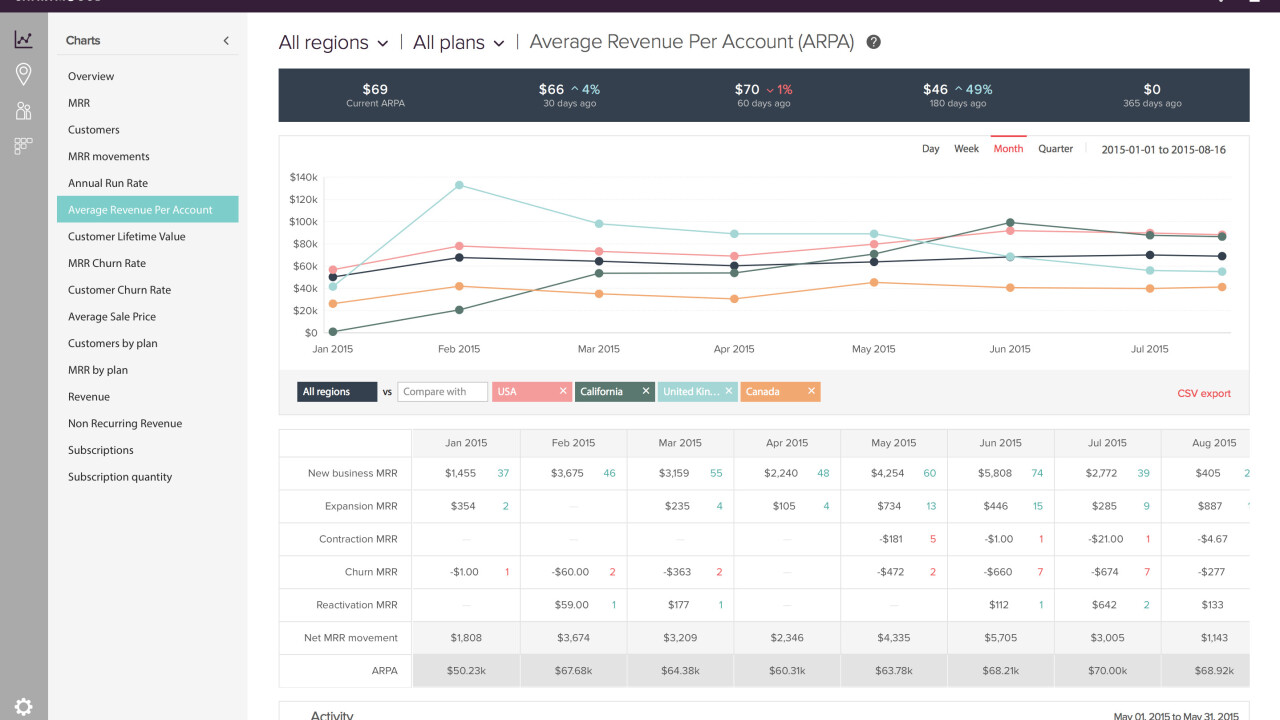
An advanced cohort analysis feature gives insight on churn and retention, as well as spending habits of customers. It’s a good way to see a timeline of spending and retention numbers for SaaS providers, and the Monthly Recurring Revenue (MRR) table shows exactly where the money is coming from.
To make the service easy to use, all you have to do is link ChartMogul to Stripe, Braintree, Recurly or Chargify. You can link multiple sources, too.
If you’d prefer to look at your metrics via a different service, that’s also available. There’s an API, Slack integration via an IFTTT recipe or Zendesk integrations to take advantage of.
Read next: Harpoon will help freelancers spear invoicing and time tracking in one handy service
Get the TNW newsletter
Get the most important tech news in your inbox each week.