Our new Digital 2020 reports – published in partnership with We Are Social and Hootsuite – show that digital, mobile, and social media have become an indispensable part of everyday life for people all over the world.
More than 4.5 billion people now use the internet, while social media users have passed the 3.8 billion mark. Nearly 60 percent of the world’s population is already online, and the latest trends suggest that more than half of the world’s total population will use social media by the middle of this year.
Some important challenges remain, however, and there’s still work to do to ensure that everyone around the world has fair and equal access to life-changing digital connectivity.
You’ll find the full Digital 2020 Global Overview Report in the SlideShare embed below, but read on to find our summary of this year’s key headlines, numbers, and trends.
Just before I dig into our analysis, I’d like to say a huge thank you to our data partners, without whom many of the best slides in this year’s reports wouldn’t be possible:
Please also note that some of the underlying sources and reporting methodologies for some of our core data points have changed since last year, so various numbers in our Digital 2020 collection will not be comparable to similar data points in previous reports. See individual report slides for more details.
Digital in 2020: the essential headline numbers
Digital’s role in our lives has reached new heights, with more people spending more time doing more things online than ever before:
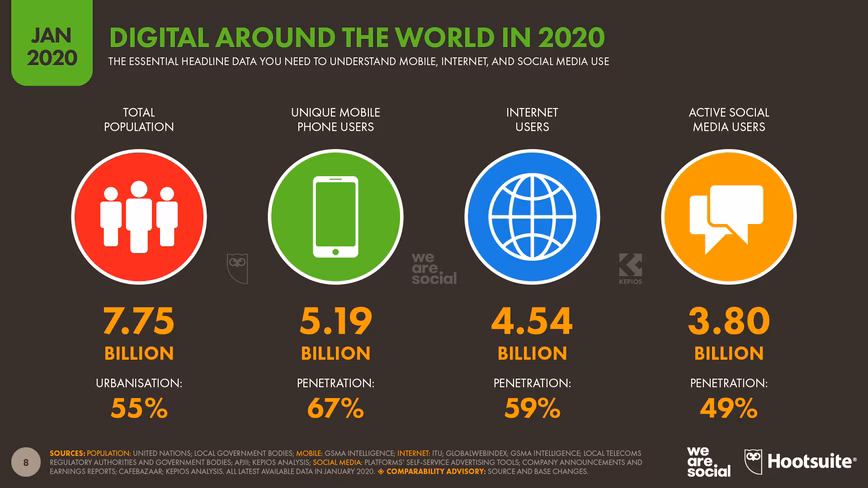
- The number of people around the world using the internet has grown to 4.54 billion, an increase of 7 percent (298 million new users) compared to January 2019.
- Worldwide, there are 3.80 billion social media users in January 2020, with this number increasing by more than 9 percent (321 million new users) since this time last year.
- Globally, more than 5.19 billion people now use mobile phones, with user numbers up by 124 million (2.4 percent) over the past year.
You’ll probably spend more than 100 days online this year
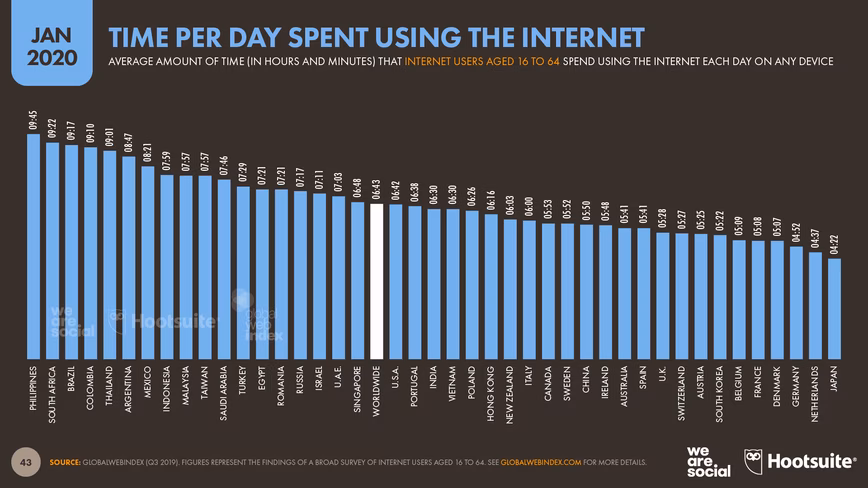
The average internet user now spends 6 hours and 43 minutes online each day. That’s 3 minutes less than this time last year, but still equates to more than 100 days of connected time per internet user, per year. If we allow roughly 8 hours a day for sleep, that means we currently spend more than 40 percent of our waking lives using the internet.
What’s more, the world’s internet users will spend a cumulative 1.25 billion years online in 2020, with more than one-third of that time spent using social media. However, the amount of time that people spend online varies from country to country, with internet users in the Philippines spending an average of 9 hours and 45 minutes per day online, compared to just 4 hours and 22 minutes per day in Japan.
Getting to full access: connecting the unconnected
More than 2 billion people have come online since the first mention of ‘The Next Billion’, but just over 40 percent of the world’s total population – roughly 3.2 billion people – remains unconnected to the internet.
More than 1 billion of these ‘unconnected’ people live in Southern Asia (31 percent of the total). Countries in Africa account for 27 percent of the total, with 870 million people yet to come online across the continent as a whole.
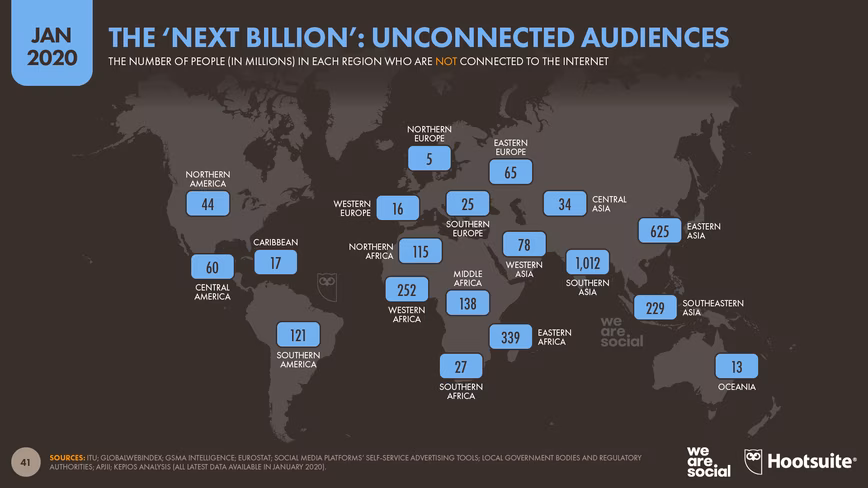 Age plays a significant role in determining levels of internet access across these regions: more than half of Africa’s total population is below the age of 20, and there are more than 460 million people below the age of 13 across Southern Asia.
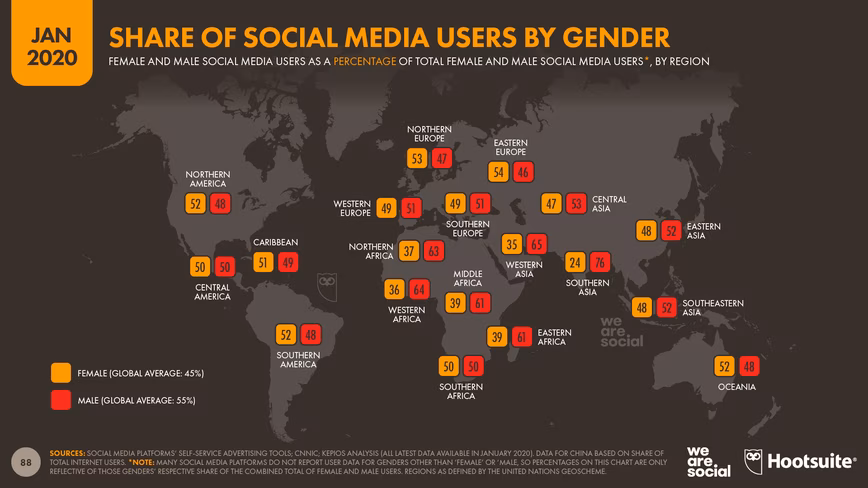
However, gender is also a critical factor, with data from the ITU showing that women are more likely to be ‘unconnected’ compared to men. The digital gender gap is also apparent in our latest social media data. In particular, women in Southern Asia are three times less likely to use social media today compared to men, offering meaningful insight into broader internet connectivity in the region.
 Even more worryingly, research from GSMA Intelligence suggests that more than half of all women living in India today are unaware of the existence of mobile internet.
The United Nations reports that much of this imbalance stems from “deeply ingrained social norms and practices.” Regardless of the cause, however, connecting the unconnected will depend heavily on improving digital accessibility for women, especially in developing economies.
There’s lots of work to do here, and it’s work that brands can help with. If you’d like to learn more about this important topic, GSMA Intelligence’s comprehensive Mobile Gender Gap Report explores many of the underlying issues and challenges in detail, while their excellent Mobile Connectivity Index offers richer perspectives at a local country level.
Mobile now accounts for half of internet use
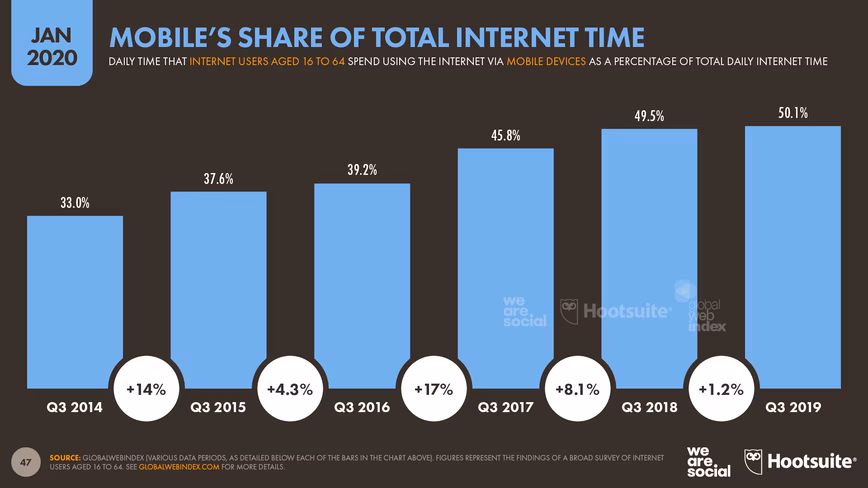
GlobalWebIndex finds that mobile phones now account for more than half of all the time we spend online, with the company’s data putting mobile’s share of internet time at 50.1 percent.
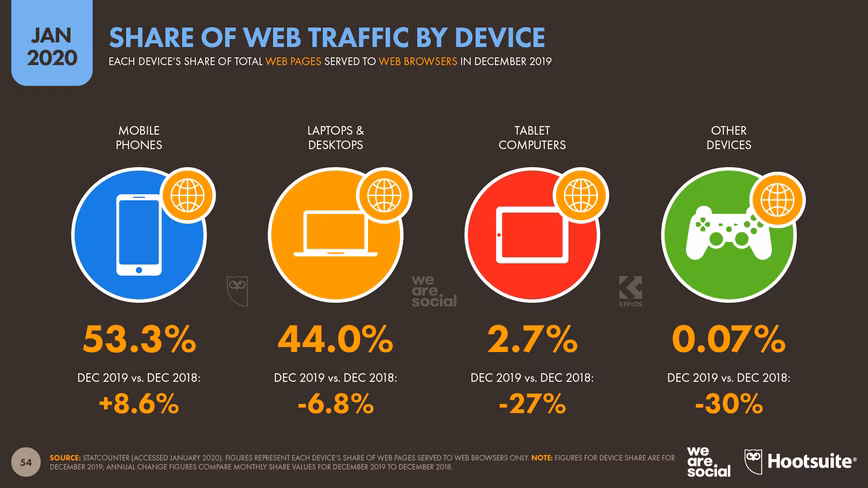
 With 92 percent of the world’s internet users now connecting via mobile devices, this figure may be lower than some might expect, but various data points confirm that computers continue to play an important role in our connected lives.
Despite mobile’s ubiquity, three-quarters of internet users aged 16 to 64 still go online via laptop and desktop computers. Furthermore, data from Statcounter reveal that roughly 53 percent of all web page requests now come from mobile phones, but that computers still account for 44 percent of the total.
 All of this data points to the fact that most people still use a variety of different devices to go online. As a result, a balanced device strategy is still essential. Moreover, people use different devices at different times and for different needs, so marketers must go beyond technical considerations to understand the various use cases and contexts for each device when building their plans.
Apps are where it’s at
Data shared with us by App Annie reveal that mobile apps now account for 10 out of every 11 minutes we spend using mobile devices, with web browsing only responsible for 9 percent of our mobile time.
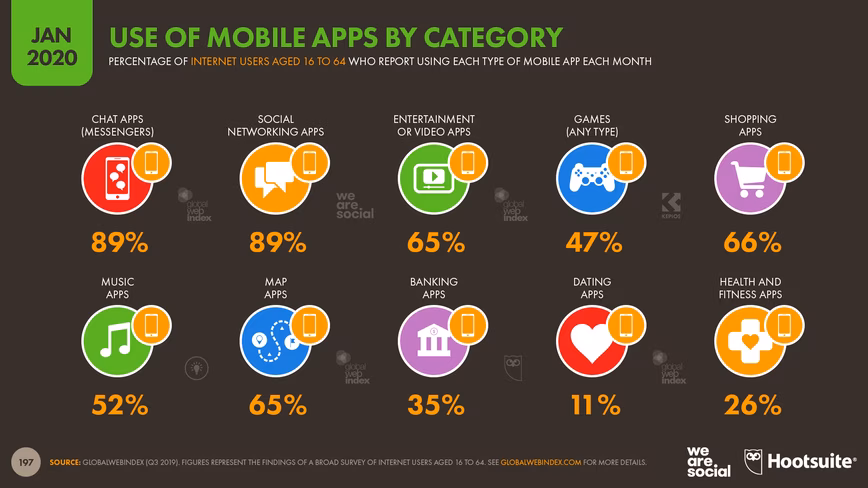
However, when we consider the extent of app offerings available to today’s mobile users, this is perhaps unsurprising. Data from GlobalWebIndex show that we’re using apps in almost every aspect of our lives, whether it’s staying in touch with family and friends, relaxing on the couch, managing our finances, getting fit, or even finding love.
It’s worth noting that helping people find love is big business too. Tinder generated more revenue than any other non-game app in 2019, while the world’s lonely hearts spent a total of US$2.2 billion on all dating apps during the course of 2019 – twice as much as they spent in the same category two years ago.
 Our love affair with apps shows little sign of slowing either, despite the rise of ‘progressive web apps’. App Annie reports that the world’s smartphone users downloaded more than 200 billion mobile apps in 2019, spending a total US$120 billion on apps and app-related purchases over the past 12 months. Combined with recent data from Ericsson, these figures suggest that the average user now spends an annual average of more than US$21 per connected smartphone.
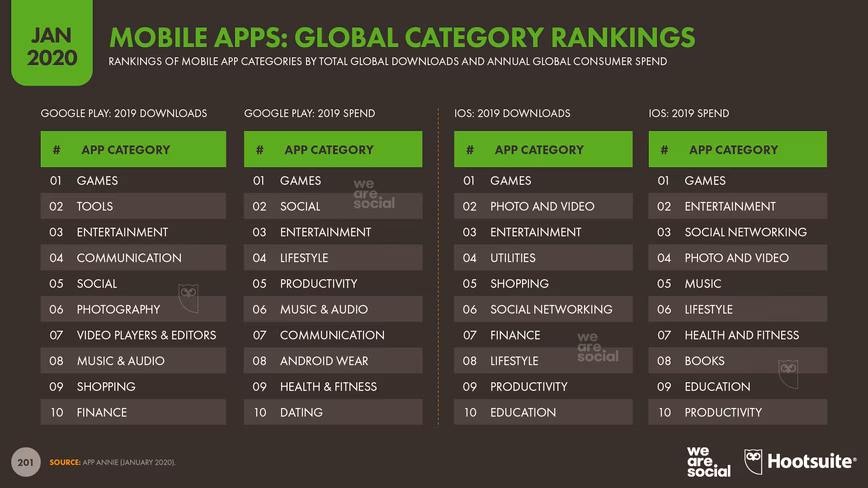
App Annie’s new State of Mobile 2020 report also reveals that games account for the greatest share of mobile app downloads – more than 1 in 5 of the total – and drive 70 percent of worldwide consumer spend on mobile apps. However, games are not the biggest category when it comes to the share of total time spent using mobiles, as we’ll explore in the next section.
We really are social animals
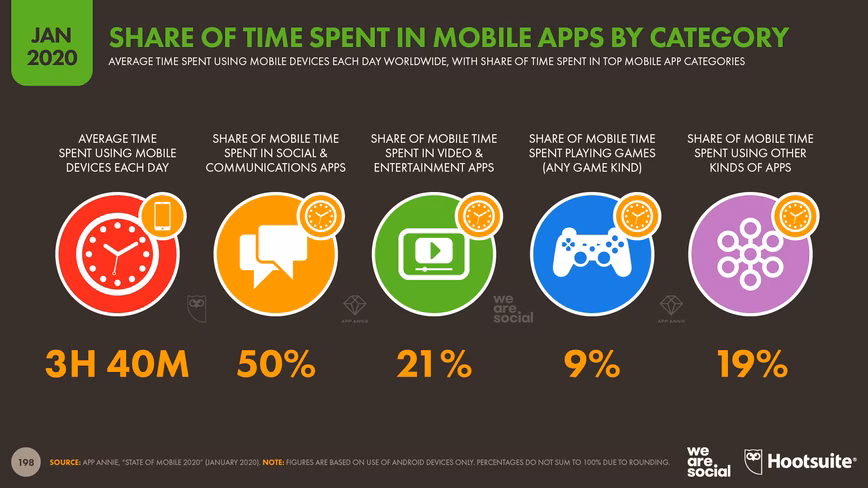
Roughly half of the 3.7 hours that people spend using mobile phones each day is spent using social and communications apps, meaning that these platforms account for the same share of our mobile time as all of our other mobile activities put together.
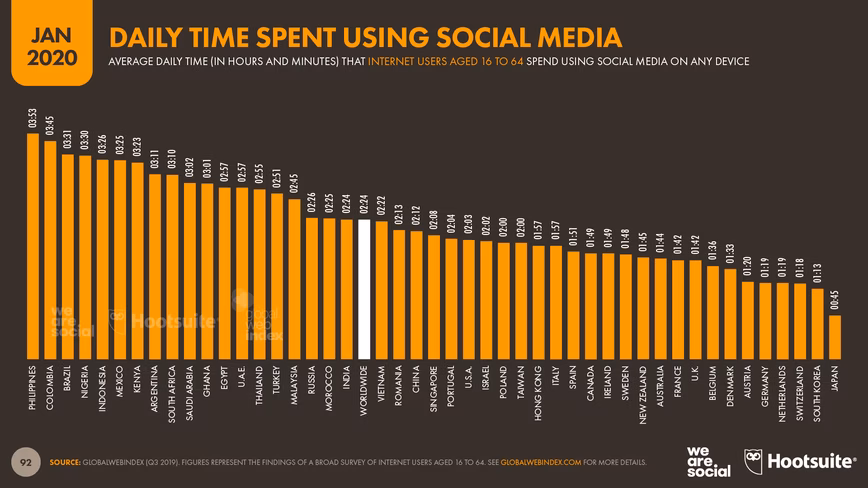
 Across mobile devices and computers, GlobalWebIndex reports that we now spend an average of 2 hours and 24 minutes per person, per day using social media, up by 2 minutes per day since this time last year.
Once again, the story varies by country. Filipinos are still the world’s most ‘social’ people, with the average internet user aged 16 to 64 spending almost 4 hours per day on social platforms. It’s a very different picture at the other end of the scale though, with internet users in Japan spending an average of just 45 minutes per day using social media.
But where exactly are we spending all of that social time – and just how big is TikTok? All will be revealed below…
Facebook still dominates
Despite various challenges over the past few years, Facebook is still top of the pops when it comes to social. Trends in user numbers reported in the company’s earnings announcements suggest that the platform should have already passed the historic 2.5 billion monthly active users (MAU) mark, and user numbers continued to grow steadily across most countries during 2019.
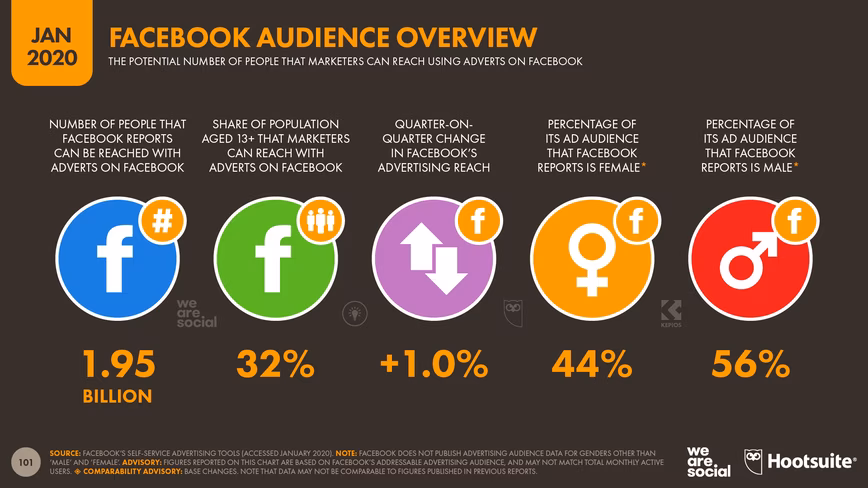
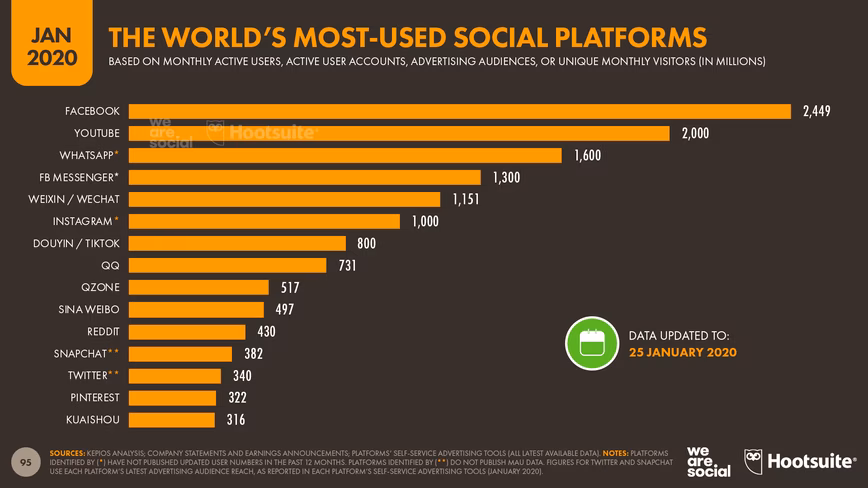 However, for various reasons, marketers can’t reach all of these users using Facebook advertising, and the platform’s own self-service advertising tools indicate that the total addressable Facebook audience now stands at 1.95 billion, or roughly 80 percent of total MAUs.
 Facebook has seen a few audience declines over the past year too. Its self-service advertising tools reported notably lower reach figures for India, Spain, and South Korea at the start of 2020 compared to just a few months earlier. However, overall, Facebook’s audience reach has grown by 1 percent in the past 3 months alone.
Critically, marketers can now use Facebook to reach one-third of all the world’s adults aged 18 and above, and more than half of all the world’s adults aged 18 to 34.
Time for TikTok
TikTok was probably the media’s top social story in 2019, with some huge – and often misrepresented – numbers hitting the headlines. However, a TikTok advertising sales deck leaked by AdAge a couple of months ago offers more clarity on what’s been going on.
First up, there’s no denying it: TikTok is big. 800 million monthly active users big.
However, 500 million of these active users – more than 60 percent of the total – live in China. That means that the platform has roughly 300 million monthly active users outside of China, which would put it in the same league as Snapchat or Twitter.
Furthermore, the latest data from App Annie suggest that Chinese users account for 80 percent of the total time spent using TikTok in 2019, while users in India account for a further 10 percent of the total. That means that users in China and India are responsible for roughly 9 in every 10 minutes spent using TikTok around the world.
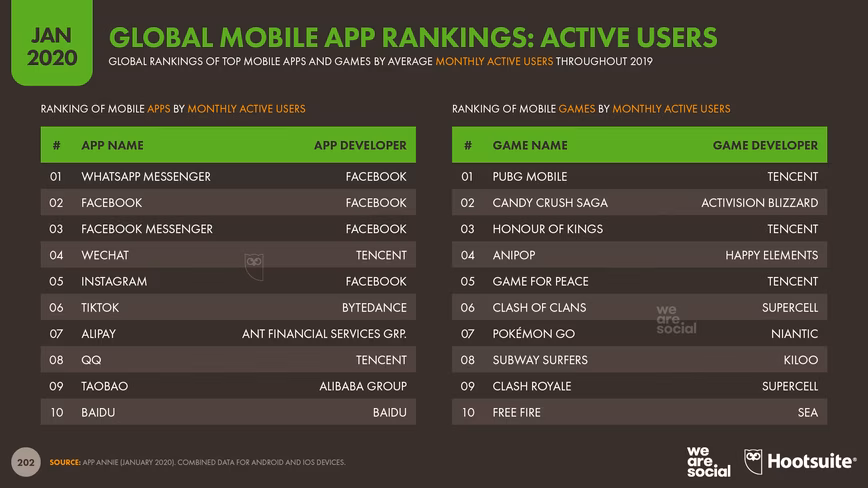
Regardless of country differences, however, TikTok climbed to sixth place in the global mobile app rankings by monthly active users for 2019. For context, TikTok is still behind WhatsApp, Facebook, WeChat, and Instagram, but it’s already ahead of all the other social platforms.
 However, it’s important to stress that the data does not indicate that TikTok’s success has come at the expense of any of the Western social networks. In fact, Facebook, Instagram, and Snapchat have all reported increases in their advertising audience reach over the past few months, even amongst users aged 13 to 17.
Strong growth isn’t limited to TikTok
While the media has been distracted with all the hype surrounding TikTok, some other social platforms have been posting some impressive numbers that seem to have slipped under the radar.
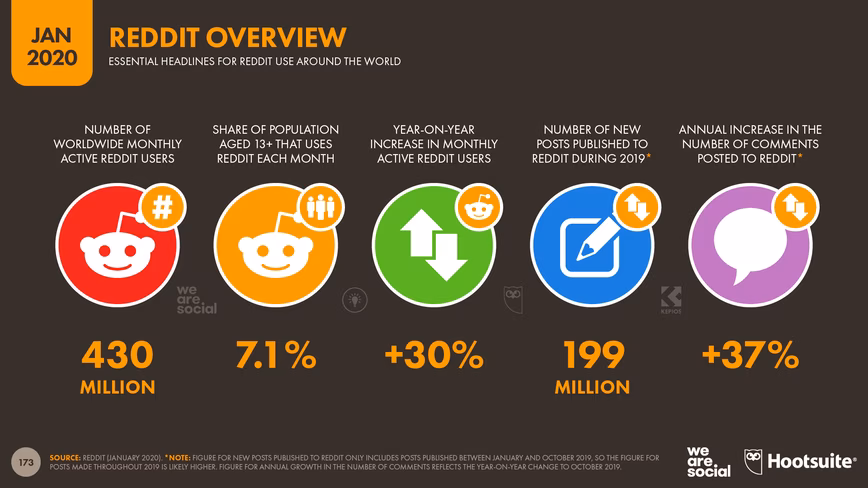
Top of the growth charts is Reddit, whose reported monthly active user numbers have surged by 30 percent (100 million new users) since this time last year, with the company’s latest reports revealing that the platform now attracts 430 million users each month.
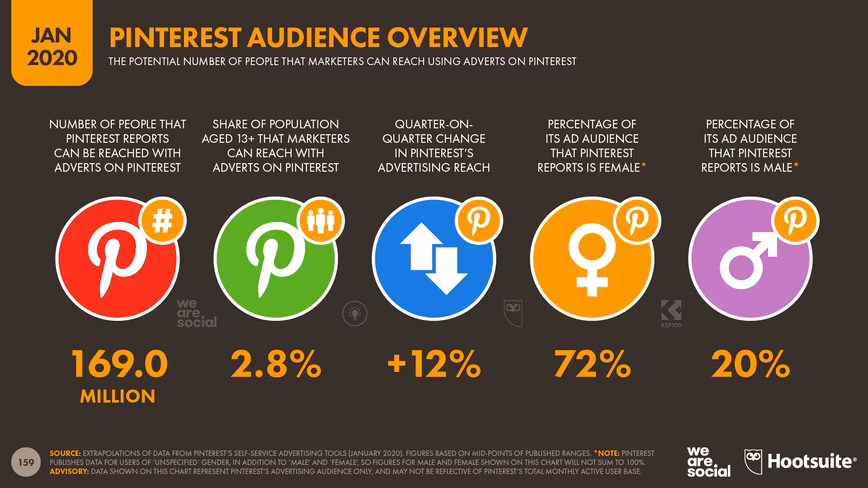
 Meanwhile, Pinterest has enjoyed similar success, growing its total active user base by 29 percent over the past year. The platform has attracted more than 70 million new monthly active users (MAUs) over the past 12 months, to reach a total MAU figure of 322 million at the start of 2020.
The company has also added a number of new countries to its advertising targeting options, resulting in a quarter-on-quarter increase in reported potential advertising reach of 12 percent between October 2019 and January 2020.
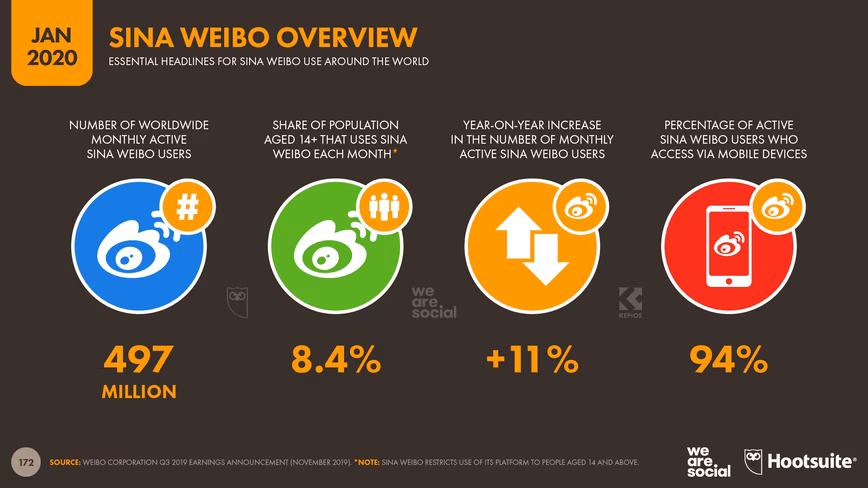
 Sina Weibo has also been enjoying impressive growth, with recent trends suggesting that the platform’s MAU numbers should pass the half-billion mark within the next few months. The 497 million MAUs that the platform reported in November was buoyed by an annual increase of 51 million new users, equating to year-on-year growth of 11 percent.
The influence of the East
Mirroring a trend that we highlighted in our Digital 2019 Q4 Digital Statshot report, various data points in our Digital 2020 reports show that the internet’s center of gravity is moving progressively eastward. This trend is even more visible in the latest data, with Asian apps and websites commanding an ever-increasing share of global activity.
In particular, the latest rankings of the world’s top websites illustrate the dramatic rise of Asia’s ecommerce platforms. In its latest list, Alexa [note: not the voice assistant] places China’s Tmall in third place in the global website rankings – that’s ahead of both Facebook and Baidu, and 10 places higher than its top Western competitor, Amazon. Across the full top 20 sites, Alexa includes 5 Chinese ecommerce sites, 4 of which belong to Alibaba.
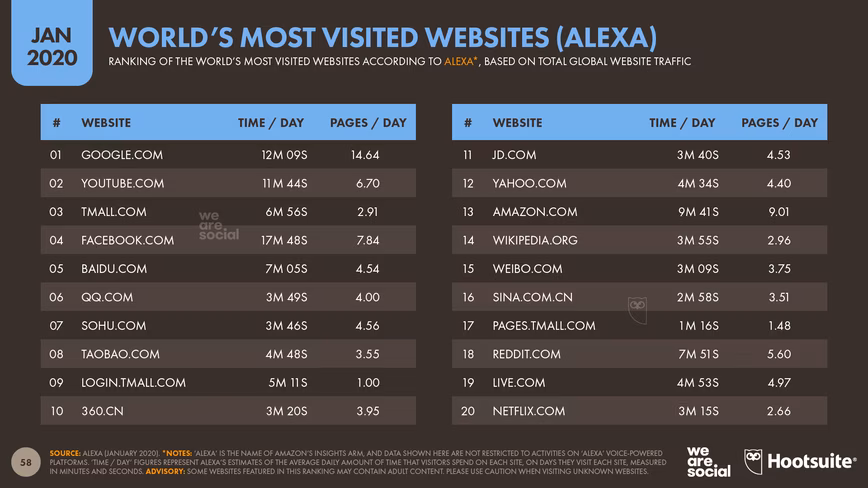 It’s worth noting that Alexa uses a 3-month rolling average of monthly website traffic to determine its rankings, and the latest data include activity around Singles’ Day. This huge online shopping festival – the Chinese equivalent of Black Friday or Cyber Monday – is increasingly popular throughout Asia, so it’s perhaps not surprising that China’s ecommerce giants are becoming much more visible at a global level.
However, it’s not just China’s ecommerce sites that are breaking through at a global level:
- Baidu, China’s top search engine, ranks fifth in Alexa’s latest list, and fourth in a similar ranking from SimilarWeb.
- QQ, a popular messenger platform owned by WeChat’s parent company, Tencent, currently claims the sixth spot in Alexa’s rankings
- Seventh spot in Alexa’s rankings is occupied by Sohu, a popular online portal that offers news, search, gaming, and various other services.
- Qihoo 360, a Chinese internet security company that is best known for its antivirus software, popular web browser, and mobile app store, takes Alexa’s tenth spot.
Asia’s rising influence is also evident in the latest rankings of mobile apps. App Annie reports that 6 of the world’s 10-most used non-game apps in 2019 belong to Chinese companies, while 4 of 2019’s top 10 games by monthly active users were developed by Chinese companies.
For context, Eastern and Southeastern Asia account for roughly one-third of the world’s total internet user population at the start of 2020 (1.5 vs 4.5 billion). What’s more, with more than 50 million new users coming online for the first time in the region over the past 12 months, these audiences will play an increasingly influential role in shaping the next phase of the internet’s growth – in Asia and beyond.
Voice continues to grow
The latest data from GlobalWebIndex show that use of voice interfaces has grown by more than 9 percent over the past year, with 43 percent of the world’s internet users between the ages of 16 and 64 now using voice search and voice commands on any device each month. For context, if that figure were applicable to the entire global internet users base, it would equate to almost 2 billion monthly active users.
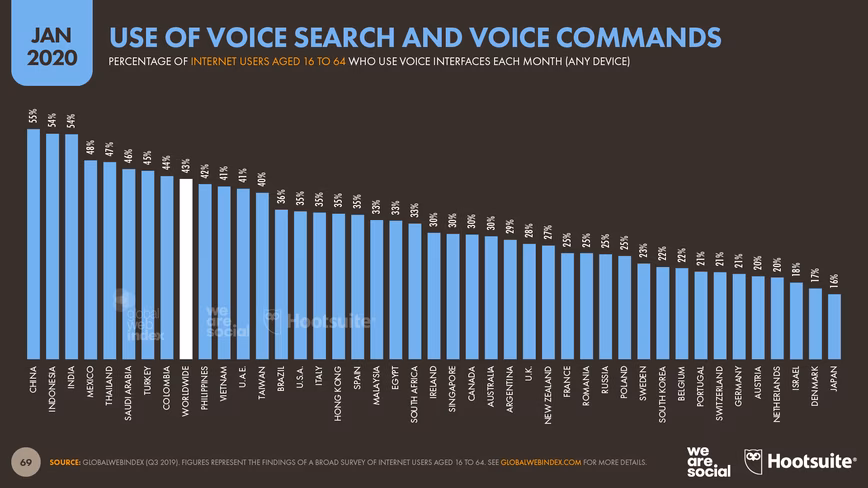 However, it’s important to stress that the rise of voice isn’t only about the use of smart speaker devices. One in three global internet users now use voice interfaces on their mobile phones each month, but these figures are even higher in Asia: 40 percent of Indian internet users say they used a voice interface on their phone in the past month, compared to 42 percent in China, and an impressive 48 percent in Indonesia.
With these countries home to some of the world’s largest internet populations, expect voice control to find its way into an increasing number of mobile apps over the coming months, especially because people around the world are increasingly using voice search as part of their shopping journey.
The worried wide web
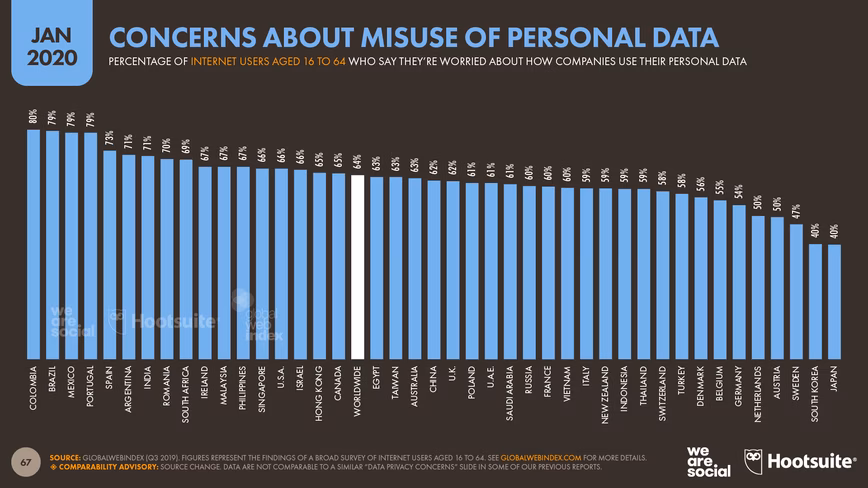
Privacy remains an important issue for internet users around the world, and the latest research finds that we’re more concerned today than we were this time last year. GlobalWebIndex reports that 64 percent of internet users are worried about how companies use their data, up from 63 percent at the start of 2019.
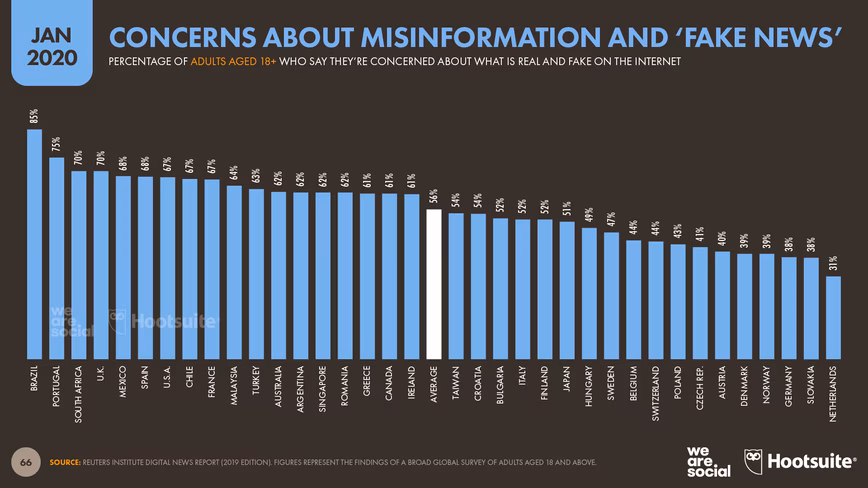
 People are also increasingly distrustful of the things that they see and hear on the internet. 56 percent of adults aged 18+ around the world surveyed by The Reuters Institute for the Study of Journalism said that they were “concerned” about what is real or fake on the internet, up from 54 percent in the previous year’s study.
 Meanwhile, the number of people around the world aged 16 to 64 who use tools to block ads each month has also increased since our Digital 2019 reports. GlobalWebIndex reports that nearly half of all internet users aged 16 to 64 used an ad blocker in the past month, up from the 47 percent that they reported this time 12 months ago.
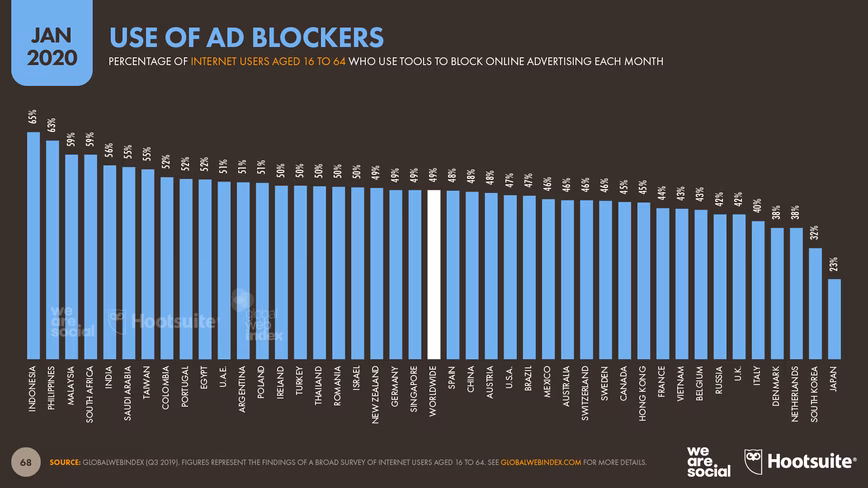 However, it’s worth highlighting that GlobalWebIndex’s survey respondents cite frustrations with the sheer number of adverts on the internet as their primary motivation for using ad blocking tools, ahead of motivations related to privacy concerns.
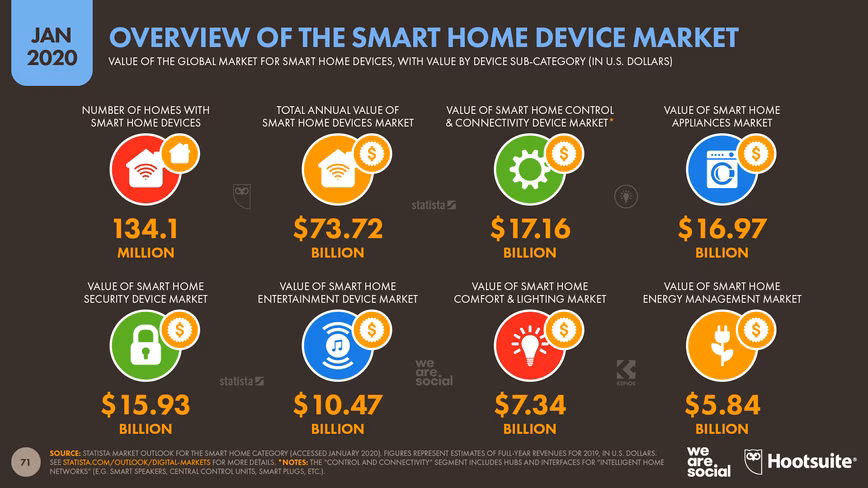
Moreover, various data points in this year’s reports highlight what we might call a ‘digital privacy paradox’. There’s little doubt that many of us really are increasingly concerned about our digital privacy, but we’re also increasingly likely to adopt devices and technologies that are specifically designed to create and share even more intimate data about our lives.
For example, Statista reports that the number of homes around the world with at least one smart home device increased by a third over the past year, indicating that tens of millions of people have consciously decided to spend an average of US$550 a year on devices that actively listen to and track the things that they do in the privacy of their own homes.
Games are a serious business
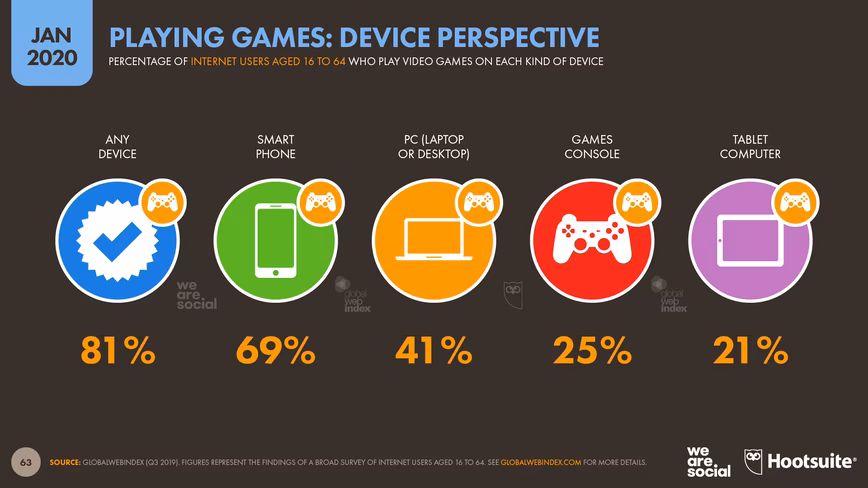
More than 4 in 5 internet users aged 16 to 64 around the world play video games every month, which would equate to a total global gaming community of more than 3.5 billion people if we applied that figure to the total internet user population. The majority of gamers play games on their smartphones (69 percent of all internet users), but 25 percent of internet users also report playing games on dedicated gaming consoles.
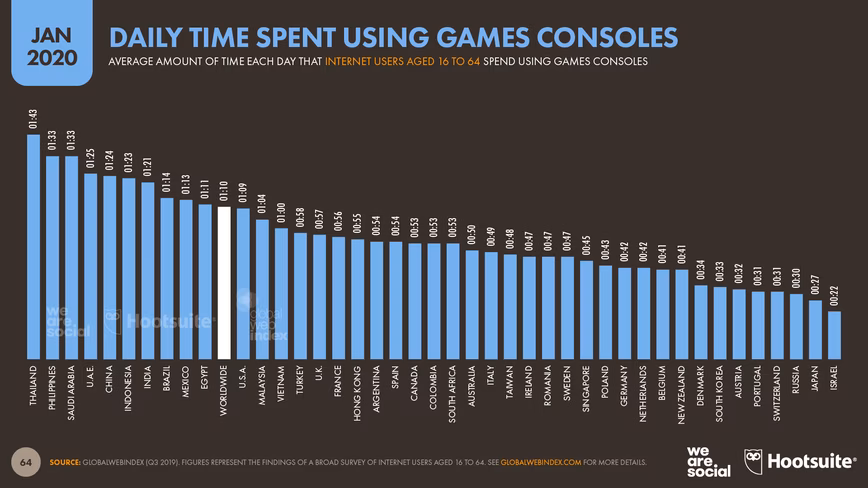
 These more ‘dedicated’ gamers spend an average of 70 minutes per day playing console games, but this rises to more than 90 minutes per day for console gamers in Thailand, the Philippines, and Saudi Arabia.
 People are increasingly willing to spend money on games, too. NewZoo reports that gamers spent more than US$150 billion on games in 2019, an increase of almost 10 percent compared to the previous year. Similarly, Statista reports that internet users spent more than US$83 billion on online game purchases in 2019, up by roughly 5 percent year-on-year.
Mobile games are also big business, with App Annie reporting that the world’s mobile users spent more than US$65 billion on game apps and game-related in-app purchases in 2019, accounting for more than 70 percent of total consumer spend on mobile apps in the past 12 months.
It’s worth noting that in-app purchases are an increasingly important part of the gaming industry, with GlobalWebIndex reporting that 8 percent of all internet users aged 16 to 64 purchased some form of game-related “DLC” (downloadable content) in the past month alone.
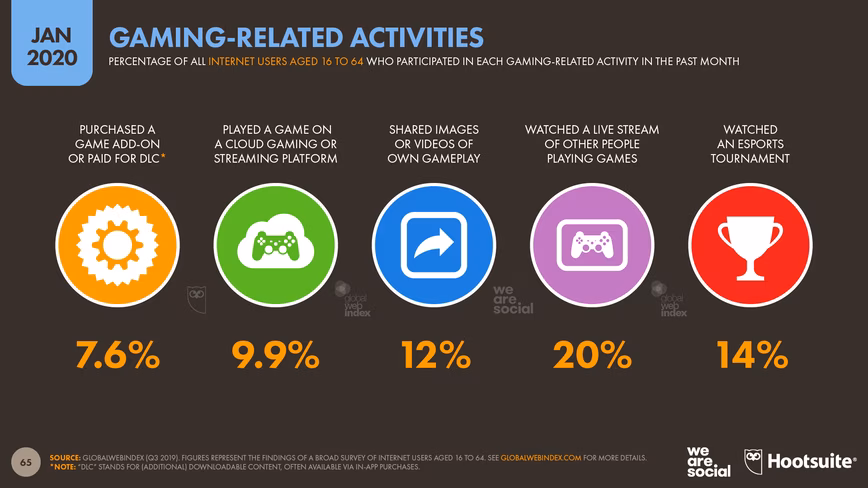 People are also spending more time watching other people playing games. 1 in 5 internet users aged 16 to 64 watched a live-stream of someone else’s gameplay during the past 30 days, while 1 in 7 watched an esports tournament.
Many marketers in the West remain skeptical of esports, perhaps because they see little evidence of their popularity in their own lives. However, the data offer irrefutable evidence that hundreds of millions of people around the world already watch other people playing games every month.
Video is still the one to watch
The latest data from Ericsson suggest that the world’s mobile internet users will consume more than half a trillion gigabytes of mobile data during 2020, with roughly two-thirds of that total being used to stream and download video content. Fun fact: if you tried to store all of that data on 3½” floppy disks, you’d need a stack of disks that stretched from the Sun to somewhere beyond Jupiter.
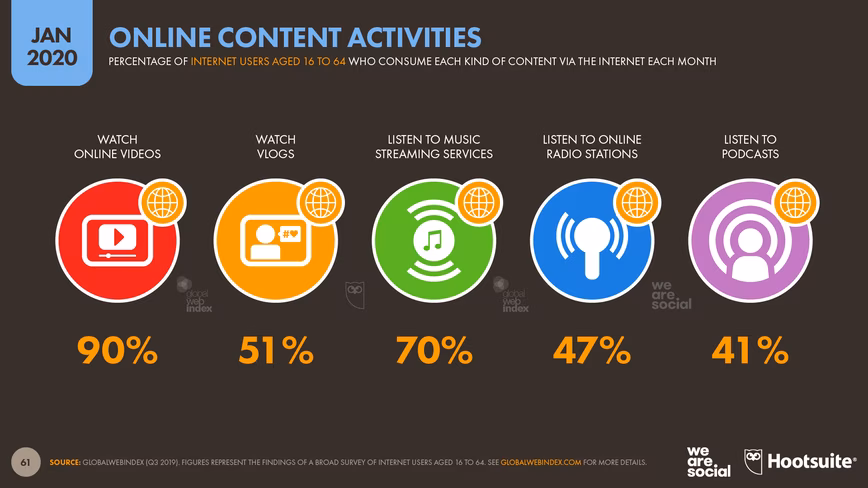
Video’s scale isn’t just about data consumption, either. GlobalWebIndex reports that 90 percent of internet users aged 16 to 64 now watch online videos each month, which would translate to more than half of the world’s total population if we applied that figures across all of the world’s internet users.
 YouTube still commands the greatest share of the world’s online video viewers, and our calculations indicate that roughly 3 billion people watch at least one YouTube video each month [note: YouTube itself reports 2 billion signed-in viewers each month].
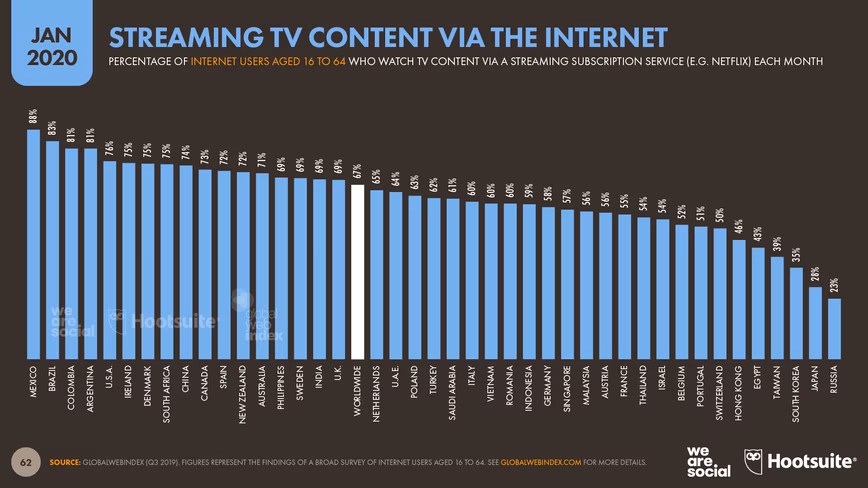
However, the number of people streaming TV content via the internet also continues to rise. GlobalWebIndex’s latest data show that two-thirds of internet users aged 16 to 64 now watch TV content via some form of subscription service (e.g. Netflix).
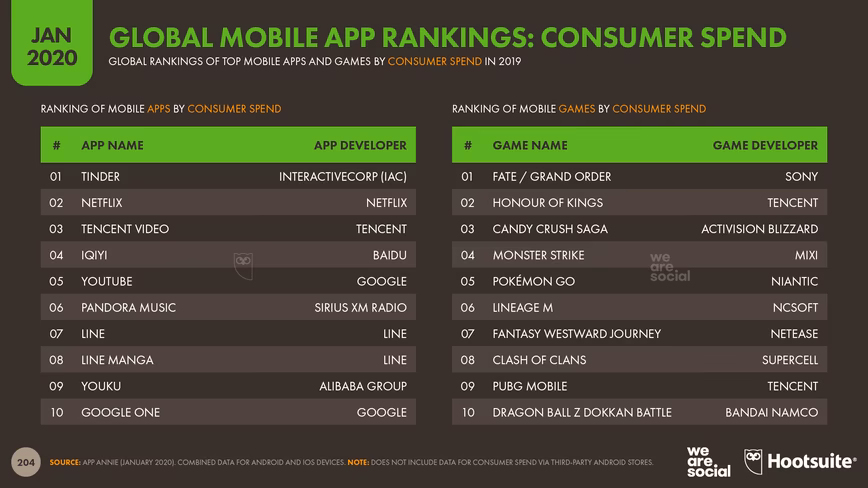
 Paid video subscription services are popular with mobile users too. App Annie reports that video apps accounted for 5 of the world’s top 10 non-game apps ranked by consumer spend in 2019. Three of these apps – Tencent Video, iQiyi, and Youku – cater primarily to internet users in China, reinforcing a finding from Statista that the country’s internet users are the most willing to pay for digital content.
No stopping shopping
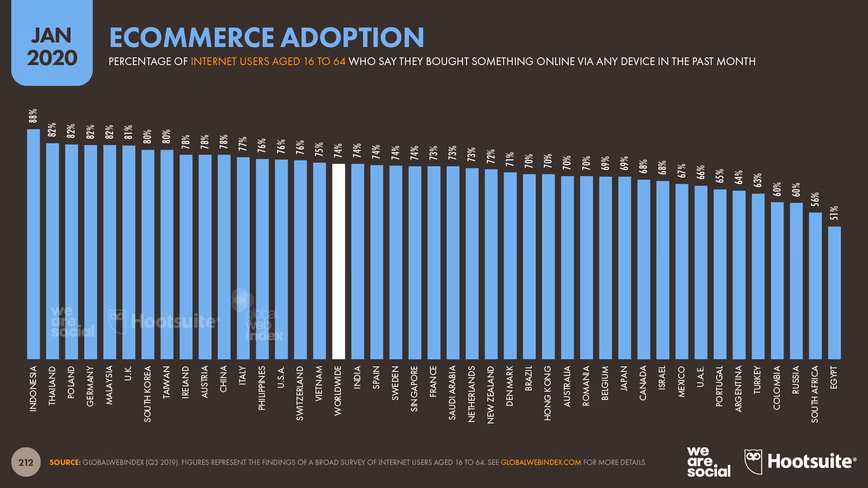
Roughly three-quarters of the world’s internet users aged 16 to 64 buy something online each month, with GlobalWebIndex finding that ecommerce adoption rates are highest amongst internet users in Indonesia, Thailand, and Poland.
The distribution of adoption across geographies suggests that economic development is not the primary determinant of ecommerce use, and that other factors are more important, such as sites that cater to the language needs and cultural preferences of local shoppers.
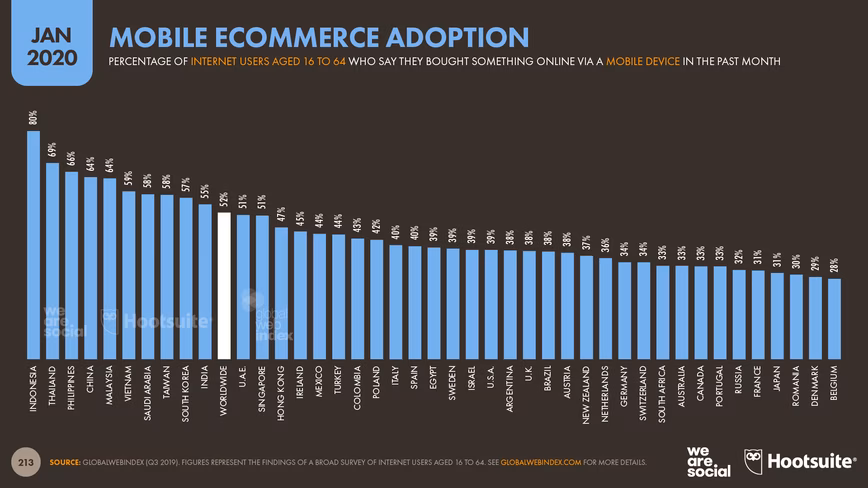
 Worldwide, ecommerce consumers are more likely to purchase through a mobile device than through a laptop, although the data reveal that most people use both devices for their online shopping, depending on the type of product they’re buying and the context of their shopping activities.
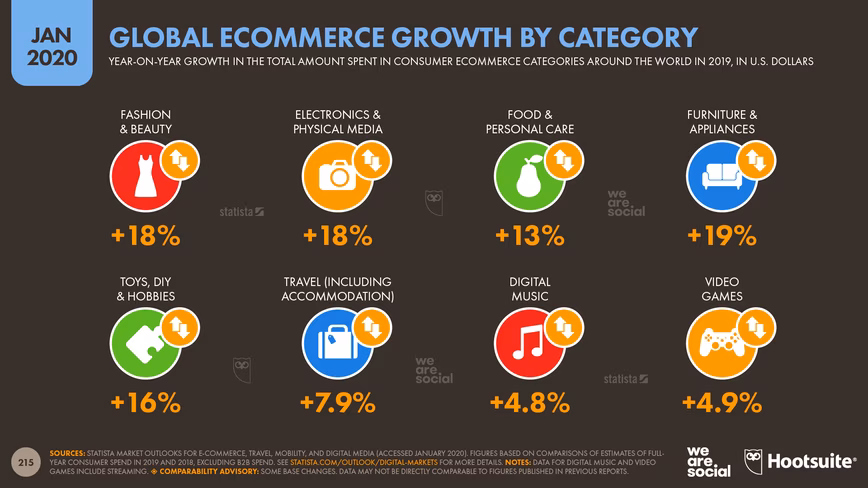
 Meanwhile, the latest data from Statista shows that worldwide ecommerce spend grew significantly during 2019, although – as one might expect – growth rates varied by category. Travel, the largest category by online consumer spend, saw the slowest year-on-year growth amongst the categories that Statista tracks, with global annual revenues up by roughly 8 percent to reach US$1.19 trillion.
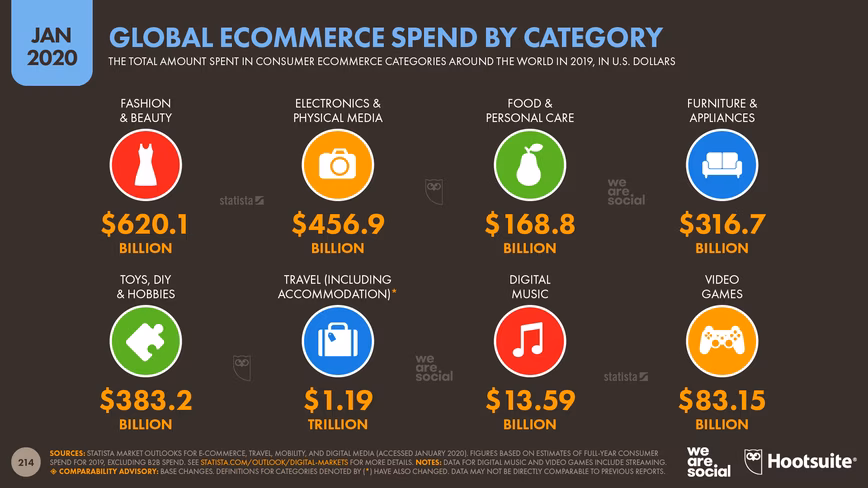 Online purchases of Furniture & Appliances saw the fastest year-on-year growth, with 2019 worldwide consumer revenues of US$316.7 billion marking a 19 percent jump compared to 2018 spend. The Fashion & Beauty and Electronics & Physical Media categories also saw impressive gains, with consumer ecommerce revenues in both categories increasing by 18 percent between 2018 and 2019.
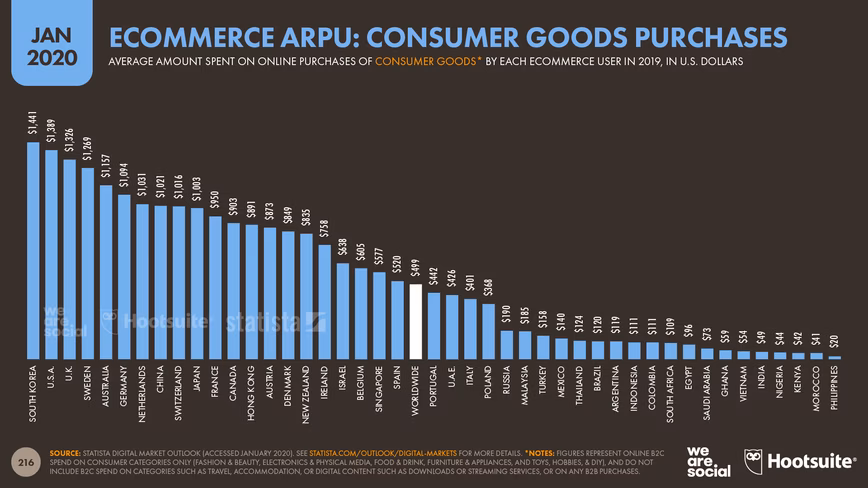
 At a global level, the average ecommerce shopper now spends almost US$500 on online purchases of consumer goods each year, although Statista reports that this varies significantly by country, from an average of US$1,441 per person in South Korea, to just US$20 per person in the Philippines.
Average annual revenues per user (ARPU) grew by 9 percent over the past 12 months, but growth in Southern Asia was much faster. The latest data show that average ecommerce spend on consumer goods in India has increased by 43 percent compared to 2018 figures, but is still below US$50.
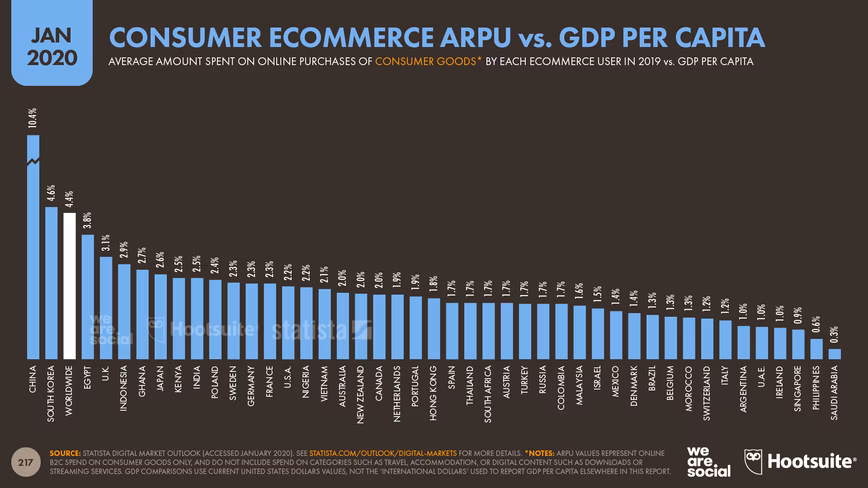
 However, these figures are based on absolute spending, and don’t factor differences in average income or each country’s overall economic strength. By comparing ecommerce ARPU to GDP per capita, we get a more representative perspective of the countries in which ecommerce is gaining the greatest momentum.
As we detailed above, China’s ecommerce websites are already amongst the world’s most-visited online destinations, so it might not come as a surprise that China leads the way in GDP-adjusted ARPU rates. However, despite relatively low figures for absolute ecommerce ARPU, Egypt and Indonesia both rank highly for these GDP-adjusted averages, while Ghana, Kenya, and India also find themselves much higher up the rankings.
Shopping is a journey, not a destination
“Omnichannel” has become a buzzword in the retail industry, and rightly so: all the evidence indicates that the world’s shoppers are making less and less of a distinction between ‘online’ and ‘offline’ when it comes to their shopping. Blended behaviors such as ‘click and collect’ are on the rise, and showrooming – where consumers visit physical world stores before buying products online – is also an increasingly common practice.
Overall, GlobalWebIndex reports that search engines are the primary source of discovery for new brands and products for the world’s internet users, slightly ahead of television adverts.
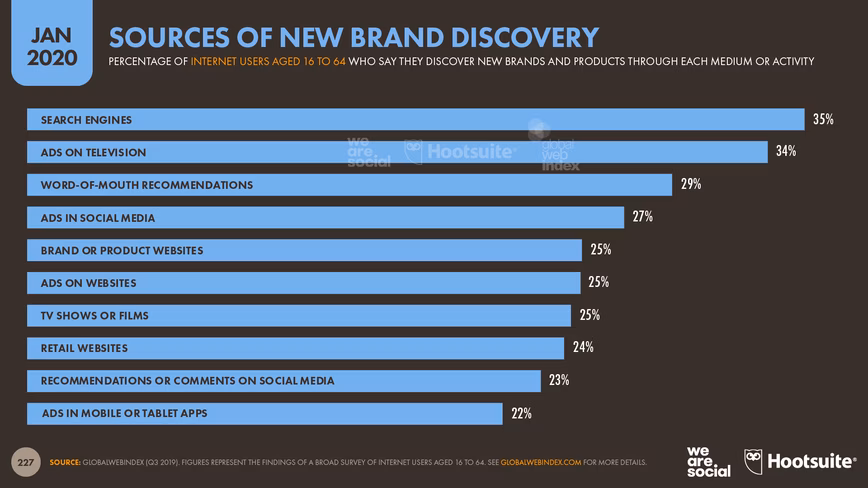 Meanwhile, across all online shoppers aged 16 to 64, search engines are the first choice for people who are actively researching brands, products and services to buy, with more than half (53 percent) of GlobalWebIndex’s survey respondents saying that they use these tools.
However, the company also reports that younger users are more likely to turn to social media when they’re researching brands and products, finding that social networks have already overtaken search engines as the most popular method of online research for people aged 16 to 24.
Social media’s role in the purchase journey continues to expand, with 43 percent of internet users around the world aged 16 to 64 now saying that they use social networks when researching things to buy.
But social commerce hasn’t caught on to the extent that many marketers might have hoped. As GlobalWebIndex stated in their recent Commerce trends report,
While social networks often play a central role in the initial steps on the path to purchase, only 12 percent of internet users say that a ‘buy’ button on a social network would drive them to check-out online.
The authors go on to note that,
At present, enthusiasm about buying ordinary goods and services via social networks is limited. However, this is something that robust branded content and inspiration can change.
The key takeaway here is that there is no silver bullet when it comes to “closing a sale”, and marketers would do well to consider the full scope of the consumer purchase cycle – from initial discovery through to purchase, and even post-purchase activities – when devising their plans.
Moreover, marketers would do well to stop thinking in terms of ‘online’ and ‘offline’. With most shoppers demonstrating that they’re equally happy to engage with connected devices and physical-world properties in equal measure – often simultaneously – it’s increasingly clear that these ‘lines’ only exist in marketers’ heads and budgets.
And finally…
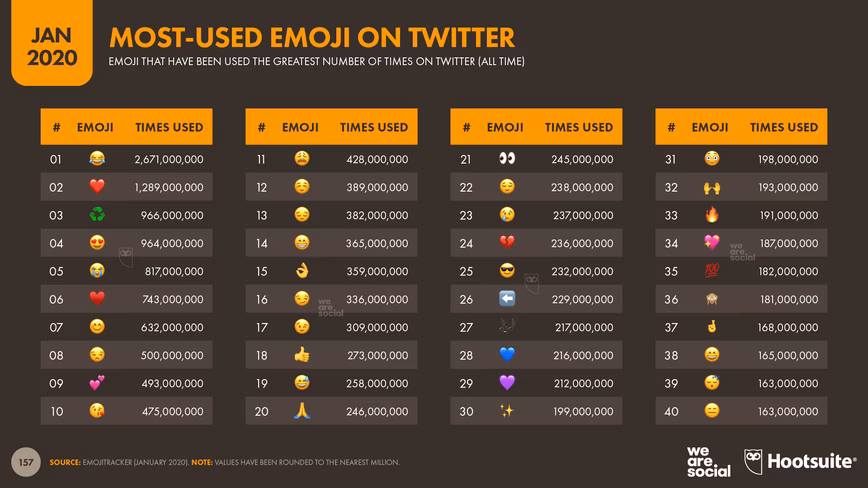
Every year when we’re producing these reports, we spot something fun in the data. In previous editions that’s been which emoji people use most on Twitter (we’ve included that in this year’s report too), or the discovery that Yahoo! is still more popular than porn (spoiler alert: it still is).
 However, this year’s fun fact goes to the very heart of why the internet exists, and marks a fundamental shift in the internet’s center of gravity that’s arguably as radical as the rising influence of the East.
If you’ve been online since the ’90s (ahem), you may know that the internet was in fact invented to share pictures of kittens. However, recent trends in some of our most cutting-edge data reveal that things may be changing.
Data from Google Trends reveals that people searched for dogs almost twice as frequently as they searched for cats in 2019. For reference, the average search index for ‘dog’ in 2019 was 90, compared to an average of 52 for ‘cat’.
Similarly, Twitter’s ad targeting tools report that more than 250 million of the platform’s users are “interested” in dogs, compared to just 250,000 who are interested in cats – that’s a thousand-fold difference.
Dogs even outperform cats on Instagram. A quick search reveals almost 250 million posts have been published to the platform using #dog, compared to just 200 million for #cat. Doug the Pug also has more followers than Grumpy Cat (RIP).
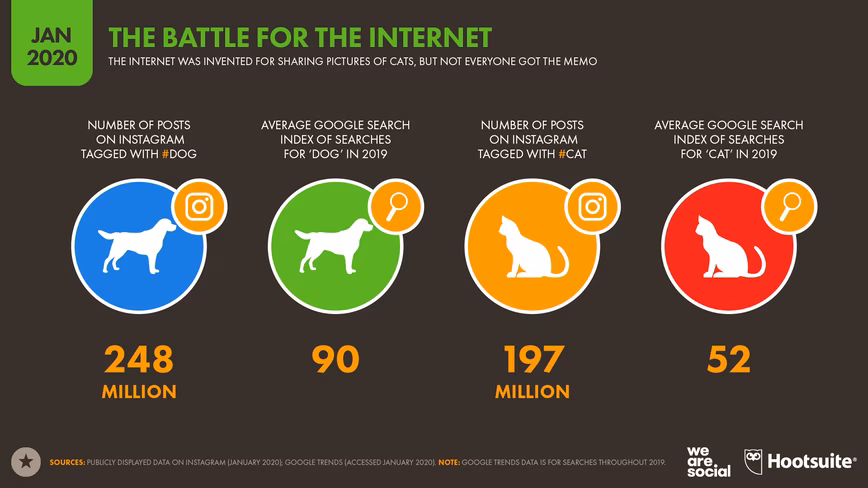 However, there’s still hope for cat lovers: a Google search for ‘dog’ at the start of 2020 delivered a total of 6.76 billion results, but a search for ‘cat’ returned a total of 6.82 billion.
Cats also still rule Reddit, where r/cats is home to 1.70 million users, compared to 1.29 million for r/dogs.
We’ll share updates on this important story as and when we get them. Let the debates commence.
Looking ahead
We’ll publish a few more articles that dig deeper into some of the more nuanced findings in this year’s reports over the coming weeks, and we’ll also share more detailed data for local countries starting in mid-February [note: you can get started with our most recent numbers in our complete report library].
But how can we translate these findings into more efficient and effective plans? Let’s finish with three top tips.
1. Go beyond your bubble
Internet behaviors are changing, with influences from around the world shaping the expectations and preferences of people in all corners of the globe. It’s no longer enough to watch what’s going on in your own backyard (or valley); global marketers who want to stay ahead of the curve need to broaden their horizons, and look to other parts of the world for insight and inspiration.
Our 240+ local country reports will be a good place to start, but you can also take simpler, more everyday steps to learn. Digital and social platforms make it easier than ever to connect with – and learn from – people all over the world, whether they’re domain experts on LinkedIn and Twitter, or everyday people on Instagram.
Top tip: don’t just rely on research; go out onto the web and into social media and watch what’s happening for yourself.
2. Prioritize people
Many of the marketers I speak with around the world ask me whether TikTok will overtake Facebook, whether VR will become “a thing”, or whether the data I see point to a “next big thing.”
We strive to offer insight on all of these issues through our regular Global Digital Reports, but my answer to all of these questions is the same: focus your attention on people, not technology.
Almost without exception, the companies and brands that succeed over the long-term are those that successfully satisfy people’s wants, needs and desires – not those who’ve jumped on a bandwagon, created an isolated ‘viral’ campaign, or jumped at every shiny new toy without a clear strategy.
Understanding people will serve you well regardless of the latest trends in technology, fashion, or business.
My advice here is similar to the advice I shared above: take a few minutes each day to go onto public social media platforms and learn about what your audience cares about. You don’t need creepy, invasive data for this – just search for a few relevant hashtags on Instagram, Twitter, or LinkedIn, and you’ll quickly start to learn what really matters to your audience.
Don’t just search for product-related hashtags, though. Try exploring cultures too, by constantly asking yourself what’s different about what you’re seeing compared to what you expected.
3. Focus
Staying on top of the latest tech trends is one of the biggest causes of stress for marketers everywhere. Hopefully our Global Digital Reports help, but maybe a better answer is less, not more.
Do you really need to try that niche new platform with a couple of million users, or might you be better focusing your efforts (and budgets) on one or two proven platforms with billions of active users?
Will that shiny new toy really propel your brand to perpetual success, or is it just a pleasant distraction from quarterly planning? More importantly, is it a sustainable solution that justifies a steep learning curve (VR, anyone?)
On the flip-side, can you really justify ignoring the big trends, just because they don’t appeal to you on a personal level? Gaming, voice interfaces, and esports are all hugely popular with global audiences, yet continue to be underrepresented in the media coverage, in marketing plans, and in brands’ budgets.
Top takeaway: in 2020, use data-driven insights to identify a handful of technologies and platforms that really matter to your brand’s success, and not simply to add the latest fads to your roadmap.
I’ll be back over the coming days with some deeper-dive analysis, but that’s all for this year’s headline summary. I hope you’ve found these numbers and insights useful, and that they’ll help you to deliver another year of impressive digital growth all of your own.
Get the TNW newsletter
Get the most important tech news in your inbox each week.