We Are Social and Hootsuite’s latest collection of Global Digital reports reveals that internet users are growing by an average of more than one million new users every day, with all of the original ‘Next Billion Users’ now online.
The number of people using the internet has surged over the past year, with more than one million people coming online for the first time each day since January 2018. It’s not just internet users that have been growing either, as the extensive new collection of Digital 2019 reports from Hootsuite and We Are Social reveals.
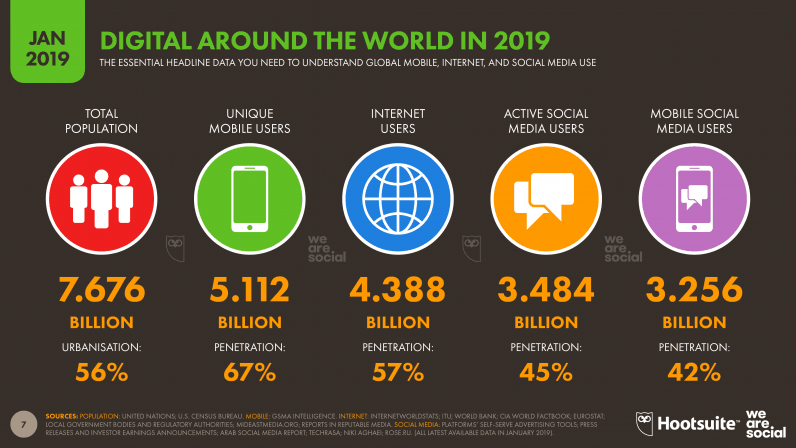
We’ll explore all of the key trends and insights from this year’s reports in detail in this article, but here are the essential headlines you need in order to understand ‘Digital in 2019’:
- There are 5.11 billion unique mobile users in the world today, up 100 million (2 percent) in the past year.
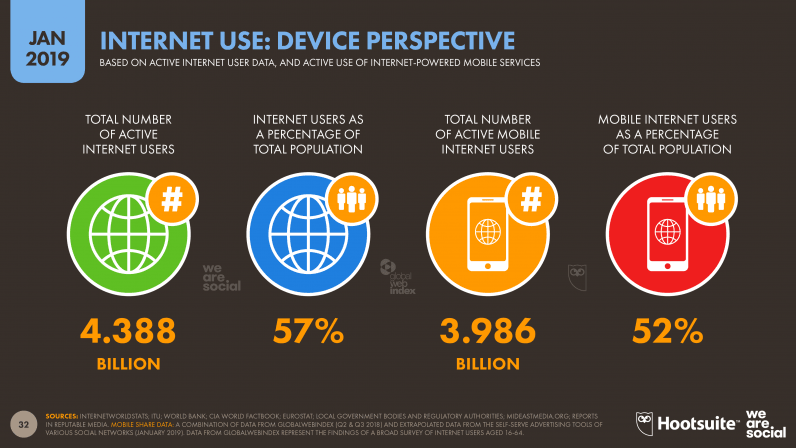
- There are 4.39 billion internet users in 2019, an increase of 366 million (9 percent) versus January 2018.
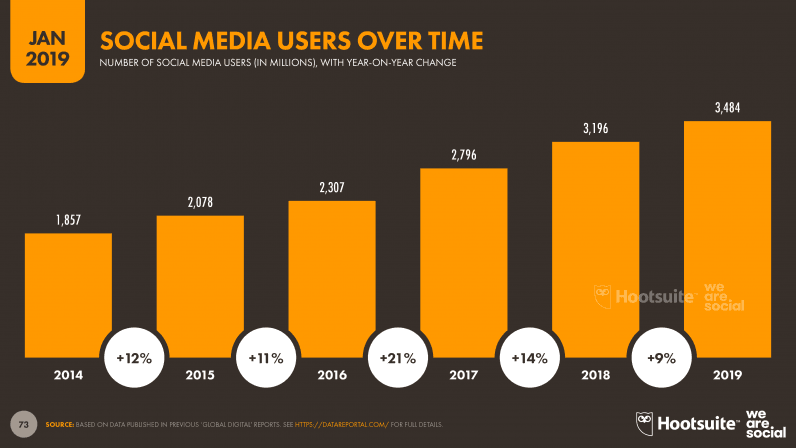
- There are 3.48 billion social media users in 2019, with the worldwide total growing by 288 million (9 percent) since this time last year.
- 3.26 billion people use social media on mobile devices in January 2019, with growth of 297 million new users representing a year-on-year increase of more than 10 percent

Before we get into the analysis though, I’d like to take a moment to thank all of the wonderful data partners who’ve made this year’s series of reports possible, in particular:
OK… all set for those numbers?
Internet users in 2019
I’m sure I say this every year, but 2018 really was another year of impressive growth across all things digital. However, perhaps the most compelling story in this year’s numbers is that internet user growth actually accelerated in the past year, with more than 366 million new users coming online since we published our Digital 2018 reports.
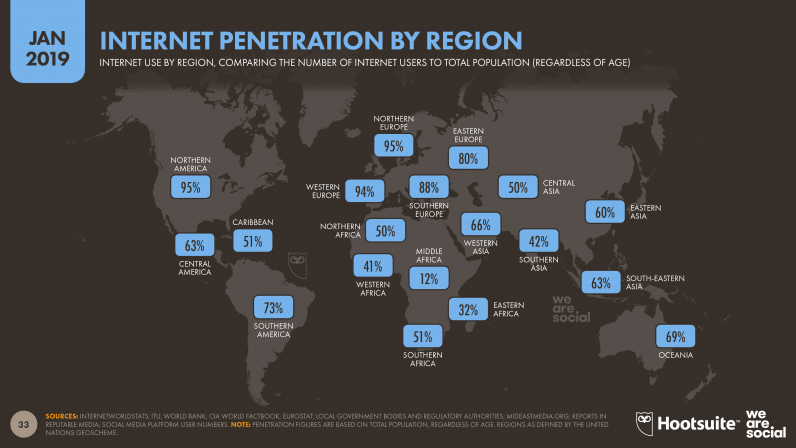
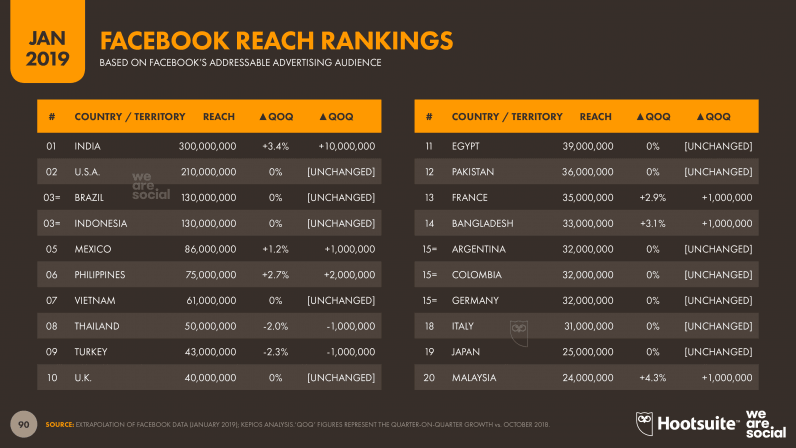
The standout story here is India, which has seen internet users jump by almost 100 million in the past 12 months, representing annual growth of more than 20 percent. Internet penetration in the South Asian country now stands at roughly 41 percent – a considerable improvement over the 31 percent that we reported this time last year.
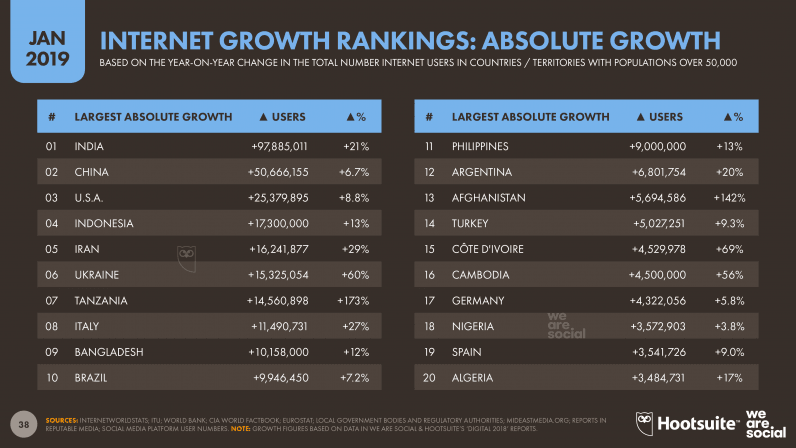
Perhaps surprisingly though, the United States takes third spot in our global ranking of absolute internet user growth. Despite already enjoying an internet penetration rate of 88% this time last year, internet users in the US grew by almost nine percent year-on-year, reaching a total of more than 310 million users in January 2019 (95 percent penetration).
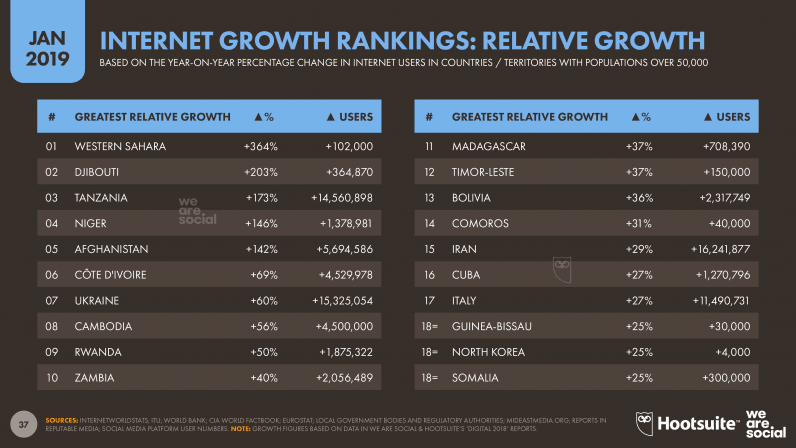
Meanwhile, African nations dominate the list of countries with the fastest growing internet communities, although many of these countries start from relatively small bases. Western Sahara saw the greatest year-on-year relative gains, with the reported number of internet users in the country increasing by almost five times since January 2018.
Five countries saw their internet populations double over the past 12 months, while nine countries experienced annual growth of 50 percent or more.
The number of internet users around the world has grown by more than 1.9 billion since our 2014 reports, an increase of more than 75 percent in just five years. This year’s total of 4.39 billion global users is also more than double the figure of 2.08 billion that we reported in our first Global Digital report back in January 2012.
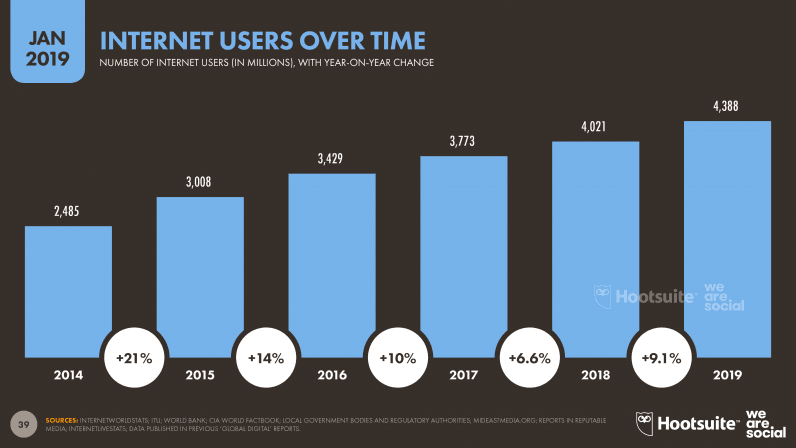
Data from the ITU suggest that it took roughly 16 years for the internet to reach its first billion users, but just another six years for it to reach two billion. However, the data in our Digital 2019 reports suggest that the internet is now growing at a rate of one billion new users every 2.7 years. That rate isn’t sustainable of course – at some point, everyone in the world who wants to connect to the internet will do so – but I wonder if Tim Berners-Lee could even have dreamt of the fact that his handy little tool for sharing research findings would reach almost 4½ billion people by its thirtieth birthday.
Internet user behaviors in 2019
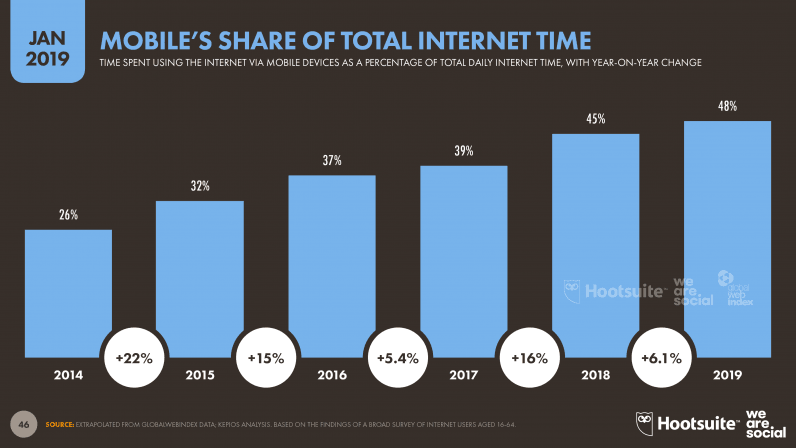
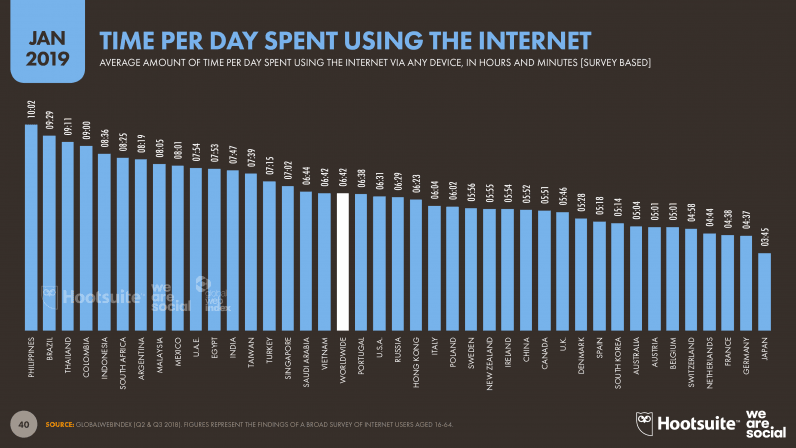
The ways in which people use the internet are evolving quickly too, with mobile accounting for an ever-increasing share of our online activities. I’ll dig into the specifics of mobile and app use in the dedicated mobile section below, but it’s worth noting here that mobile phones now account for almost half the time that people spend on the internet.
Just. Amazing.
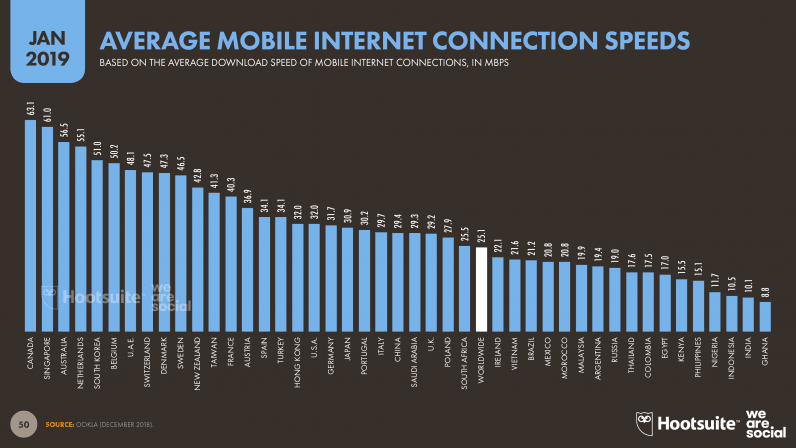
The good news is that faster connections mean we’re achieving more in our online time. Ookla reports that average mobile connection speeds have increased by 18 percent since this time last year, while the speed of the average fixed connection has jumped by a third.
Twelve countries and territories now enjoy average fixed internet connection speeds of more than 100MBPS, while ten countries enjoy average mobile connection speeds in excess of 50MBPS.
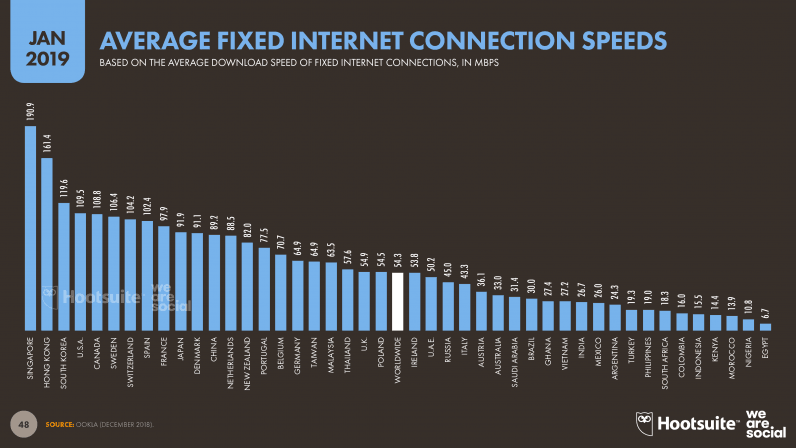
Interestingly, the average mobile connection speed exceeds the average fixed connection speed in 44 out of 117 countries and territories for which Ookla reports data, and the average mobile connection speed is more than double the average fixed connection speed in 10 of those countries.
As you might expect, Google continues to dominate the rankings of the world’s most visited websites, with both SimilarWeb and Alexa putting the search giant at the top of their tables. Alphabet’s ‘other’ big platform – YouTube – comes in at number two on both lists, while Facebook takes third spot.
Social media platforms feature strongly on both companies’ lists, and it’s interesting to note that Twitter continues to show strong results in website rankings, despite its eroding user base (more on that in the social media section below).
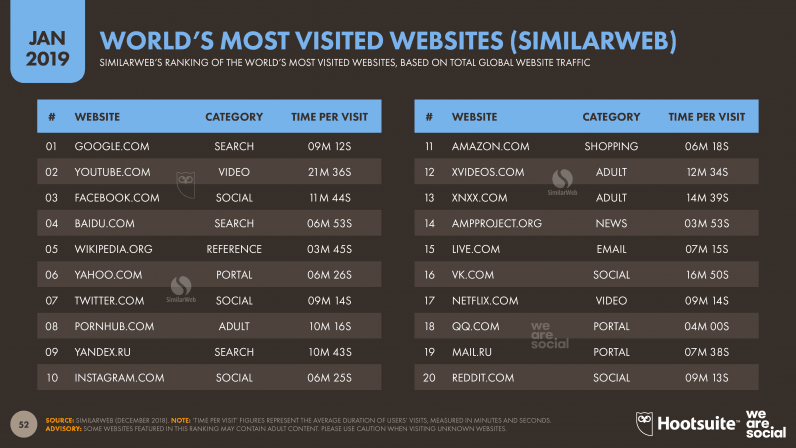
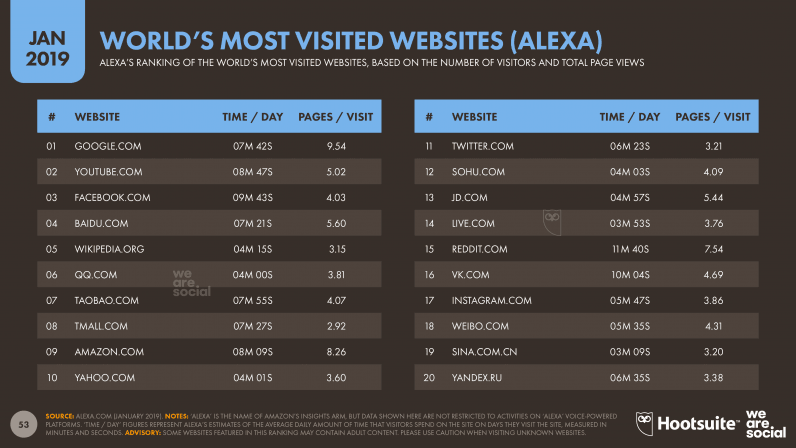
That probably comes as little surprise, but the sheer amount of time involved may still shock you. Data from SimilarWeb suggest that, in 2019 alone, people will spend more than 1 billion days of collective human time on just the top 5 adult sites. Oh, and in case you’re wondering, the average visit lasts just over 10 minutes…
More broadly, video is becoming an increasingly important part of our internet activities. Google searches for the word ‘video’ increased by 30 percent over the past year, and the query now ranks fourth amongst all global queries, behind Facebook, YouTube, and Google. [As an aside, if you’re wondering why people search for Google on Google, it’s all to do with using the address bar as a search input].
GlobalWebIndex reports that 92 percent of internet users now watch videos online each month, meaning that more than 4 billion people around the world are consuming online video content in early 2019. For context, roughly 6 billion people around the world have a television set at home, based on data reported by the ITU.
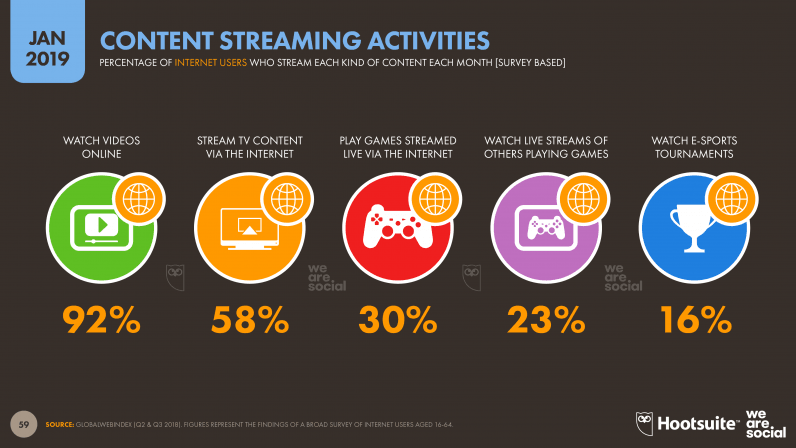
People are spending an increasing amount of time watching other people play games online, too. The latest numbers indicate that almost a quarter of all internet users – more than 1 billion people – watch livestreams of other people playing games each month. Meanwhile, more than 700 million people will watch esports in 2019 – that’s double the number of people who watched Formula 1 in 2017.
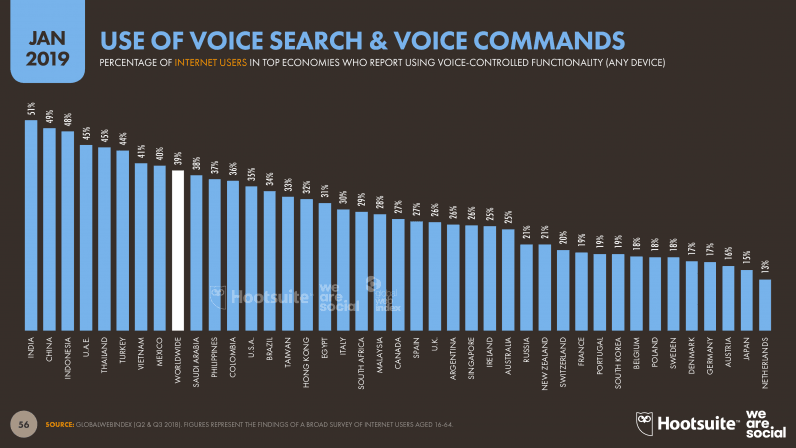
The ways in which people ‘interface’ with the internet are changing too. The use of voice control tools increased significantly during 2018, with roughly four in every ten internet users now using voice commands or voice search every month.
Crucially, roughly half of all internet users in China and India now use voice control, and with these two markets being top priorities for developers, we can expect to see even stronger growth in the use of voice tech during 2019.
Social media users in 2019
Our full suite of Digital 2019 reports includes extensive insights into people’s use of the world’s top social platforms in more than 230 countries and territories around the world. These in-depth numbers tell a mixed story though, with some platforms showing impressive growth over the past 12 months, and others starting to lose ground.
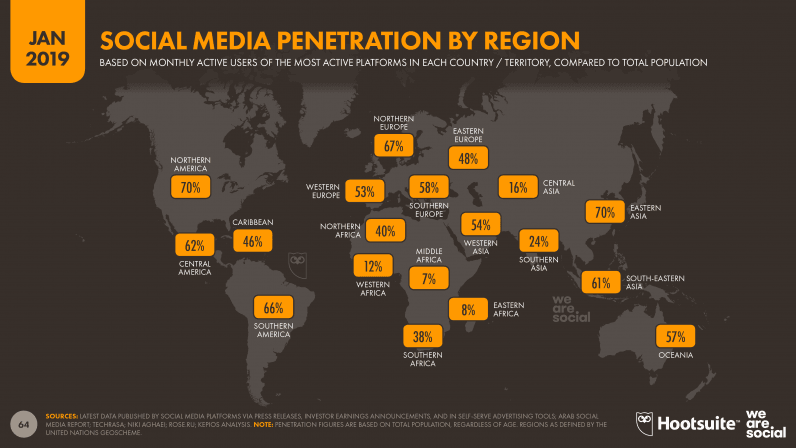
Worldwide social media user numbers have grown to almost 3.5 billion at the start of 2019, with 288 million new users in the past 12 months pushing the global penetration figure to 45 percent. Social media use is still far from evenly distributed across the globe though, and penetration rates in parts of Africa are still in the single digits.
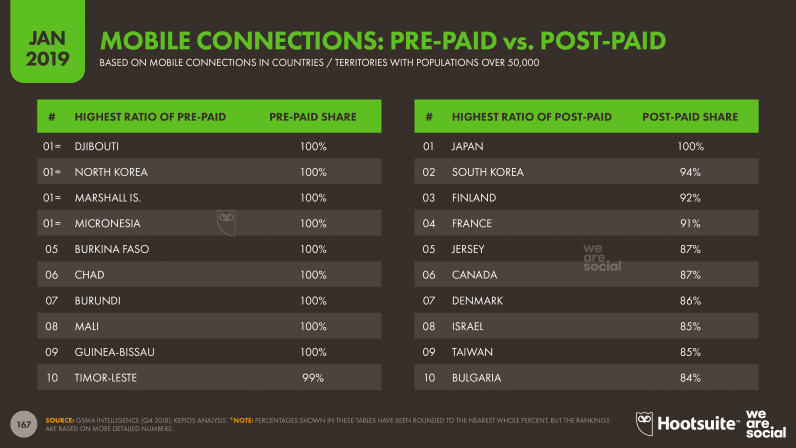
At the other end of the scale, North Korea continues to languish in last place in the global social media rankings, with a penetration figure of less than 0.1 percent. This is perhaps unsurprising though, considering that the internet – or at least the internet as the rest of the world knows it – remains blocked throughout the country. We also suspect that the figures for Turkmenistan may actually be higher than those reported here, but we have been unable to source data from the county’s top platform, imo.
African nations make up the remainder of the bottom 10 countries by social media penetration, and a number of countries across the region actually registered declines in social media use over the past 12 months.
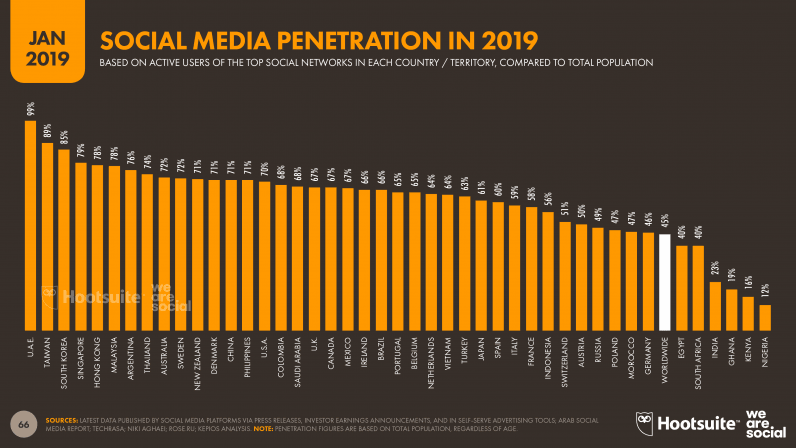
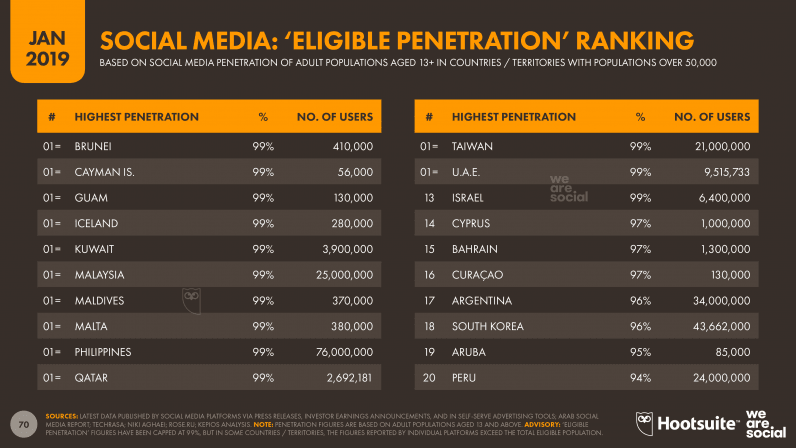
Considering that almost 40 percent of the total population in some parts of Africa is below the age of 13, this has a meaningful impact on the overall social media picture. The number of social media users around the world at the start of 2019 equates to roughly 58 percent of the total ‘eligible population’, but this figure rises to more than 70 percent in almost 100 countries around the world.

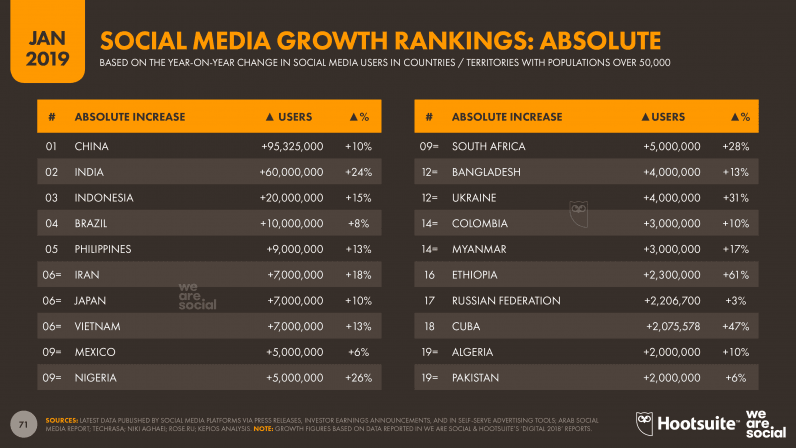
The good news is that many countries have shown strong growth in social media use over the past 12 months. Just as in the internet growth rankings above, Western Sahara posted the fastest social media growth during 2018, with the number of active users in the country increasing by more than 4½ times [note: in the absence of other data, we use active social media user numbers as a proxy for internet users in Western Sahara, which is why the numbers are the same].
Ethiopia has also seen impressive growth this year, with an additional 2.3 million new users translating to annual growth of more than 60 percent. Encouragingly, Cuba has also witnessed strong social media growth this year, despite internet access remaining a challenge across the country.
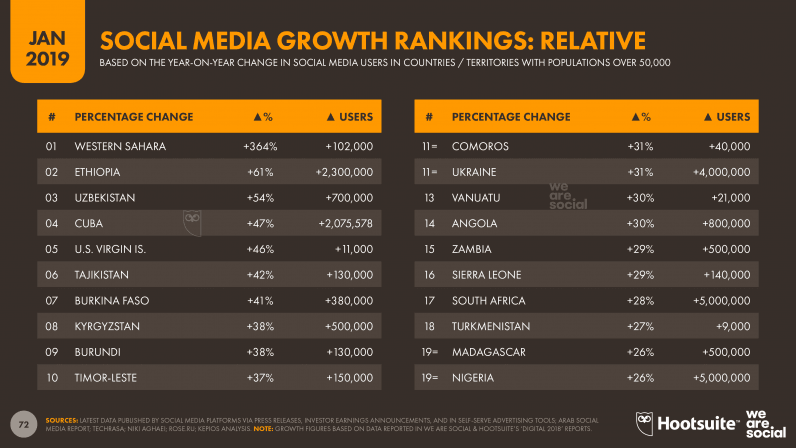
Meanwhile, despite a flurry of restrictions on social media platforms in recent months, the number of people using social media in Iran has also grown considerably in the past year. The team at Techrasa and local social media expert Niki Aghaei both concurred that annual user growth is well into double digits, and even official government sources have reported strong growth.
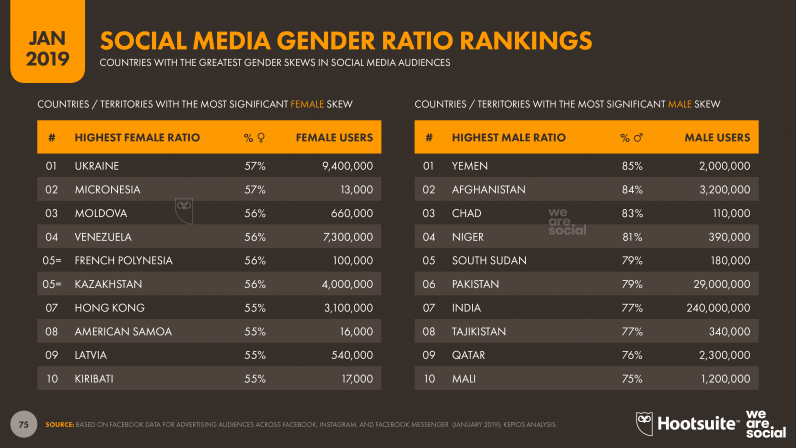
While these figures are specific to social media users, they’re likely representative of broader internet use too, which suggests that women suffer from poor levels of internet access in many parts of the developing world. As an essential resource for education, financial inclusion, employment, and empowerment, ensuring more equal internet access for women must be a priority for the next phase of internet development.
Social media behaviors in 2019
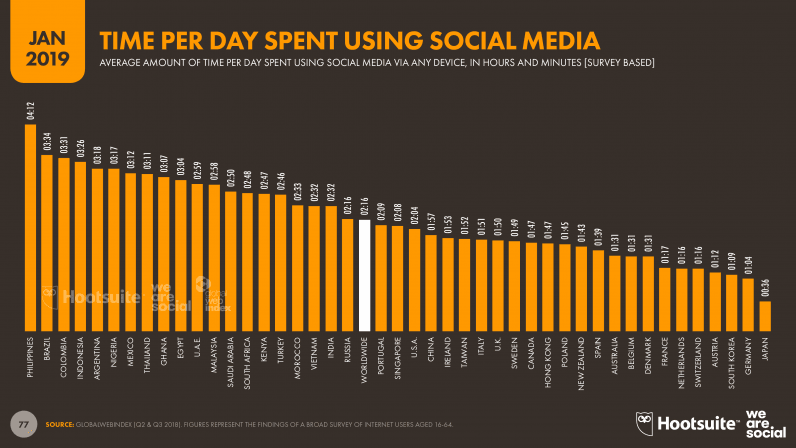
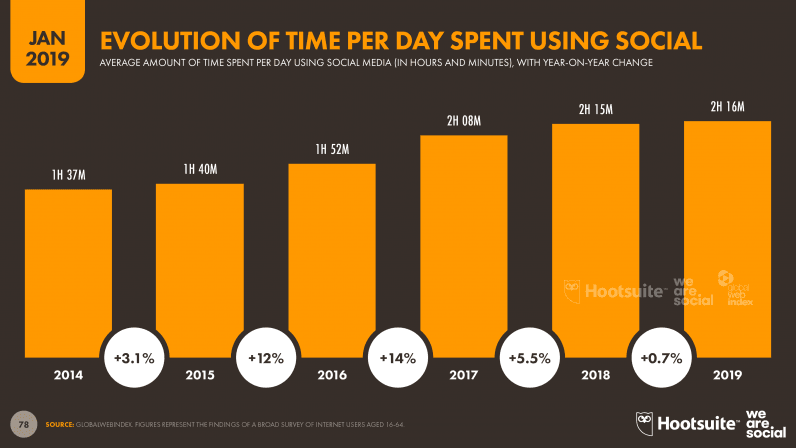
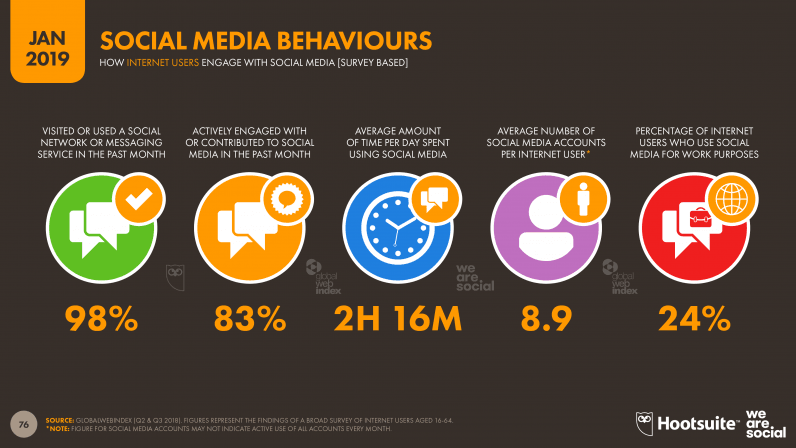
The amount of time that people spend on social media has increased again this year, albeit very slightly. GlobalWebIndex reports that the average social media user now spends 2 hours and 16 minutes each day on social platforms – up from 2 hours and 15 minutes last year – which equates to roughly one-third of their total internet time, and one-seventh of their waking lives.
As with internet use, this time quickly adds up: if we extend this average daily time across all 3.484 billion people using social media today, we get a combined total of almost 330 million years of human time spent on social platforms during the course of 2019.
It’s worth noting that the time spent on social media varies considerably across cultures though, with internet users in Japan spending an average of just 36 minutes on social media each day. At the other end of the scale, Filipinos continue to spend the most time on social media, with this year’s average of 4 hours and 12 minutes reflecting an increase of 15 minutes per day (6 percent) versus the average that we reported last year.
Meanwhile, the average user now has an account on almost nine social media platforms, but they don’t necessarily engage with every one of these accounts each month. People are also increasingly using social media for work activities, with almost a quarter of users saying they’ve done so in the past month. If we extend this average to the total number of social media users around the world, the data suggest that more than 800 million people are using social media for work today.
Top social media platforms in 2019
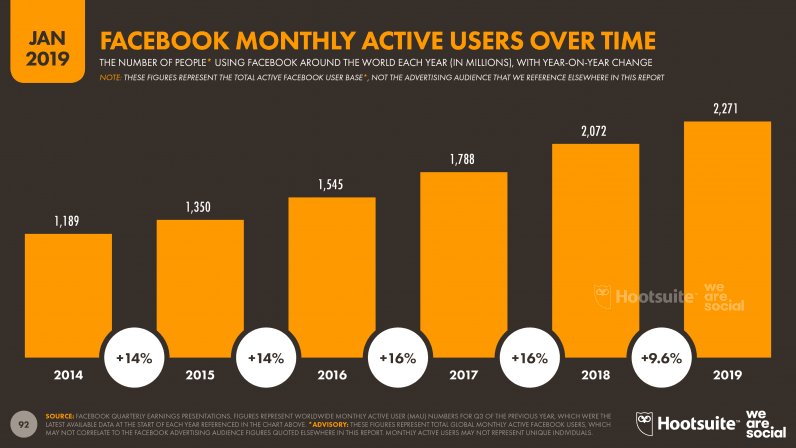
Despite a troubling year in 2018, Facebook maintains its top platform ranking in early 2019, and – contrary to ongoing media hysteria – there’s little evidence to suggest that people are leaving the platform in any significant numbers.
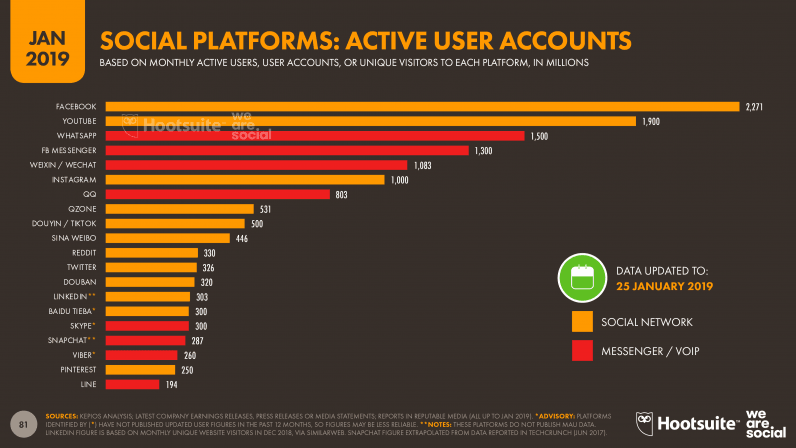
YouTube comes in at number two in this year’s rankings, but the world’s favorite video site posted some impressive new user numbers over the past year, and looks set to be the next social platform to break the 2 billion user mark.
Current growth trends suggest that WhatsApp won’t be too far behind though, especially considering that the 1.5 billion number we’re reporting here the latest figure that the platform has published – dates back to January 2018.
WeChat (Weixin in China) delivered another strong year in 2018 too, with China’s top platform joining the prestigious ‘billion users club’ over the past 12 months. That club now includes Instagram too, who revealed that they’d passed the 1 billion active accounts milestone back in June last year.
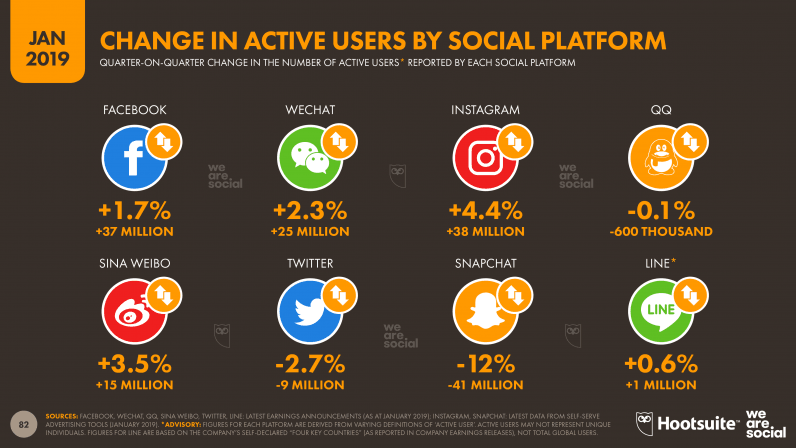
Twitter isn’t alone in its suffering, though; the latest active user data from Snapchat shows that the platform’s user base is in steady decline, while the platform’s advertising audience has seen significant drops in recent months, as we’ll explore in more detail below.
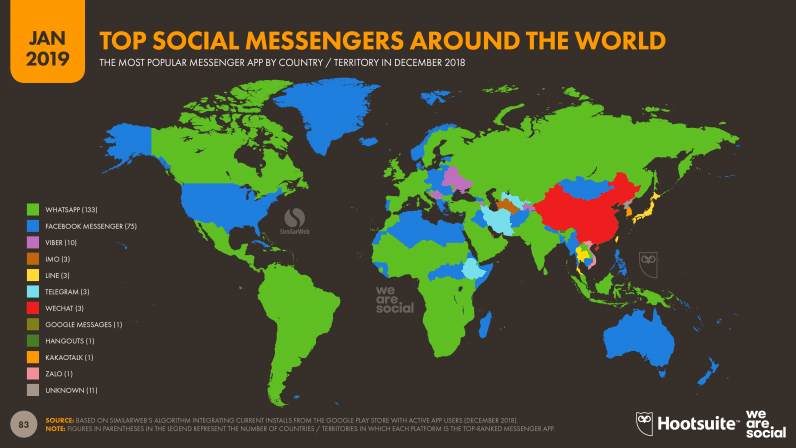
Looking more closely at messaging apps, Zuck and team continue to dominate the worldwide landscape, with the latest data from SimilarWeb showing that either WhatsApp or Facebook Messenger is the most-used app in 208 out of a total of 234 countries and territories for which they have data.
Viber seems to have maintained its focussed popularity since last year, with the messaging platform the top choice for Android users in 10 countries across the globe. However, despite dominance in their home countries, both WeChat and LINE only top the rankings in 3 countries apiece.
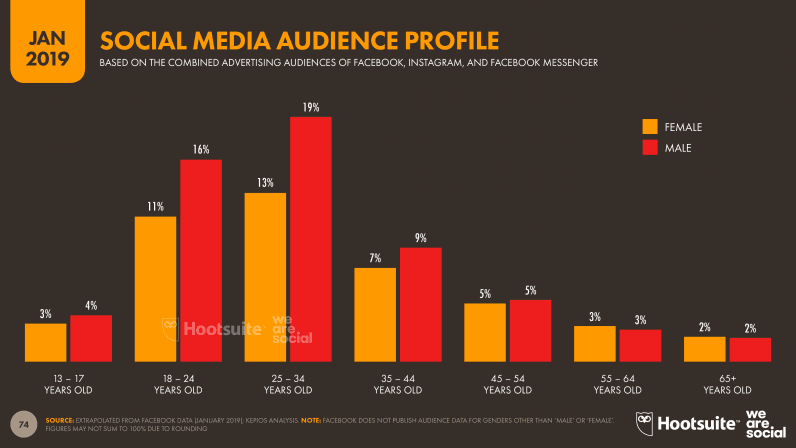
Social media audiences in detail
Before we take a closer look at individual platform numbers, it’s important to note that we’ve revised the way we report the more detailed social media platform audience figures in this year’s reports, so the figures that follow may not be directly comparable to the audience figures we reported in our Digital 2018 reports.
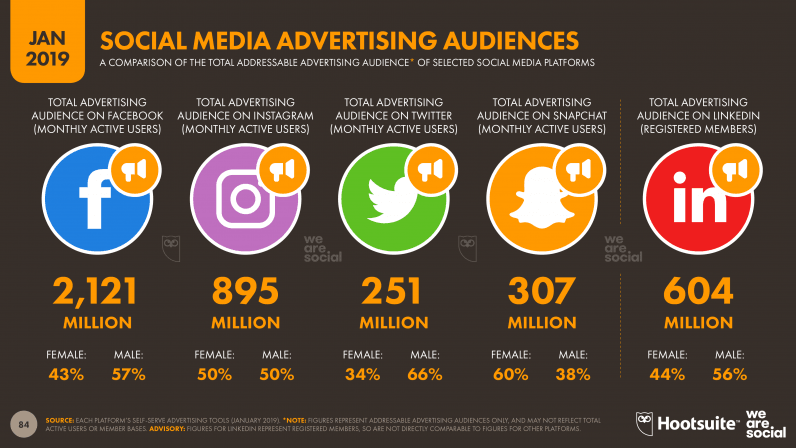
For clarity, we now focus on the addressable advertising audience figures for each platform – rather than overall monthly active user (MAU) numbers – because these advertising audience figures are updated more frequently, and are easier to compare on a like-for-like basis across platforms.
You’ll find the key headlines in the chart below, but read on for a closer inspection of each platform’s latest numbers.
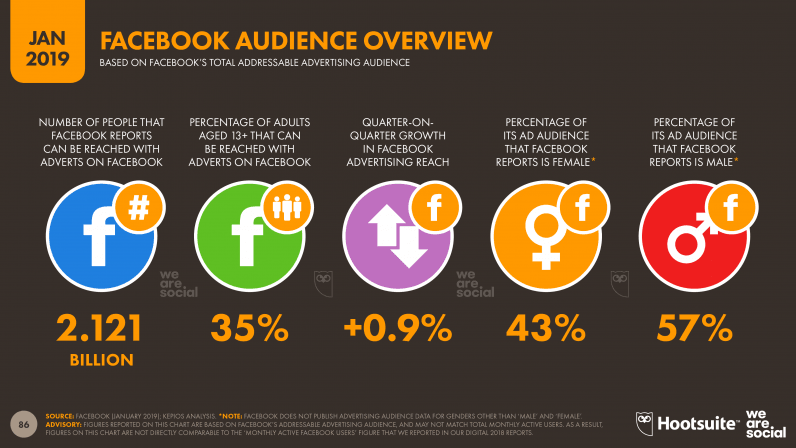
1. Facebook
As we noted above, the cold, hard data show that Facebook hasn’t experienced any of the dramatic user declines that the media continue to portend. In reality, Facebook user numbers continue to grow around the world, with the platform adding 18 million new users to its addressable advertising audience in Q4 of 2018 alone.
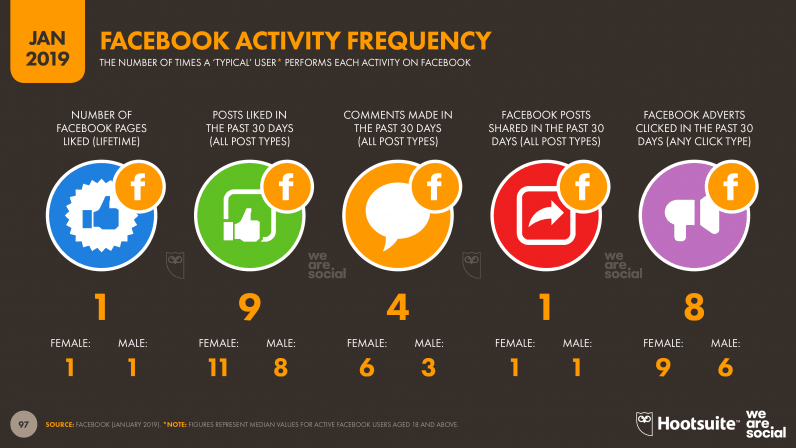
The median number of posts ‘liked’ by the typical Facebook user has fallen by 10 percent in the past 6 months, and now stands at 9 per month. Perhaps even more worryingly for Facebook, the number of times people click on adverts on Facebook is also falling. The global median still stands at 8 adverts clicked per month, but the detail by gender shows that men and women are both clicking on fewer adverts today than they were back in July.
Our assessment is that Facebook’s ad-price bidding model means that, on average, advertisers are paying more for each advert, so the drop in the number of ad clicks has been more than offset by the incremental revenue that Facebook earns from each of those clicks.
This hypothesis is borne out by the latest data from Locowise, who report that the number of Facebook pages investing in paid media has grown by more than 3 percent since October.
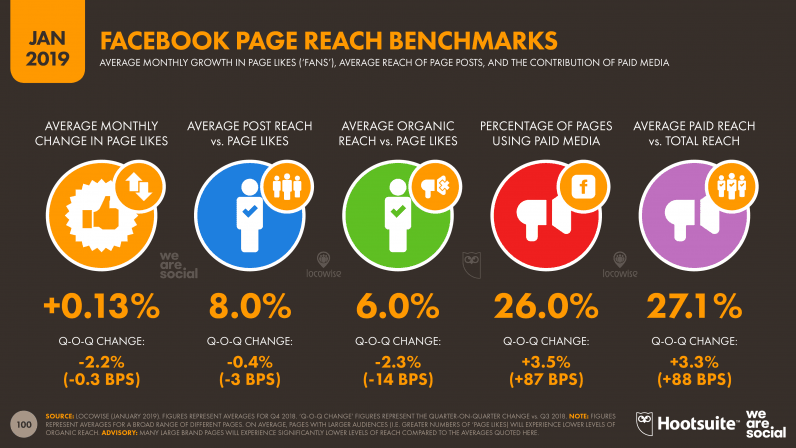
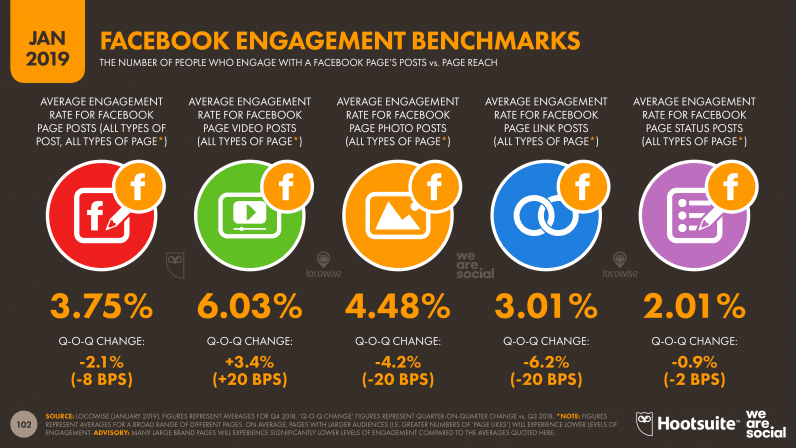
The latest data in this series show that average organic reach is down by 2.3 percent – or 14 basis points – since October. Similarly, average engagement with Facebook page posts is also down by more than 2 percent in the past three months, with fewer than 4 people in every 100 who see a Facebook page’s post engaging with it in some way.
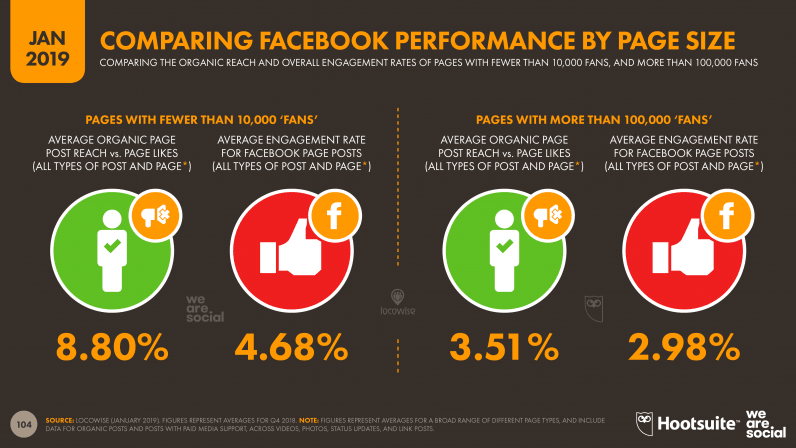
For example, there are some clear differences when we compare results for pages with fewer than 10,000 ‘fans’ to pages with more than 100,000 fans:
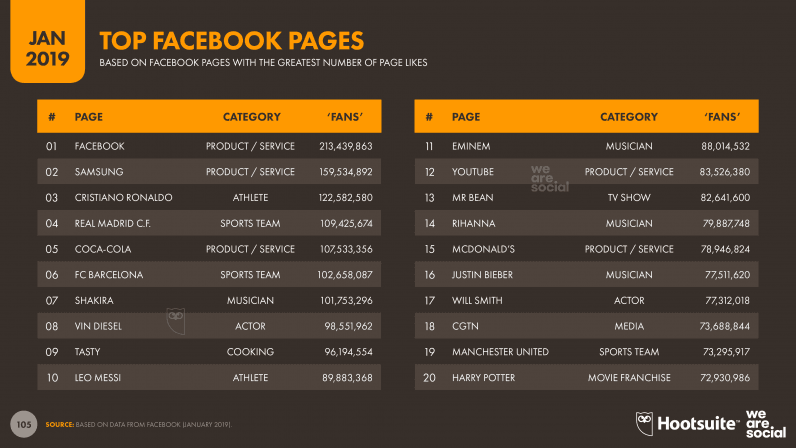
Talking of large Facebook pages, Facebook’s own page is the most-liked property on the platform in January 2019, with more than 200 million ‘fans’. Samsung takes second spot globally, with the Korean brand’s fan page amassing almost 160 million fans by the time of publication.
Just three consumer brands make it into the ranking of the top 20 Facebook pages though: Samsung, Coca-Cola, and McDonald’s. The rest of the list is dominated by musicians, sports teams and players, and actors. This should make for interesting reading for marketers, who need to see their activities and content in the context of the broader Facebook ‘experience’.
People do engage with brand content too, of course, but – with more than 80 million small and medium-sized businesses publishing pages to Facebook at the time of writing – it’s increasingly difficult for brands to stand out, especially as the amount of time people spend on the platform decreases.
The key takeaway here is hiding in plain sight: people engage with the things that they’re most interested in. That might sound like a glib statement of the obvious, but marketers must recognize that no amount of Facebook media investment will make their content more interesting, or more engaging.
The low-down: if you want to succeed with Facebook marketing, you need to give people more of what they want, and less of your brand’s corporate propaganda (you’ll find more on that at the end of this article).
2. Instagram
Our conversations with marketers all over the world in recent months indicate that Instagram will be a top choice for brands in 2019, so it’s worth spending a bit of time exploring what the platform’s audience looks like. We’ll be publishing detailed Instagram insights for more than 200 territories over the coming days in our local country reports, but here are the global headlines.
Despite some leadership hurdles in 2018, Instagram posted some strong numbers over the past 12 months. Back in June, the company announced that it had passed the 1 billion ‘active accounts’ mark, and although the company later clarified that this figure did not represent unique users, the milestone was no less impressive.
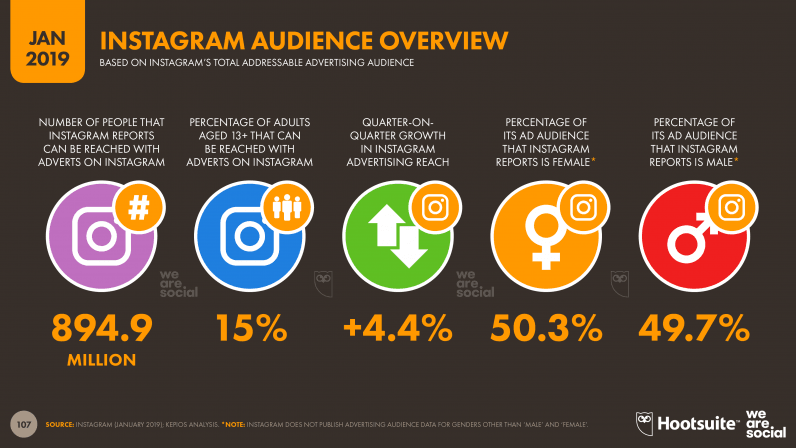
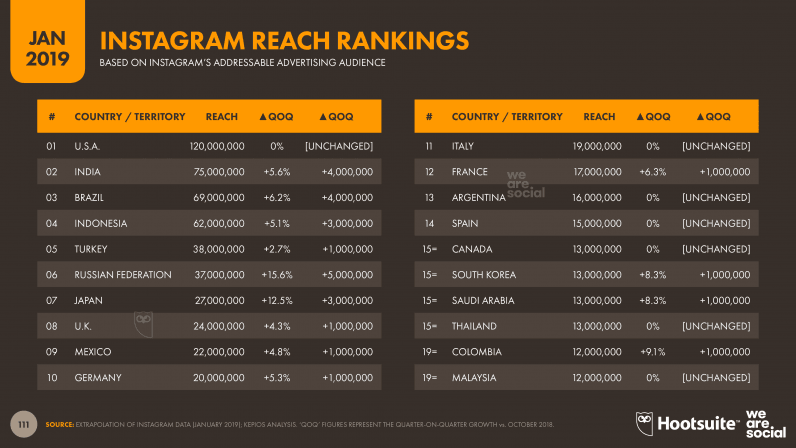
The platform’s latest advertising audience figures show that this strong performance has continued into 2019, with active users growing by more than four percent in the past 3 months to reach an advertising audience of 895 million active users around the world at the time of writing.
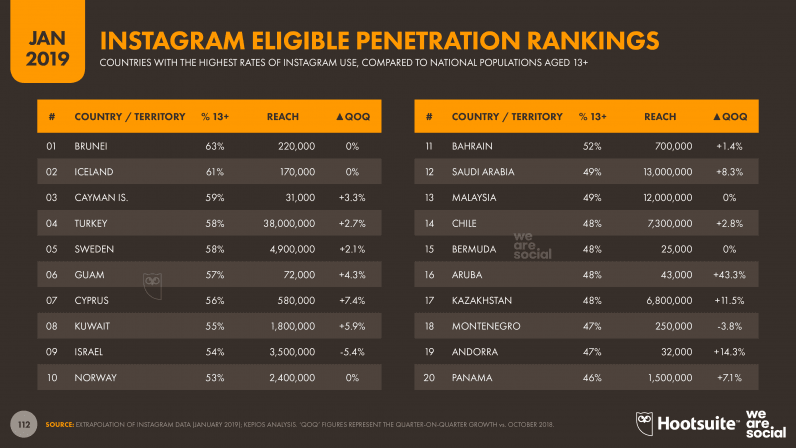
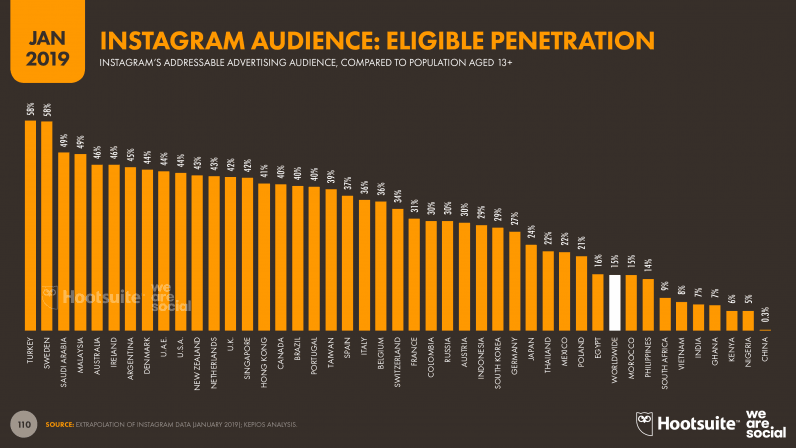
Despite regular speculation that it will be blocked in the country, Instagram remains one of the top social platforms in the country. The latest analysis from Techrasa and Niki Aghaei suggests that the platform now has more than 32 million users in Iran, which would rank it as one of twelve countries around the world where Instagram has passed 50 percent penetration of the eligible audience.
Due to ongoing international sanctions, however, these 32 million users remain beyond the reach of Instagram advertisers, so we’ve not included it in the list below.
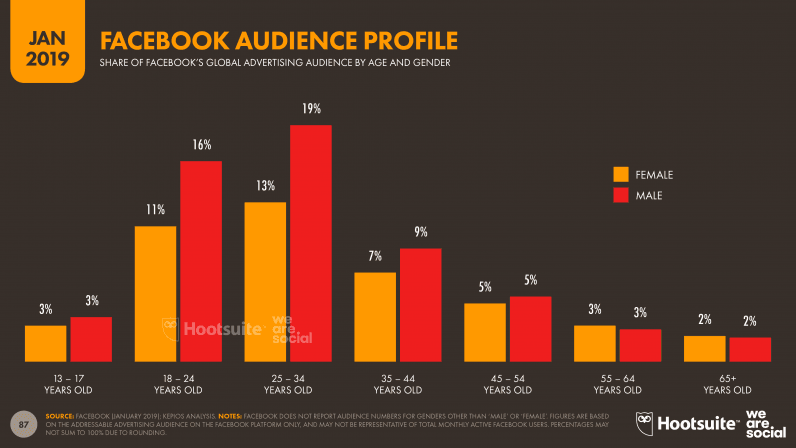
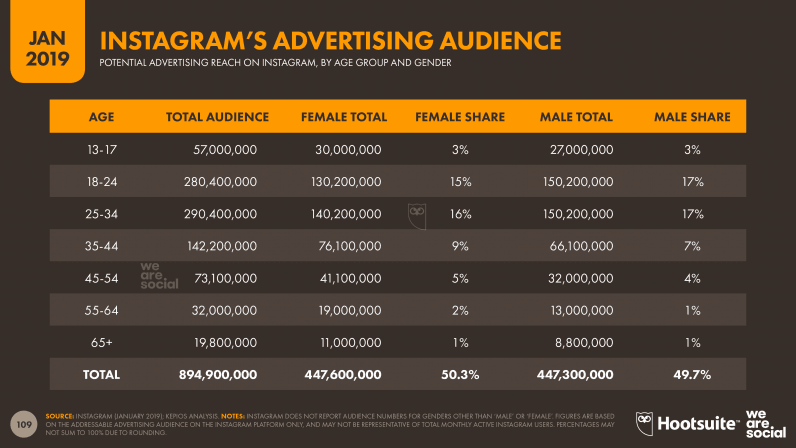
Instagram’s growing popularity among marketers isn’t just down to a growing user base, either; the platform also boasts a well-balanced audience profile. Globally, Instagram users are split roughly 50:50 between women and men, and – while the average age still skews younger than Facebook – Instagram has a higher incidence of users in the 18 to 34 year-old age bracket than Facebook does (albeit with a smaller total number of users in that age range).
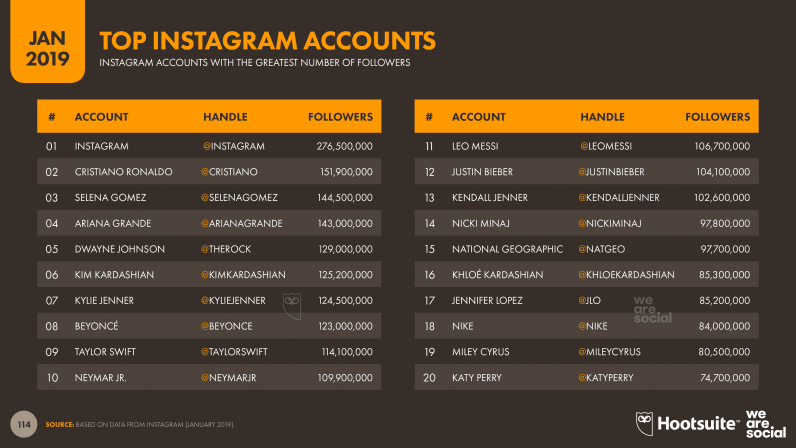
Just one consumer brand – Nike – makes Instagram’s top 20 ‘most-followed’ list, with the remaining spots dominated by celebrities. Keen-eyed readers will also notice that the Kardashian clan account for four of these top 20 accounts, so Instagram will need to be careful to avoid triggering another Snapchat-Kylie-Jenner moment.
3. Twitter
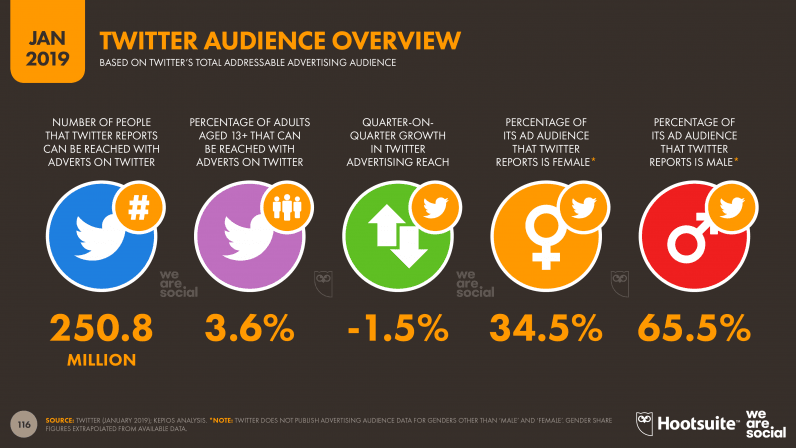
2018 was less favorable to Twitter, who reported declines in global active users in their two past earnings announcements. This downward trend is clearly visible in the platform’s advertising audience numbers too, which indicate that Twitter’s total addressable audience has fallen by 1.5 percent since October. Twitter’s advertising audience also skews significantly towards men, with the platform reporting that almost two-thirds of its addressable audience is male.
Twitter has grown to become a platform of choice for various influential figures around the world, from presidents and prime ministers, to some of the world’s top journalists. Crucially though, observers do not need to have a Twitter account to access all of the content that these people post to the platform, and this is where some broader data provide a very different story of Twitter’s success compared to its earnings announcements.
While the number of ‘registered’ users engaging with the platform appears to be falling, overall visitor traffic to Twitter.com has actually been increasing over recent months. SimilarWeb’s latest data suggest that Twitter.com attracted more than 670 million unique visitors in December 2018, reflecting month-on-month growth of more than 4 percent.
These figures suggest that total visitors to Twitter.com are considerably more than double the platform’s total addressable advertising audience. These 670 million visitors also spend an average of more than nine minutes on the site each visit, so it’s clear that they’re not simply stopping in to read one or two tweets.
Interpreting these numbers, it appears that Twitter’s primary problem isn’t necessarily the appeal of its platform, but rather its business model. Crucially, because people can access much of Twitter’s value without needing to log in, the company’s primary revenue source (ad placements targeting logged-in users) appears to be out of sync with the company’s primary asset (hundreds of millions of visitors, regardless of whether they’re logged in).
My assessment is that this makes Twitter a highly attractive target for a media company who can make better sense of the potential value residing in these non-logged-in visitors. A Twitter acquisition has been on the cards for many years now, but my perspective echoes that of Professor Scott Galloway: there’s an increasing likelihood that Twitter will be acquired in 2019.
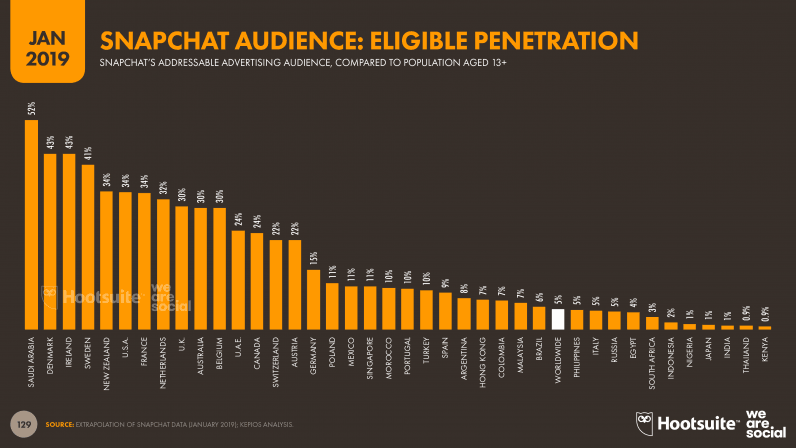
4. Snapchat
Snapchat’s latest numbers tell an even more worrying story than Twitter’s. The company’s latest earnings announcements have shown steady declines in daily active users, but the company’s advertising audience figures show some even more precipitous drops.
Snapchat’s total addressable audience sits at 306.5 million at the start of 2019, down more than 10 percent since October (note that this number is based on the figures published by Snapchat itself, in the platform’s own advertising tools).
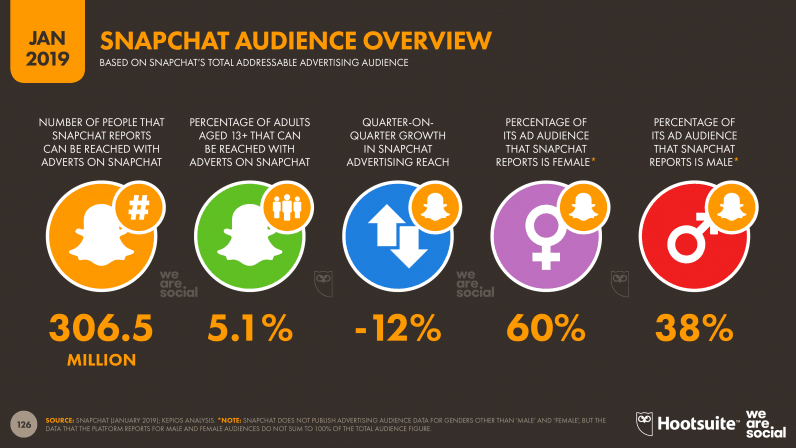
Furthermore, despite the platform’s existing female audience skew, Snapchat is losing male users faster than it’s losing women. The latest data reported in Snapchat’s advertising tools suggest that male users are down by almost 17 percent over the past 3 months, compared to a smaller drop in female users of 11 percent.
However, Snapchat remains an important part of the social mix in a number of countries around the world, and – despite losing ground in these countries too – Snapchat still boasts a sizeable share of social media users in many countries across the Middle East.
My assessment of these numbers is that what previously made Snapchat appealing may also be contributing to its present declines. The platform has consistently appeared to focus on younger users – particularly those in the 13 to 24 year-old age bracket. However, people in these age groups tend to be more fickle in their social media behaviors, and while this targeted approach may have served Snapchat well in previous years, the platform seems to be struggling to maintain its appeal amongst its core audiences.
Crucially, Instagram now boasts almost twice as many users as Snapchat in the same age bracket – and Instagram’s numbers are still growing. Furthermore, unlike Twitter, there’s little evidence in other data to hint at a remedy for Snapchat’s ails. The focused functionality of Snapchat’s platform was part of its initial success, but that focus leaves the company with fewer options now that the strategy seems to be delivering less favorable returns.
So, once again, I’ll concur with the predictions of Prof Galloway: there’s a good chance that Snapchat will rethink its prior aversion to acquisition over the coming months.
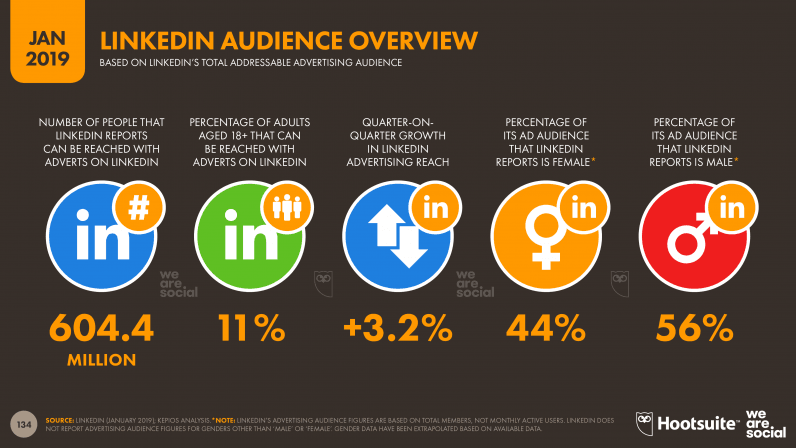
5. LinkedIn
Fortunately, we return to good news in our analysis of LinkedIn. The world’s favorite professional social network delivered strong results over the past year, with the platform’s total addressable advertising audience growing by more than 3 percent in the last quarter of 2018 alone.
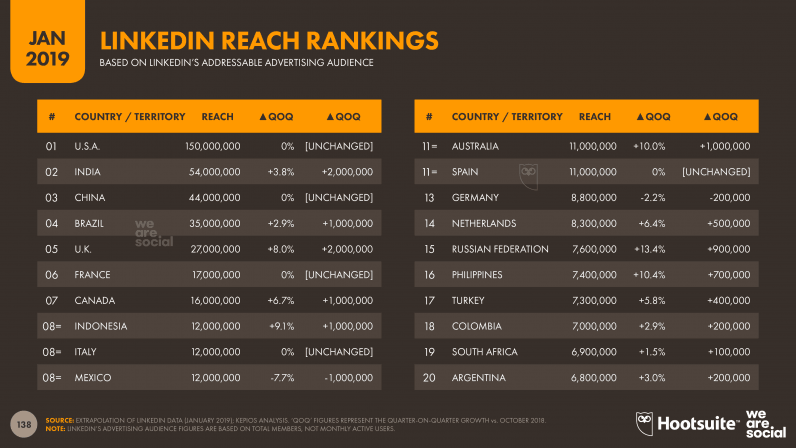
It’s important to note that LinkedIn’s advertising audience numbers are based on total registered users, and not the monthly active users reported in other platform’s tools. However, the company’s latest data show that advertisers can now reach more than 600 million users around the world on LinkedIn, which tells a compelling story for brands hoping to connect with working professionals across the globe.
LinkedIn is also growing in many developed markets, despite starting from a strong base. The company’s latest advertising data show that users grew by 14 percent in Japan in the past quarter, and by 13 percent in both South Korea and Singapore, despite the latter already ranking in LinkedIn’s top 20 countries by eligible penetration (note that we’re using adults aged 18+ for LinkedIn’s eligible audience, rather than the 13+ we’ve used for the other platforms).
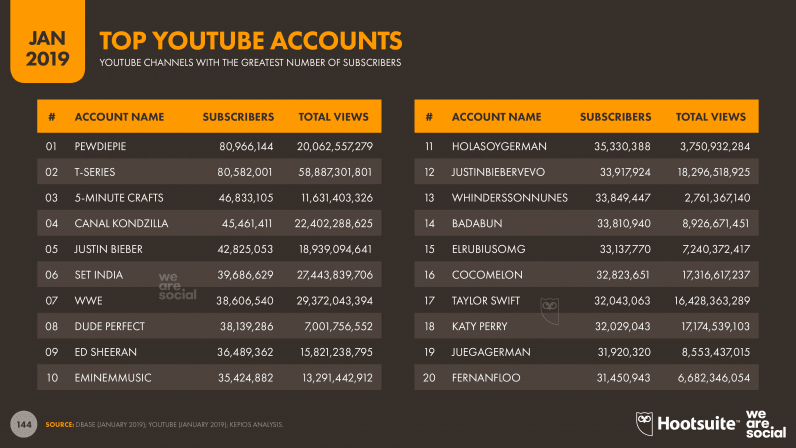
6. YouTube
The world’s favorite video platform doesn’t share in-depth insights into its advertising audiences, but this year’s reports include some other YouTube data points that marketers will find useful.
Much of this data points to the fact that music is the top draw for YouTube audiences, especially in the platform’s high-growth markets. Music-related topics accounted for half of the top 20 search queries for on YouTube during 2018, with users in Thailand searching so frequently for music-related content that the local word for ‘song’ – เพลง – appears at number 13 in the global top 20 rankings.
Movies and ‘TV content’ accounted for much of the rest of the list, but it’s worth noting that the games Fortnite and Minecraft both attracted huge volumes of interest on YouTube throughout 2018.

7. Other platforms
Unfortunately, WeChat, LINE, and VKontakte all declined our requests for more detailed insights into their worldwide audiences, so we’re unable to provide any richer insights for these platforms beyond headline user numbers. As always though, I’m hopeful that this situation may change, so if anyone from those companies is reading this and would like to share data for future reports, please get in touch.
Mobile users in 2019
The number of people around the world who use a mobile phone increased by 100 million in 2018, with the global total reaching more than 5.1 billion users by January 2019. This figure brings worldwide mobile penetration to 67 percent – more than two-thirds of the total global population.
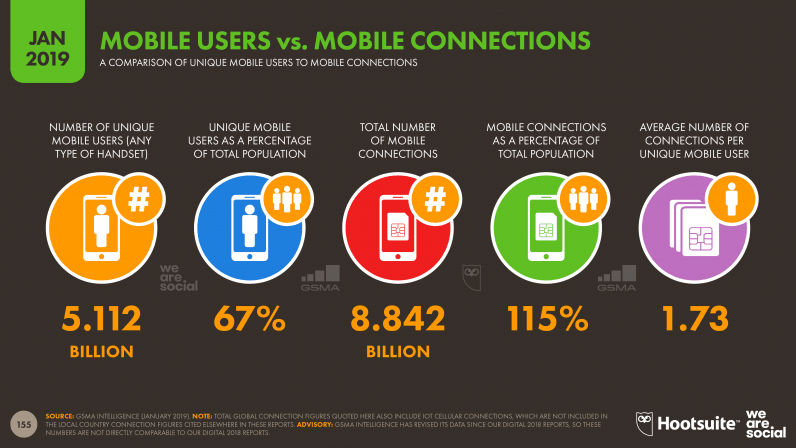
In particular, the figure for unique mobile users we’re quoting this year is lower than the number we published last year, but – based on GSMA Intelligence’s revised dataset – this year’s figure actually represents growth of 100 million new users versus January 2018.
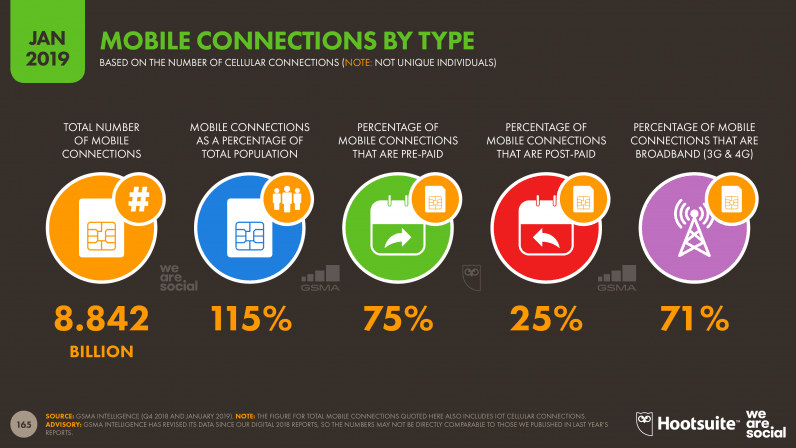
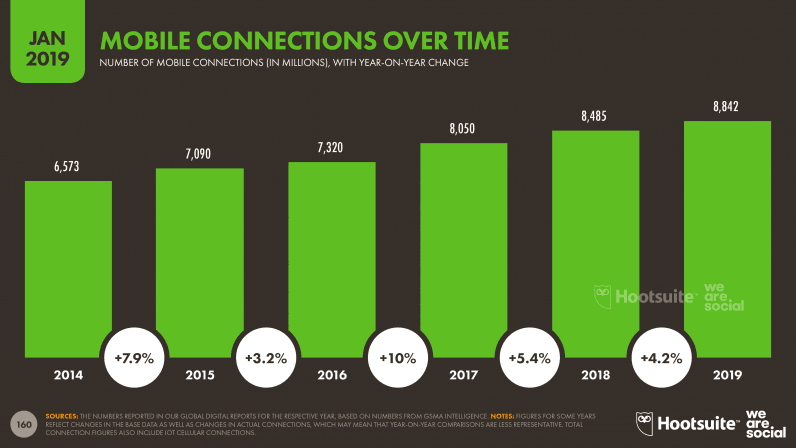
The number of mobile connections around the world has grown by more than 4 percent in the past twelve months, reaching more than 8.8 billion at the start of 2019 (note that this figure also includes IoT cellular connections). However, the typical mobile user around the world now has an average of 1.73 mobile connections, so we must be careful not to misinterpret connections as unique users.
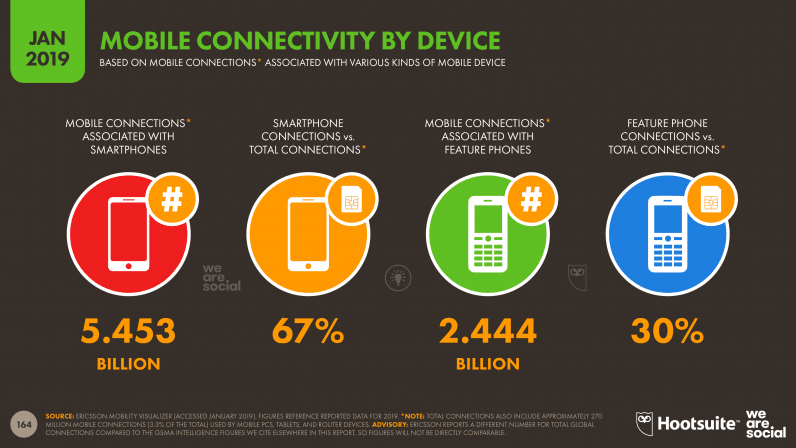
Close to 2.5 billion ‘feature phone’ handsets are still in use around the world though, while connections associated with PCs, tablets, and mobile routers have reached 270 million.
Mobile activities in 2019
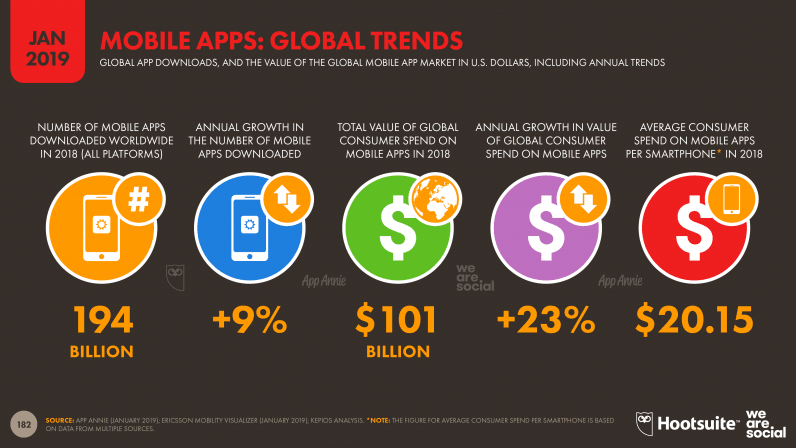
With roughly 5.5 billion smartphones in use across the world today, it’s little surprise that the mobile app market is booming. The latest data from App Annie show that app downloads increased by nine percent over the past 12 months, reaching close to 200 billion total downloads for full-year 2018.
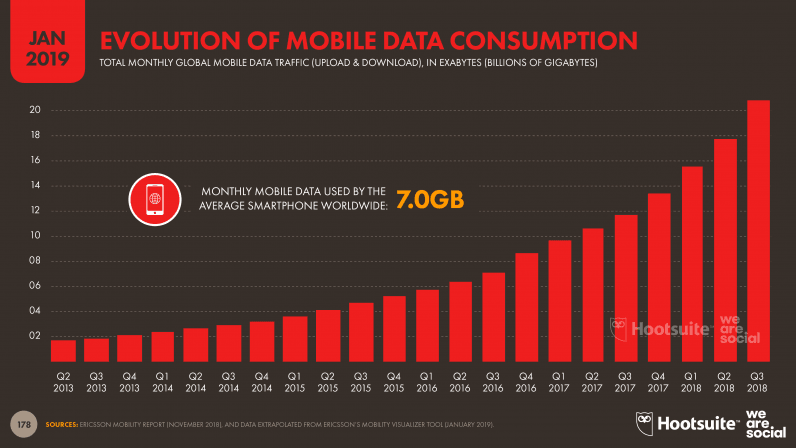
What’s more, people are spending considerably more on apps too. App Annie reports that the world’s smartphone users spent more than $100 billion USD on apps in 2018 alone. Comparing this against the number of smartphones in use around the world that Ericsson reports for 2018, this would mean that the average smartphone user now spends more than $20 USD on apps each year, and this figure is even higher in more developed economies.
Ecommerce users in 2019
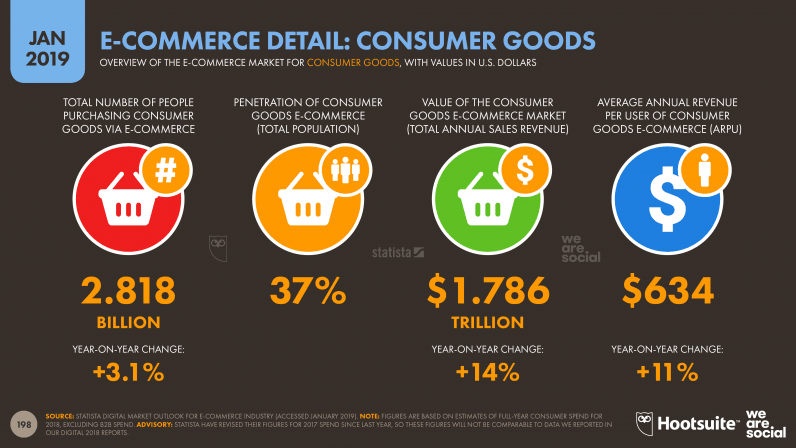
We’ll finish this year’s analysis on another high point. The latest data from Statista’s Digital Market Outlook studies show that e-commerce spend has grown by 14 percent year-on year, with the company estimating that full-year 2018 spend on consumer goods alone topped US$1.78 trillion.
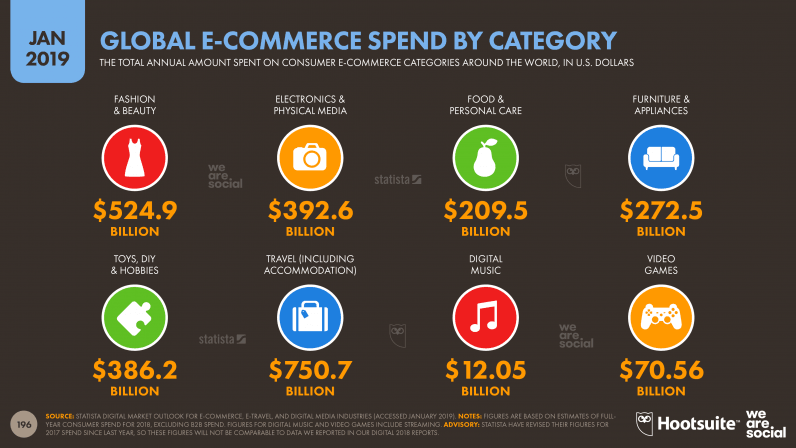
At 17 percent, ‘Fashion & Beauty’ posted the strongest growth over the past year, with annual global spend in the category now topping half a trillion US dollars. However, online travel and accommodation bookings accounted for the largest share of consumer ecommerce spending in 2018, with users around the world spending a combined $750 billion USD on online travel over the course of the full year.
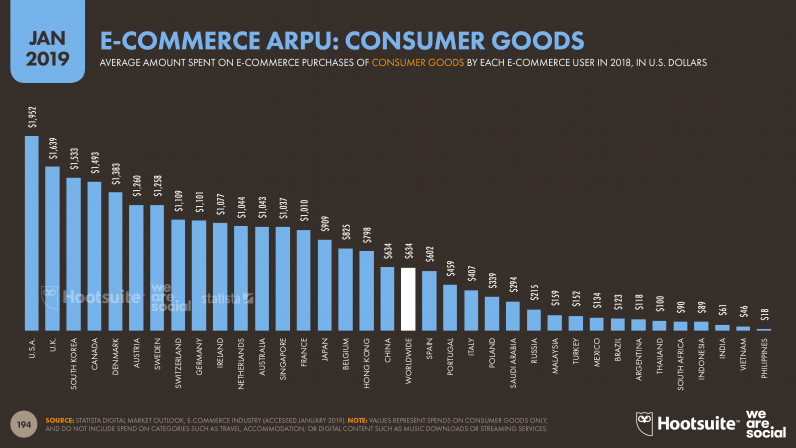
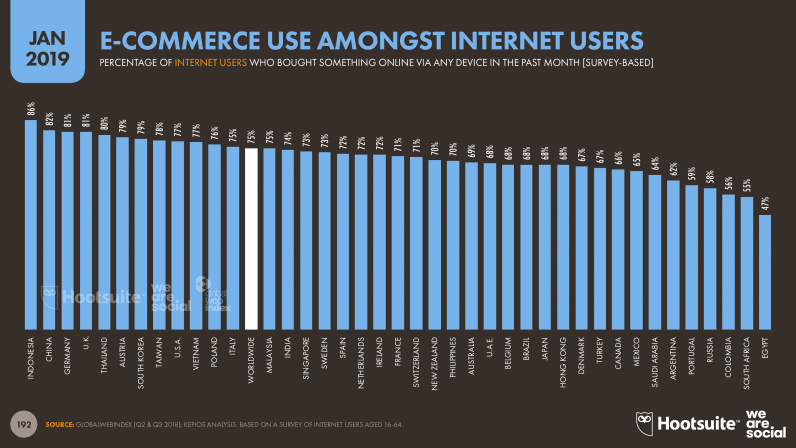
As you might expect, the figures vary considerably from one country to another, but those individual numbers make for insightful reading. It’s particularly interesting to note that – despite the strength of ecommerce in China – the country isn’t even in the top 10 in this list.
The local picture
Just before I conclude with some key forecasts for the coming year, I thought you’d like to know that the full Digital 2019 suite includes individual reports for more than 230 countries and territories around the world. To whet your appetite for those local reports, here’s a summary of the key headlines for each geography in our dataset. Don’t forget to read on below for those forecasts, though.
So… what’s next?
Hopefully that extensive (!) roundup of key data points has given you a thorough grasp of digital today, but let’s finish up by taking a look at the year ahead. But this isn’t a predictions piece; rather, it’s an extension of the trends that I’ve been seeing in this year’s data.
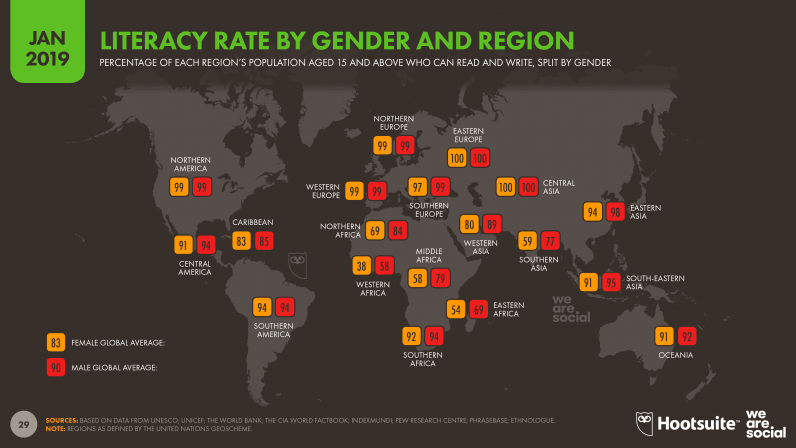
- Voice control will increase in importance: the next phase of internet growth will come almost entirely from developing markets. However, as you can see in the chart below, many of these countries suffer from lower levels of literacy compared to the countries that dominate the internet today.
As a result, global platforms like Google, Facebook, and Amazon will look for more user-friendly interfaces to serve these new users, and voice looks set to dominate these efforts, at least in the near term. For clarity though, this isn’t a story about the rise of smart speakers in Africa; rather, it’s about a complete and revolutionary change in the way people interact with connected content and devices.
- The social landscape will evolve: with some of the world’s top social platforms losing users over extended periods, it’s likely that we’ll see some attrition and consolidation in the social media industry over the coming months. If current downward trends continue, we can expect investors in both Twitter and Snapchat to increase pressure on those companies’ boards to accept an offer of acquisition.
At the same time, it feels like ‘the next big innovation’ is already overdue. However, this isn’t about the move to the ‘stories’ format, much as that will inevitably be one of the biggest stories in social media in 2019. Rather, my sense is that privacy concerns, changes in people’s social media preferences and behaviors, and broader fatigue with existing platforms will all combine to inspire a series of new social platforms in 2019, perhaps making use of new innovations like Tim Berners-Lee’s SOLID. This would fundamentally change the very fabric of business on the internet though, so expect to see plenty of resistance from the ‘Four Horsemen’. - Marketing as a service: looking behind the scenes of the brands that achieve the greatest success on the internet, it becomes apparent that many of them share something in common: they treat marketing as a service. Rather than pumping out endless corporate propaganda and trite advertising, these brands use their marketing budgets to create things of value for their audiences. Whether it’s something as simple as a valuable how-to video on YouTube, or a large scale event that puts the audience at the heart of the action, this ‘marketing as a service’ is the only antidote to ongoing media inflation and the audience shift from newsfeeds to stories.
Digging deeper
If you’d like to dig deeper into the full collection of Digital 2019 reports, you’ll find every one of them for free over on DataReportal.com, together with all of our previous reports from the past 8 years.
And if this ridiculously long post hasn’t put you off the idea of discussing these themes with me in more detail, please feel free to get in touch with me on LinkedIn or Twitter.
That’s it for this year, though; I wish you all the best for your own year of impressive digital growth in 2019, and I look forward to seeing you again, same time, same place, next year.
Get the TNW newsletter
Get the most important tech news in your inbox each week.