
Are you using the right tools for the job?
Any good mechanic has a large, well-stocked tool cabinet at their disposal, filled with the wrenches, sockets and various more specialized tools that they need for any job.
You have a tool cabinet at your disposal too, and it’s called Google Analytics.
As every good mechanic knows, you save on time, headaches and expletives by using the right tool for the right job. Some of these wind up in the bottom drawer, forgotten for no good reason.
So what are some of these neglected tools?

The 💜 of EU tech
The latest rumblings from the EU tech scene, a story from our wise ol' founder Boris, and some questionable AI art. It's free, every week, in your inbox. Sign up now!
1) Weighted Sort
It’s easy to sort your page analytics by bounce rate or by pageviews. But if you’re looking for the pages that have a high bounce rate and high pageviews, which can be ripe for further optimization, you have to use Weighted Sort.
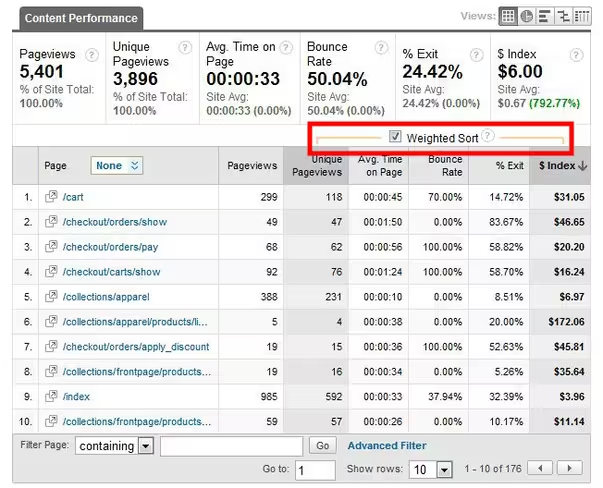
To use weighted sort, click on the bounce rate tab at the top of any table to sort. Then click the drop-down next to “Sort Type.” Choose weighted sort. You’ll instantly have better data at your fingertips.
2) Funnel Visualization
Setting up goals in Google Analytics is an important step. But that’s not all you need to do. To really get the most out of goals, you should use the Funnel Visualization report.
Funnel Visualization uses your goal pages (for example, a checkout) as key performance indicators in a sales funnel. You can indicate which pages you want to be part of the sales funnel, whether or not each step is required, and more to see at a glance where you might be losing sales.
It’s easy to set up and a powerful tool for understanding your sales process. Don’t neglect it.
3) Cost Data reports
If you’re using advertising initiatives that don’t run through Google (and if you’re not, why aren’t you?), you should be integrating that data with your Google Analytics data to get a better understanding of where there are leaks in your sales funnel. Cost Data reports let you see your third-party information quickly and easily so you can pinpoint problems.
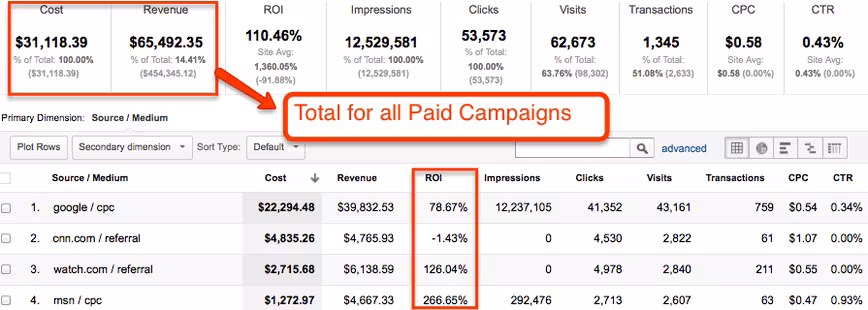
You can track social media advertising, email campaigns, paid keywords on other search engines, and more — and take advantage of Google’s powerful suite of tools to parse the data. Import key performance statistics and you’ll be better equipped to make decisions about advertising dollars.
4) Search query data
If you’re not using Google Site Search, it’s a big help — and users honestly expect you to have some form of search on your website if it’s of any reasonable size. You can see what people are searching for on your site easily, which will give you a better understanding of how to optimize.
For even more data, though, you can use Search Console to help you understand what your customers are looking for before they even get to your website. Search query data from this console lets you see the terms people are using to click through to your website, allowing you to tailor pages for them more specifically.
Don’t miss out on Google Search Console search query data.
5) Network reports
In any sort of data collection, there’s bound to be noise, and the challenge as a marketer is finding ways to limit it. Network reports can help you filter out false data and get a better understanding of your traffic.
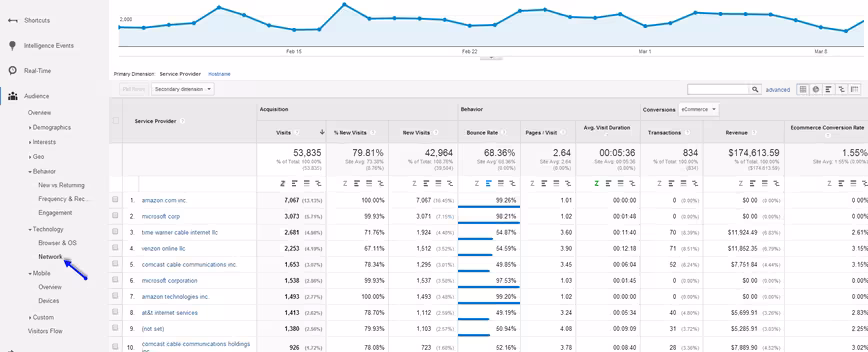
Look for super high bounce rates and you can see which ISPs are just sending bot traffic your way. You can filter these out, which can help you get a more accurate conversion rate.
You can also figure out which corporations have employees looking at your content, which is powerful data, especially if you’re in B2B. Harness the power of these reports.
6) User-ID tracking
You can’t see individual users’ names or any personal information, but tracking how often a particular user has been to your site is important.
Why?
Because of the “last-touch attribution” problem.
It often takes many touches through social, search or other channels for someone to finally convert. But Google only counts the last method as the one that caused the conversion. User-ID tracking mitigates this by letting you see how often someone has touched your website. It’s still worth taking this data with a grain of salt, but it’ll be more accurate than it was.
If you have a login system and you’re not using User-ID with Google Analytics, you’re missing out.
7) Benchmarking core changes with annotation
It’s easy to forget when you made changes to your website that can result in traffic changes. Avoid that with annotations.
From any report, make a new annotation and use it to note something that can explain any traffic changes for the future — something like “new landing page” or “started Facebook campaign L1 today.” You’ll have the context you need to clarify your data.
Make Google Analytics data work for you
It’s easy to get caught up in the day-to-day and forget about some of the better tools you have at your disposal in Google Analytics.
Don’t be.
Use these forgotten or lesser-known tools to take your analytics to the next level.
Get the TNW newsletter
Get the most important tech news in your inbox each week.