
In case you happened to miss it, there was an election held in the US yesterday. While being one of the most carefully watched in recent memory, history has been made on a number of fronts. Twitter is still sparkling today with election talk and some major issues are about to be addressed in the coming months.
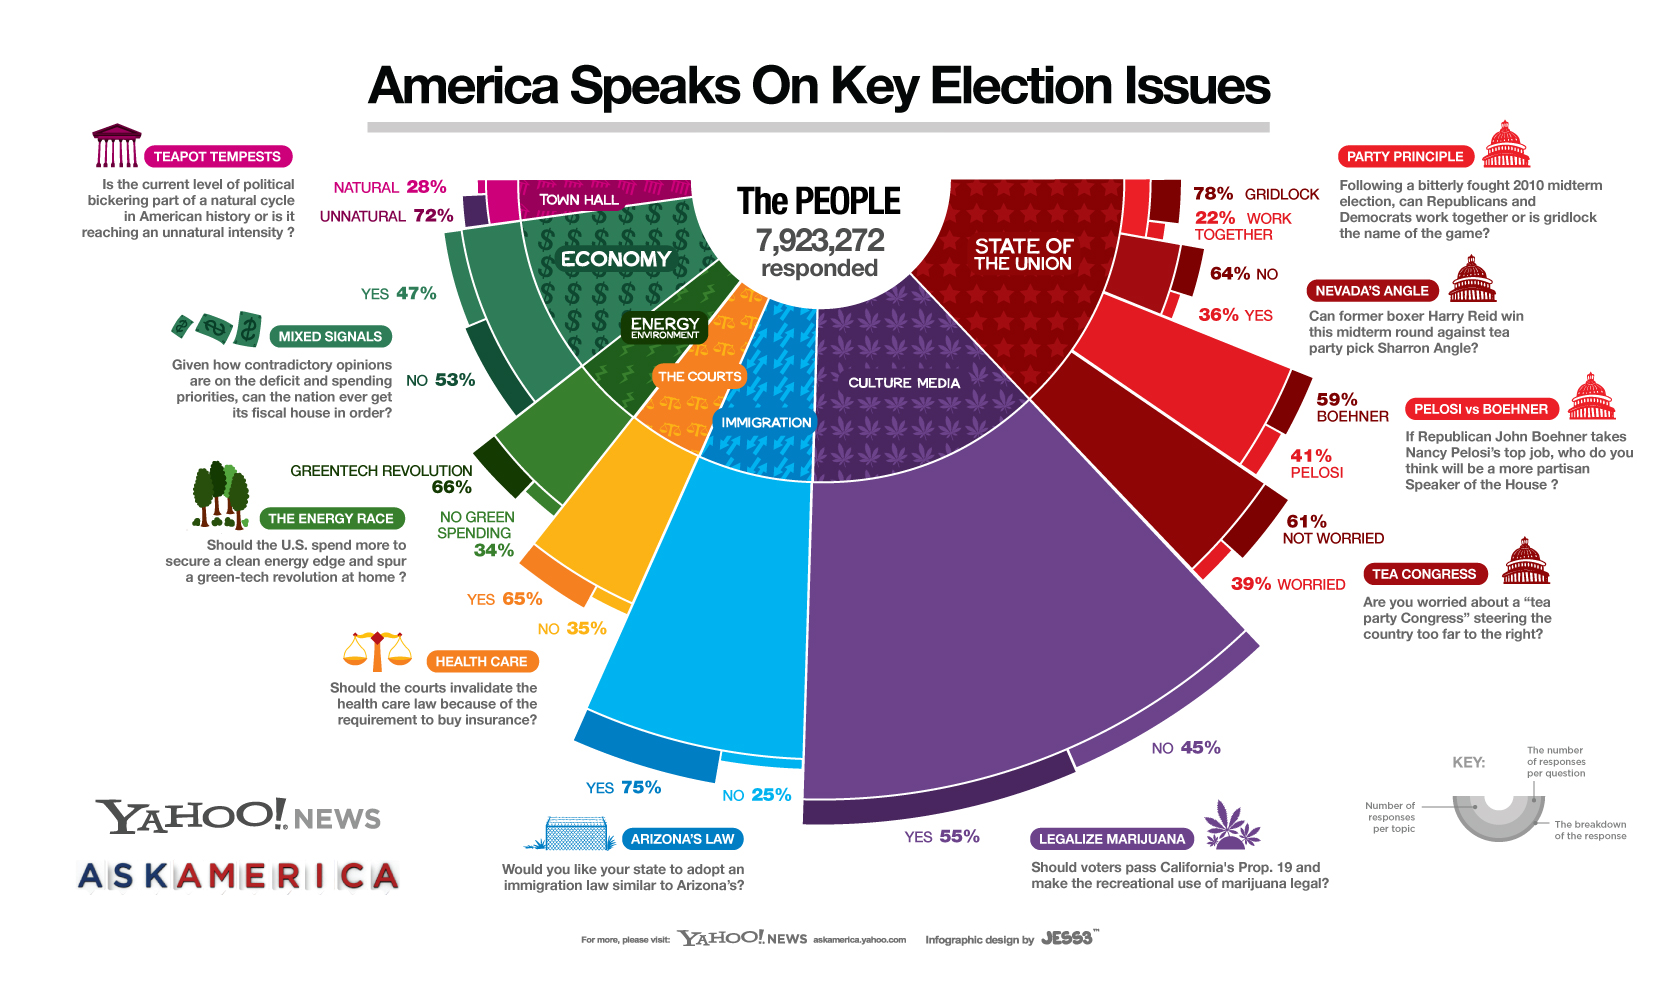
The Yahoo! Ask America project, in conjunction with JESS3, has put together another fantastic infographic for us. Visualizing the information from 7.9 million respondents to 10 different questions, we get a pretty interesting insight as to what’s important to voters, as well as somewhat of an explanation about why certain members got elected yesterday.
Click through for full size:
A huge thanks goes out to Yahoo! and of course our friends at JESS3. It’s been a unique perspective that we’ve been offered this election year into the hearts, minds and concerns of Americans here on TNW US.
Get the TNW newsletter
Get the most important tech news in your inbox each week.