
By now, you’ve heard a great deal about social media engagement.
You know that it’s not all about getting a big following.
You know it’s about getting a big following of the right people.
You know that building an awesome, engaged community around your brand, product, or idea is key to tapping into existing markets—and creating new ones! And you know that social media is a great place to maintain relationships with your customers long after they’ve decided to pay you.
But how does that happen?
Or maybe a better way of putting that is, “How do I know it’s happening?”
A great place to start is by setting up some simple social media engagement metrics to track. Let’s look through a few key performance indicators that can help you stay on course to growing an engaged following.
7 social media engagement metrics for tracking your following
I’ve grouped these together into two bigger buckets. The first deals with the followers themselves. The second deals with interactions between you and your followers. Here’s what we’ll cover:
Audience size
Audience engagement
Heads-up: if you’re using Buffer for Business, you’re in for a treat! For many of these metrics, I’ll give you a quick look at how to use some of the advanced features to track your engagement over time.
Let’s dive in!
First, let’s look at audience size.
Social media analytics for tracking engagement
Let’s start with ways to measure how many people you’re engaging with. We’ll look at ways to track and grow the quality of that engagement afterward. This is where we take a look at how many people are listening to you.
1. Audience growth rate
This is an obvious one to keep an eye on, as you probably want your following to trend upward. ?
Why is this important?
It may be true that 1,000 true fans are more valuable than 100 million spectators when it comes to an online presence. When it comes to social media, size isn’t everything.
But it’s still important. After all, if 1,000 true fans are valuable, then 1,001 true fans would be even more valuable, right? =)
This is why you want to track how your audience is growing over time.
How do you track your follower count on social media?
The cool thing about this metric is that it relies on the easiest number to find on social media—no matter the platform. You can easily see how many followers (or Likes, if you’re running a Facebook page) you have.
How we track social media audience size
Unless you have an eidetic memory, you’ll probably need some way to tell how that number is changing over time.
There are a few ways to do this. One is to manually fetch those numbers at the same time every month (or week, or day!), plug ‘em into a spreadsheet, and watch the tally grow over time.
You could also use a tool that keeps track of this for you! There are a great deal of tools out there that can track your follower count over time.
(You guessed it—we’re one of them! You can track the growth of your total follower count and see how many new followers you gained on multiple social media accounts.)
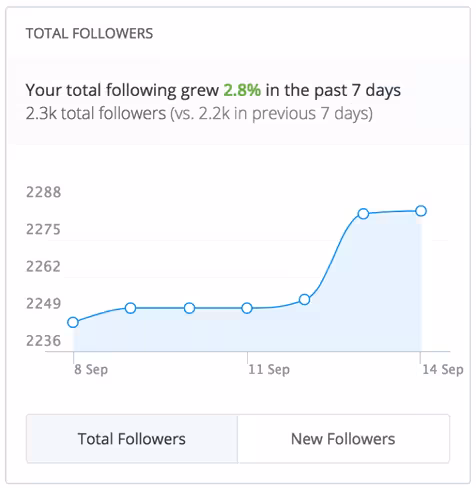
Hmm . . . see that button on the bottom right? Let’s talk about that, too. There’s another size metric you’ll want to track across your social media accounts:
2. New follower count
Whereas the last metric looks at the percentage of change in your following, this one looks at the actual amount of new followers you gain.
Why it’s important
It’s helpful to have some actual numbers in mind alongside your growth rate, just for context.
For example, a 30 percent raise sounds super generous at first. But if you’re working for free? Well, that’s just not as generous, is it? Your growth rates are best kept in context of your actual growth.
How we track new followers
This is another metric that your could track manually, but it’s probably more rewarding to track it through an app and save yourself some time doing the math. =)
Again, there are several apps that can do this for you—ours shows you this number in the same dashboard as your growth rate:
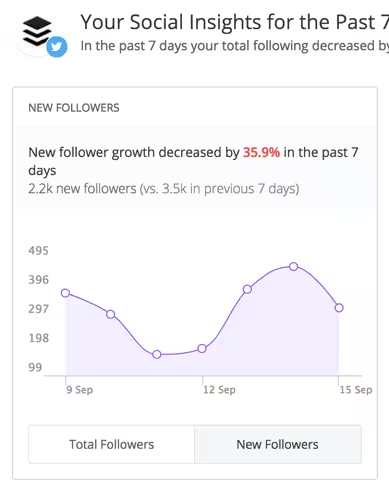
(Looks like we didn’t gain as many new followers last week as we did before!)
3. Follower/following ratio
This is another metric you hear a great deal about in social media. It’s a ratio dividing the number of people who follow you by the number of people you’re following.
Why is it important?
To some, this is one of the key metrics of thought leadership. The gist: if 4,000 people are following you, but you’re only following 400, then you’re providing material that makes people want to follow you (even if you’re not following them back).
Conversely, if you’re following 4,000 people, but only 400 are following you, then it can send the signal that there aren’t as many people interested in what you have to say. (An aside for those of you who are brand new to social media:you don’t have to be conscious of the follower/following ratio right off the bat.)
How to track your follower/following ratio
Again, this is one of those metrics that’s easy to pull manually on most social media platforms (where it’s applicable). Tracking it over time? You can do this manually, too: but it may be a simpler to use a tool for this. =)
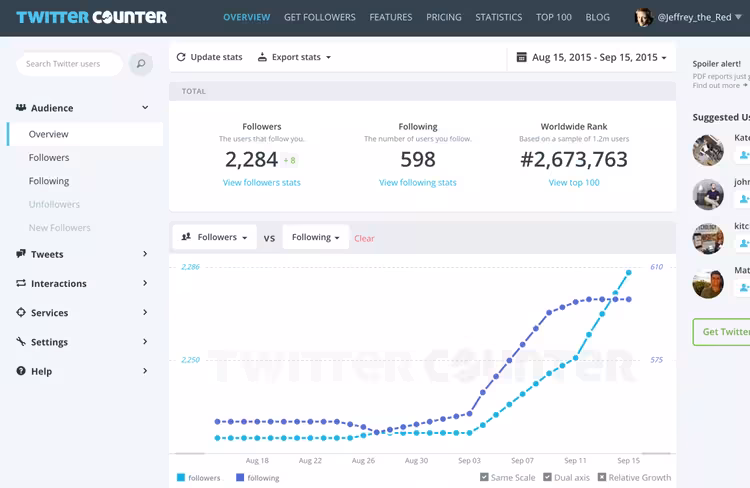
One tool that visualizes this breakdown for you (albeit limited to Twitter) is TwitterCounter. You can see how your followers and following counts are trending for as much as the past month for free, and a premium plan gives you access to greater time ranges (and analytics). Here’s a peek at what that looks like.
These are some of the metrics you’ll want to keep in mind as you keep nurturing a following. Now that we’ve covered some audience size metrics, let’s look a little more closely at the engagement happening within the social media channels themselves.
Social media analytics for tracking engagement
We’ve looked at ways to measure the quantity of your audience. Now let’s start digging into ways to measure the quality of your audience’s engagement.
4. Likes per post
I’m using “Likes” here as a catch-all for Likes, favorites, +1’s . . . all the ways people can “upvote” posts they enjoy (without creating something of their own in response—we’ll cover that soon).
This metric involves tallying all the ways people have affirmed your post over a given amount of time, and then dividing that number by the amount of posts you published over that time.
Why it’s important
You want to nurture an engaged community, so it helps to look at which posts are getting that thumbs-up from your followers. Watching this metric helps you keep track of how your average post is resonating with these folks.
If your followers are getting more engaged (and if you’re continuing to tailor your content to your audience), you’ll see this metric go up over time!
How we track likes per post
While we’ve covered some metrics that you can track manually, this is one you will probably want a little help on. Here’s how we keep track of this metric at Buffer with our Business Plan:
From the Buffer dashboard, go to the “Analytics” tab. Then hit “Activity”
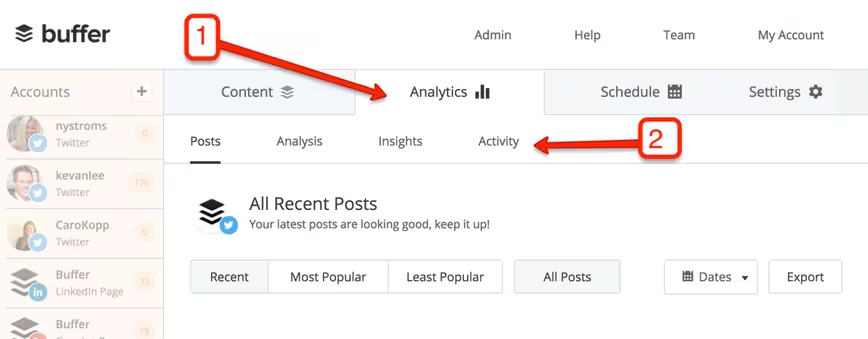
This is where the Buffer app automatically keeps track of your affirmations per post. Here’s a look at how we’re doing this month on Twitter:
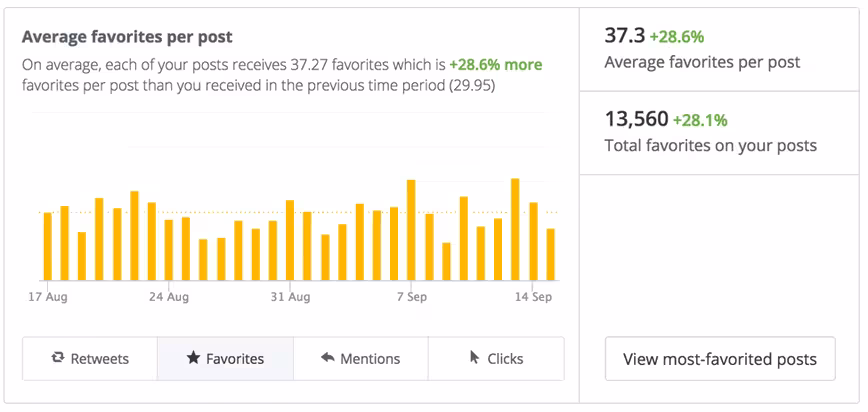
How to get more likes and favorites per post
Now, let’s say you’re laser-focused on growing your affirmations/post metric this month. What can you do to drive this up?
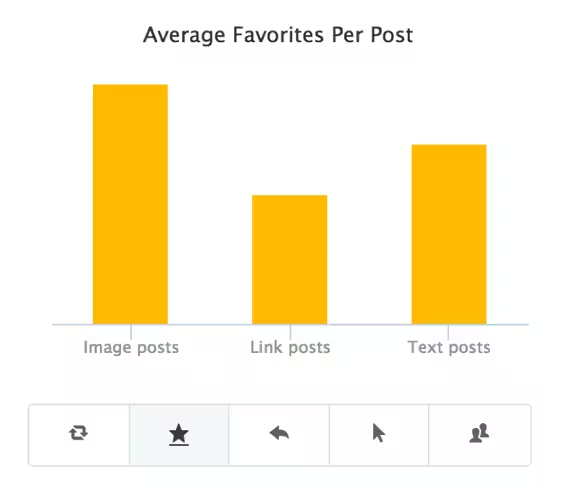
One way is to examine the posts that got the most favorites, and then produce more posts like it. (You can do this in Buffer for Business, too!) In our case, it looks like posts with images are generating the most Favorites. If we’re focused on growing our Favorite/post ratio, one way we might immediately see some growth is by posting more tweets with images.
5. Shares per post
This is super similar to the affirmations/post metric: you want to see how many times the average post is shared over a given amount of time.
For this post, I’m using “shares” as a catch-all for “Retweets,” “Repins,” and of course “Shares.”
Why it’s important
While tracking affirmations gives you some idea of which content is immediately resonating with your audience, looking at shares tells us which pieces of content your audience found especially spread-worthy.
When your affirmation/post ratio is climbing, you know that more people in your audience are approving of your posts. People “Like,” well, things they like! But you’ve seen people share posts with a much broader range of emotions. Some shares are all positive: “My feelings exactly!” Some aren’t so positive.
That’s one reason it’s good to keep an eye on your share/post ratio alongside your affirmation/post ratio. Likes and Favorites indicate that people like your posts. Shares indicate that people want to talk about your posts.
How to track this in Buffer
If you’re using the Buffer for Business Plan, you can track this, too! It’s in the same Analytics zone as where we tracked affirmations/post. Here’s how we’re doing on our Facebook page this month:
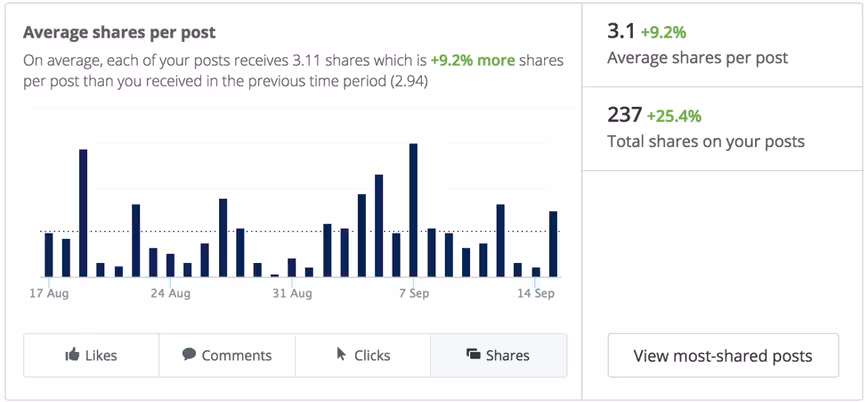
Huzzah! Looks like we’re getting about 9.2 percent more shares per post than we were last month.
How to increase shares per post
Now, if we wanted to focus on growing our shares per post up from that average of 3.1, we would need to look at which posts our Facebook fans deem most sharable.
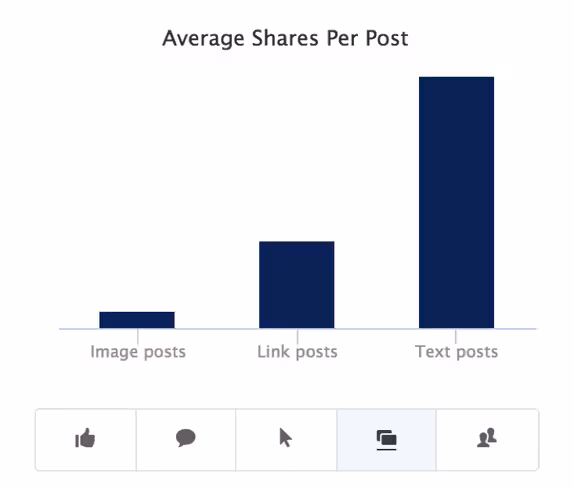
In our case this month, it looks like text-only posts are the way to go.
6. Comments per post
In addition to watching your posts get liked and shared, you can track how many conversations your posts are sparking between you and your social media following.
It’s the same old ratio framework, but this time taking into account “comments,” which I’m using as a catch-all for mentions and comments.
Why it’s important
The metrics we’ve covered thus far are focused more on how your content is received and spread. But if you’re measuring your social media engagement, with the goal of nurturing a strong community around your brand, it’s good to take a look at the conversations your content is bringing about between your and your followers—and between your followers themselves!
Comments can build a sense of community, which can make your social media channels look even more appealing to those who are encountering you for the first time!
How to track this in Buffer
Once again, to the Analytics! The Buffer Business Plan lets you examine just how many comments or mentions you’re pulling in per post. Here’s how we’re doing on Twitter this month:
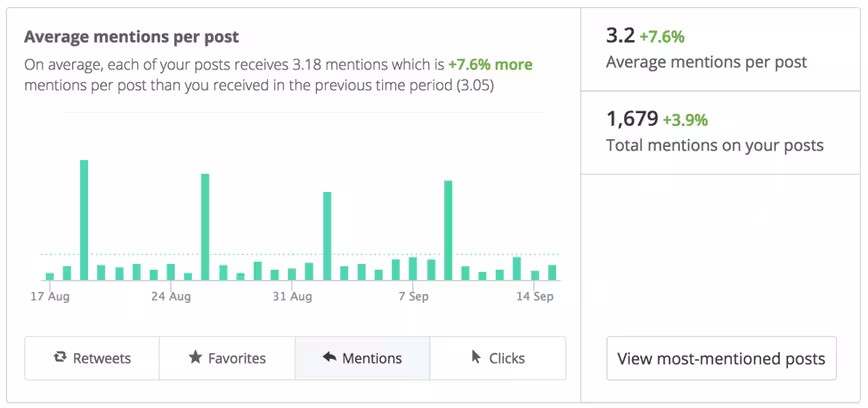
Looks like we’re getting about 3.2 mentions for every tweet.
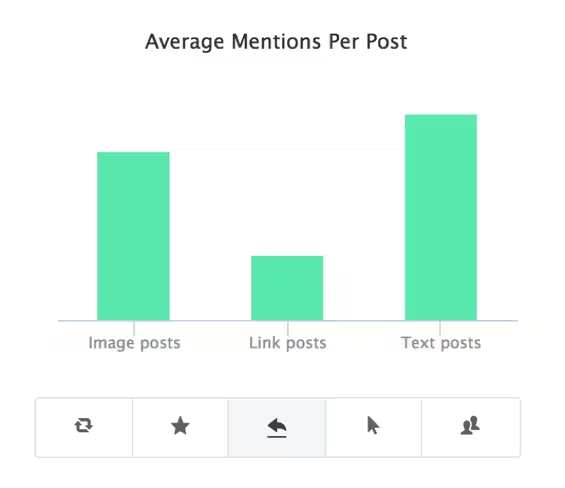
How to get more comments per post
If we wanted to drive that metric up, we’d want to look at which kinds of posts are pulling in the most mentions. In our case, it looks like text posts are the way to go.
7. Clicks per post
We’ve looked at a lot of metrics that can give us some visibility into how our audience receives our content on social media itself. But are we drawing people beyond the social space? To know this, we’ll need to start examining clicks per post.
You’ll get this metric by measuring the amount of times people have clicked the links you post to social media over a given period of time, and then divide that number by the amount of posts you published in that same time period.
Why it’s important
This is where we start edging toward the more traditional ROI metrics. We’ve been looking at ways to measure how our social media content is resonating and resounding with your audience, but it’s also important to tie that engagement back to your website.
This metric is so important for a few reasons:
- It’s a good way to gauge how aligned your social content is with your off-social content. Your social posts may get a great deal of attention, likes, shares, RePins, etc.—but ideally, that engagement will carry over to some of your non-social properties, too. When people click through the links on your content, they’re not just saying, “I like this.” They’re saying, “I want more.”
- Measuring clicks per post also helps you estimate incoming traffic from your social media efforts. For example, let’s say your website currently gets about 500 visits a week from your own social media accounts—but you’d really like to be pulling in 700 visits a week from that channel. Without using metrics, solving this problem would take some guesswork. But if you know that every post gets an average of 20 clicks, then you could try publishing another 10 posts every week to get those 200 extra visits you’re reaching for.
How we track clicks per social media post
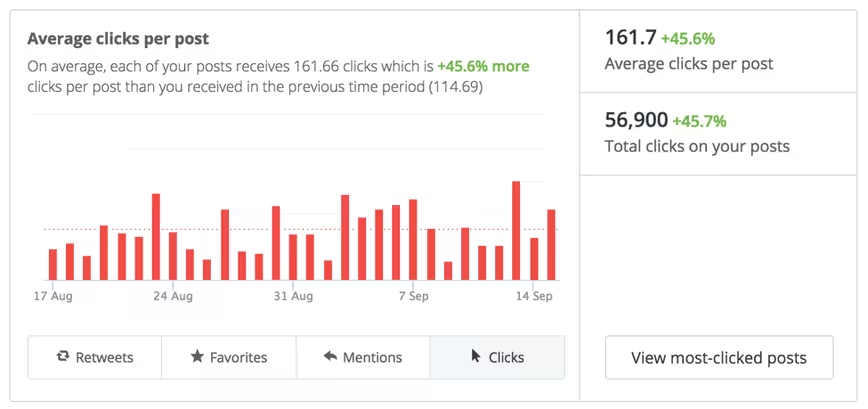
Just like the other engagement metrics we’ve discussed, you can view all this in Buffer for Business’ Analytics tab.
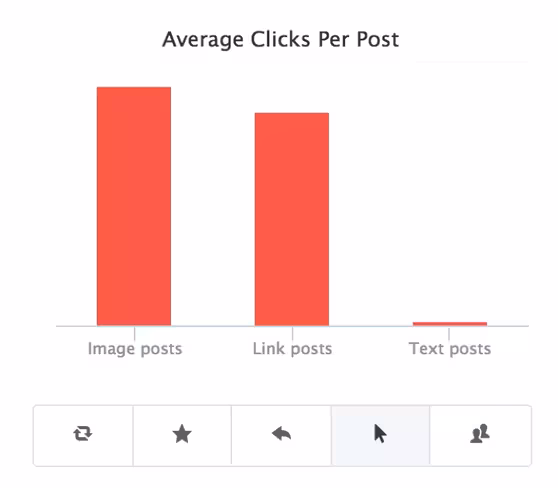
For example, here’s how we’re doing on Twitter this month:
How to increase clicks per social media post
Let’s say the Buffer team really wanted to get more clicks per tweet. One way we could do this is by looking at the kinds of tweets that get the most clicks. For this month, it’s tweets with images. Of course, the text-only tweets won’t have any clicks at all . . . there’s nothing to click!
We could then dive into those high-performing tweets to see more of the particulars of what’s working, then experiment with posting similar content.
How do engagement metrics help my business, though?
Some of this may feel a little “fluffy.” The more conventional approach to social media analytics is to focus on the ROI per channel. Metrics questions tend to focus on bottom-line conversions—questions like:
- How much did Facebook generate in sales this month?
- How many accounts did we gain from Twitter last year?
- How many leads did LinkedIn pull in on that campaign?
There’s nothing wrong with questions like these. They’re super important. They can help you make better business decisions. But that doesn’t mean they’re the only questions to consider when you’re doing analytics for your social media accounts.
It’s good to measure the direct ROI of your social following. But it helps to keep an eye on the quality of that following, too. If you can track and nurture a highly-engaged social media community using these metrics, you’ll enjoy some pretty nifty perks:
- You’ll have a better way to get (friendly!) customer feedback. Growing an engaged social media base can give you a forum for asking your users questions. It’s like having 24-hour brainstorming / beta testing / proof-of-concepting squad on call!
- You’ll have a long-term marketing asset. An engaged social following can help you get the word out about new products and promotions. One of my favorite examples of this concept is the graphic novelist and video game designer Doug TenNapel, whose niche, hyper-loyal social following has backed his Kickstarter projects again and again.
- More engagement = more money. I saved the most obvious for last. ? An engaged, loyal, enthusiastic community of product evangelists is going to out-buy a tepid pool of followers.
To build a profitable social following in the long-term, you need to start nurturing that following now.
And social media analytics can help you get there
It’s a lot easier to strive for something if you can measure your progress in getting there. So if you want to grow a more engaged social media audience, you’ll want to find some metrics (like the ones listed above) to track your progress.
Over to you
I’m super curious: what social metrics do you track? I bet some of you are tracking some awesomely sophisticated metrics! I’m considering a follow-up post featuring some really creative metrics to recommend to advanced social media managers—I would love to hear some of your metric ideas in the comments!
Read Next: 61 key social media metrics, defined
Image credit: Shutterstock
This post first appeared on Buffer.
Get the TNW newsletter
Get the most important tech news in your inbox each week.