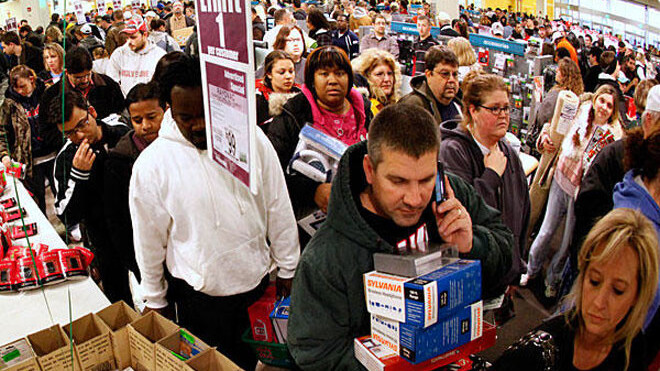
I consider myself among the grinch-like few who would rather spend Black Friday indoors complaining about how crazy Black Friday is without ever actually taking part in it. There is just absolutely no way I can convince myself to be trampled by overeager and money-saving obsessed coupon-clippers when I can instead shop online, safe and out of the sharp-elbowed reach of pushy sale-shoppers.
Finance-related alliterations aside, Black Friday is easily one of the heaviest foot-traffic days of the year for popular retailers. This American event is so popular, in fact, that Mint, a company that enables users to better manage their money, has already pooled together the spending habit data of all of its users from last year’s (2010) Black Friday rush.
 With clothing and electronics easily dominating the charts for the most-purchased items of the year, Mint took to breaking down the spending habits of these categories into specific cities, revealing which areas of the US tend to splurge the most.
The results
For those of you living in New York, are you more proud or disappointed to hear that your state spends the most both in clothing and electronics during the holiday? According to Mint’s findings, the average Black Friday shopper in New York spends $256 USD on clothing, and $324 USD on electronics. Phew!
California takes an easy second place with $232 USD at most spent in San Francisco for clothing, and $306 USD spent on electronics in San Jose. This doesn’t surprise me, of course. Nearly all of my friends and family are unreachable at the moment due to navigating the crowds during this very-cheap sale season. But where do the other states stand?
Check out more of the findings in the info graphic below.
Get the TNW newsletter
Get the most important tech news in your inbox each week.


