
David Arnoux is Head of Growth at Twoodo building the future of teamwork. He’s also a Growth Evangelist at Growth Tribe. Follow him on Twitter or G+. This post first appeared on the Twoodo blog.
How do you get users to fall in love with your product on their first visit? How do you avoid losing visitors on their first visit? Short answer… you get them to the AHA moment..
There’s a lot of talk and literature about finding the AHA moment. James Currier from Ooga Labs (10 years, 10 companies with at least 10 million users each) and a personal hero of mine recommends spending 50 percent of technical resources on your onboarding or on what he calls the “first user experience”.
You’ll never have more attention from visitors than in that first visit to your website.
It’s up to you to onboard them step-by-step until they reach what has been dubbed this “AHA moment” also known as the “WOW moment”. Here are some well known examples of AHA moments. It’s only when they have reached that point that visitors will understand the value you offer, will they fall in love with you and will be able to explain your value to others.

Sounds perfect right?
The only problem is, it’s often really difficult to know what your AHA moment actually is. Sure you could rely on your assumptions and run with your gut feeling. But as a data obsessed growth hacker I’ve seen too often how our assumptions and gut feeling turned out to be wrong. In this article I’ll try to address how we did this for our team collaboration tool Twoodo. How we were able to discover our AHA moment even though we didn’t have many visitors and little hard data or metrics to rely on.
The Hard truth about Hard Data
Over the years I’ve had countless discussions with other co-founders and growth hackers about finding the AHA moment. I’ve always found that companies with large amounts of visitors and data have an easier time of finding that moment than companies who have very little to work with. If you’re a successful company with millions of daily users or tens of thousands of customers then you can tap into your hard data to find what your AHA moment is.
I would recommend hiring a rockstar data scientist, give him or her access to all your logs and ask them to run correlation analysis on each of your features to determine which website events will most highly predict an activated user or a super user.
Unfortunately that’s a luxury that some of us don’t have. So how do you find the AHA moment when you don’t have a data rocket scientist at your disposal or enough data to feed his genius with.
We did it by hand..
It doesn’t take 100,000 users to find your AHA moment. However you do need to have a few who really love you. If you’re at a point where you have 30 or more users/customers who truly love your product, come back to it at the right frequency, who you know are totally addicted, I will argue that you can find your AHA moment. Here’s how:
1. Identify the users:
At Twoodo we’re Mixpanel addicts. Mixpanel is a user-centric events based analytics tools that can give you invaluable information on what your users are doing on your website (you can also check out Kissmetrics). Basically it shows you what people are doing once they’ve arrived on your site.
Using a simple filtering query on Mixpanel’s Explore tab we were able to identify some “power users”. In this case I’m searching for all our visitors who signed up to our website, did this less than four weeks ago and who have already made at least 200 posts on Twoodo. In our experience this is a clear sign of an activated user who understands the value and is being retained by it
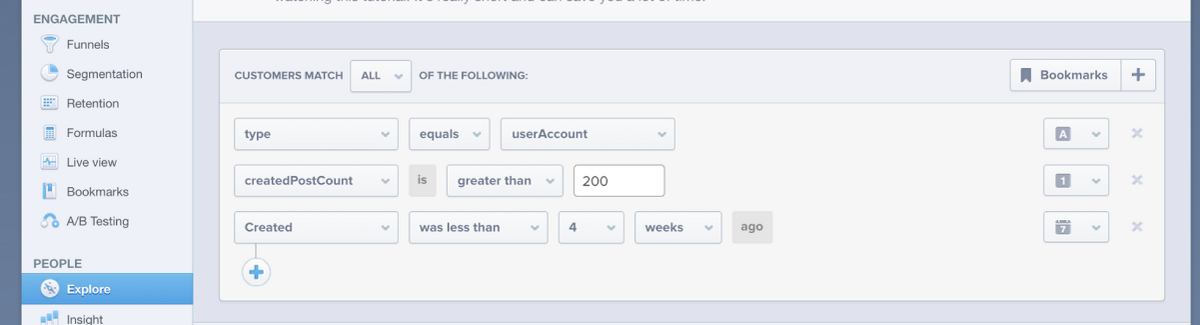
I was also careful to exclude all users who had been invited to Twoodo by a friend or colleague as their perception of our value would be positively biased.

I won’t show the results as there are some email addresses in there but the results came back with 42 profiles.
I consider these users to be “very activated” and I now want to find out if they have anything in common with their first visit.
2. Find out what’s happening on a user’s first journey
In the early days we used to do a raw dump of our logs and started analyzing these user’s first Twoodo visit step by step. This is what it looked like..it wasn’t fun.
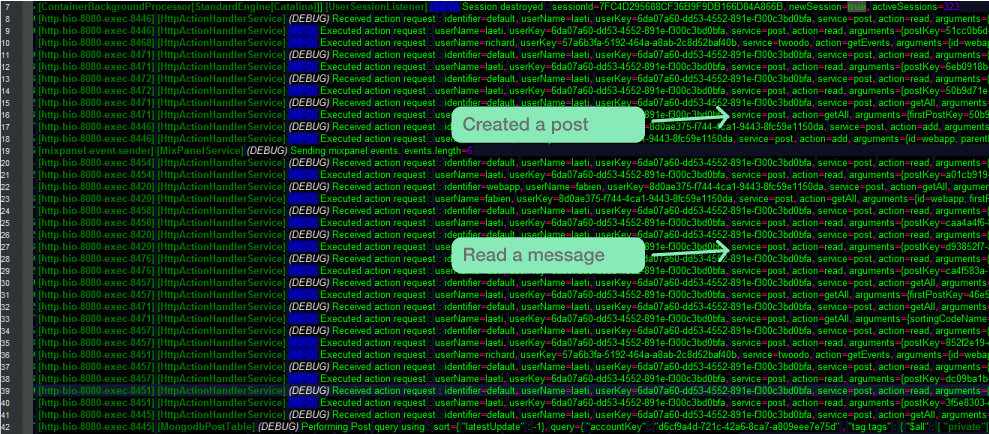
After a few days of reading these we started planning to parse the logs into excel files to make the process less painful but Mixpanel saved us from having to do that. Another problem with this method is that it only tracked server-side events and couldn’t track browser events. But the idea in both cases is the same.
Recreate a visitor’s first journey step by step.
It’s a long and painful task but if done correctly you will start to see a pattern.
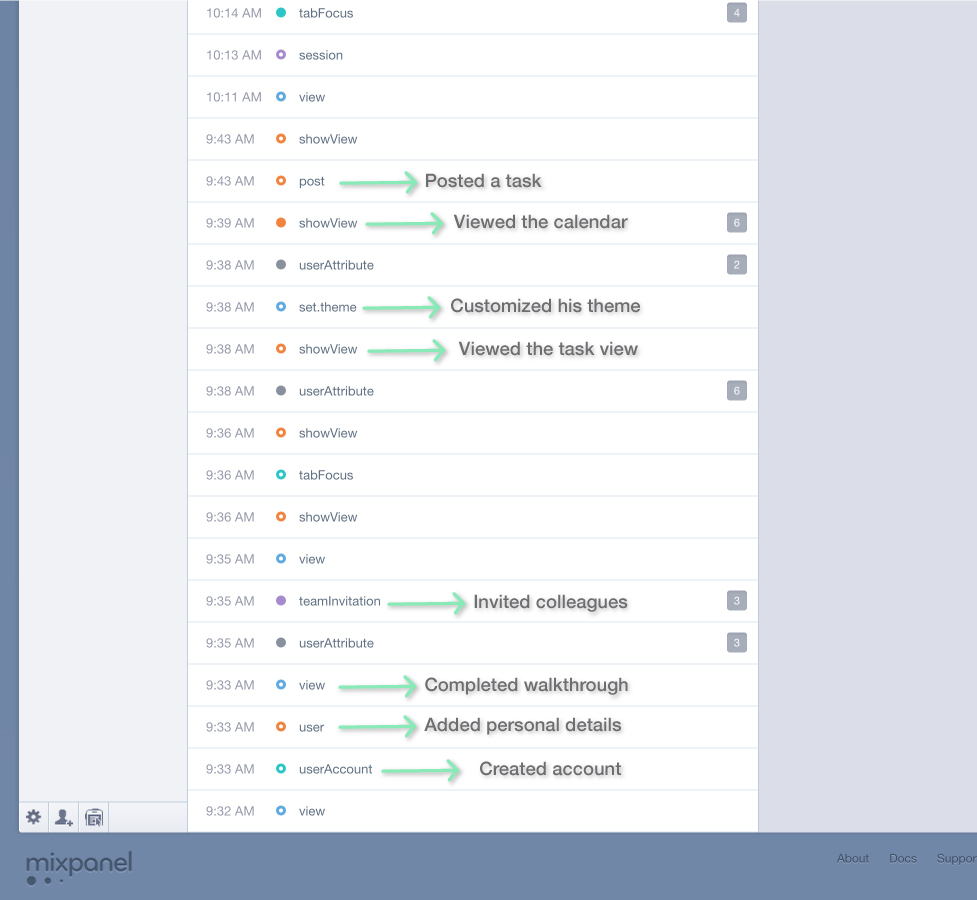
Thanks to tools like Mixpanel and Kissmetrics the visualization of these events is much clearer. The events have color codes and drop down menus with all the event characteristics. In this example you can see the intensity of usage of an activated user’s first day. This is a screenshot of the visitor flow of a new user in his first minutes and hours. By looking into each event you can understand the visitor’s first user journey.
3. Re-create the journeys
So the next step is to extract the important steps and log them somewhere. After re-creating this journey I found the following:
- He signed up from the web version (not mobile)
- He added his first and last name
- He uploaded a profile image
- He completed the walkthrough
- He created a company and uploaded a company logo
- He posted 17 messages
- Nine of these messages included a task
- He viewed the calendar view
- He viewed the task view
- He added tasks to his calendar
- He customized his theme
- He logged back in six times in three days after his 1st visit.
And there.. I have one customer activation journey of a user that got to the AHA moment!!
I then proceeded to do the same thing for the 42 other “super activated users”. I opened a google doc spreadsheet and ran all these events into dedicated columns. Each column = 1 event. Here’s what part of it looked like:

4. Run this on visitors who didn’t get the AHA moment
After running through all 42 profiles I started to find patterns on events that kept coming back up. We found seven events that almost all our super users had in common. Some of these, like customizing the theme or inviting other people on the first visit, were contrary to our assumptions. We then had a big talk which included a debate over correlation vs. causation.
This lead us to do the exact same steps but with 50 users who were not activated at all.
We searched for users who had signed up but never came back or visitors who had used us for few days never to come back again. The idea is to compare the ”super activated users” with the lost “non-activated users” and see what the main differences are.
5. Spot the difference
So what had the super users done that the “never to be seen again” visitors hadn’t?
We quickly had a precise picture of events that had been taken by activated visitors and left out by non-activated visitors.

1. They all invited at least two people on their first visit even before testing the tool (this was contrary to our assumptions).
2. They input their first and last name.
3. They uploaded a profile picture.
4. They almost all uploaded a company logo.
5. They created at least 5 tasks on their first visit.
6. They came back to the app 7 days consecutively at least.
7. They viewed the task and/or calendar view.
6. Build it into your website
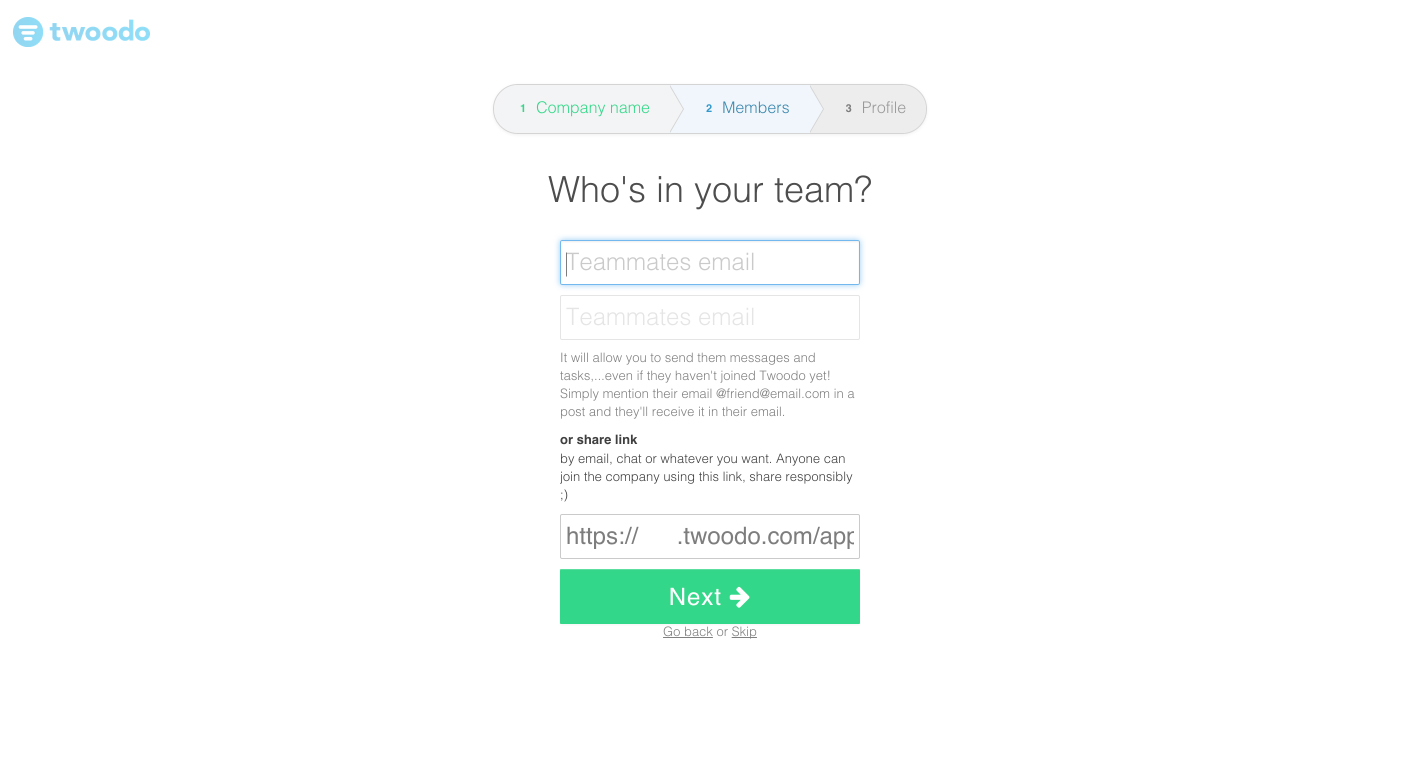
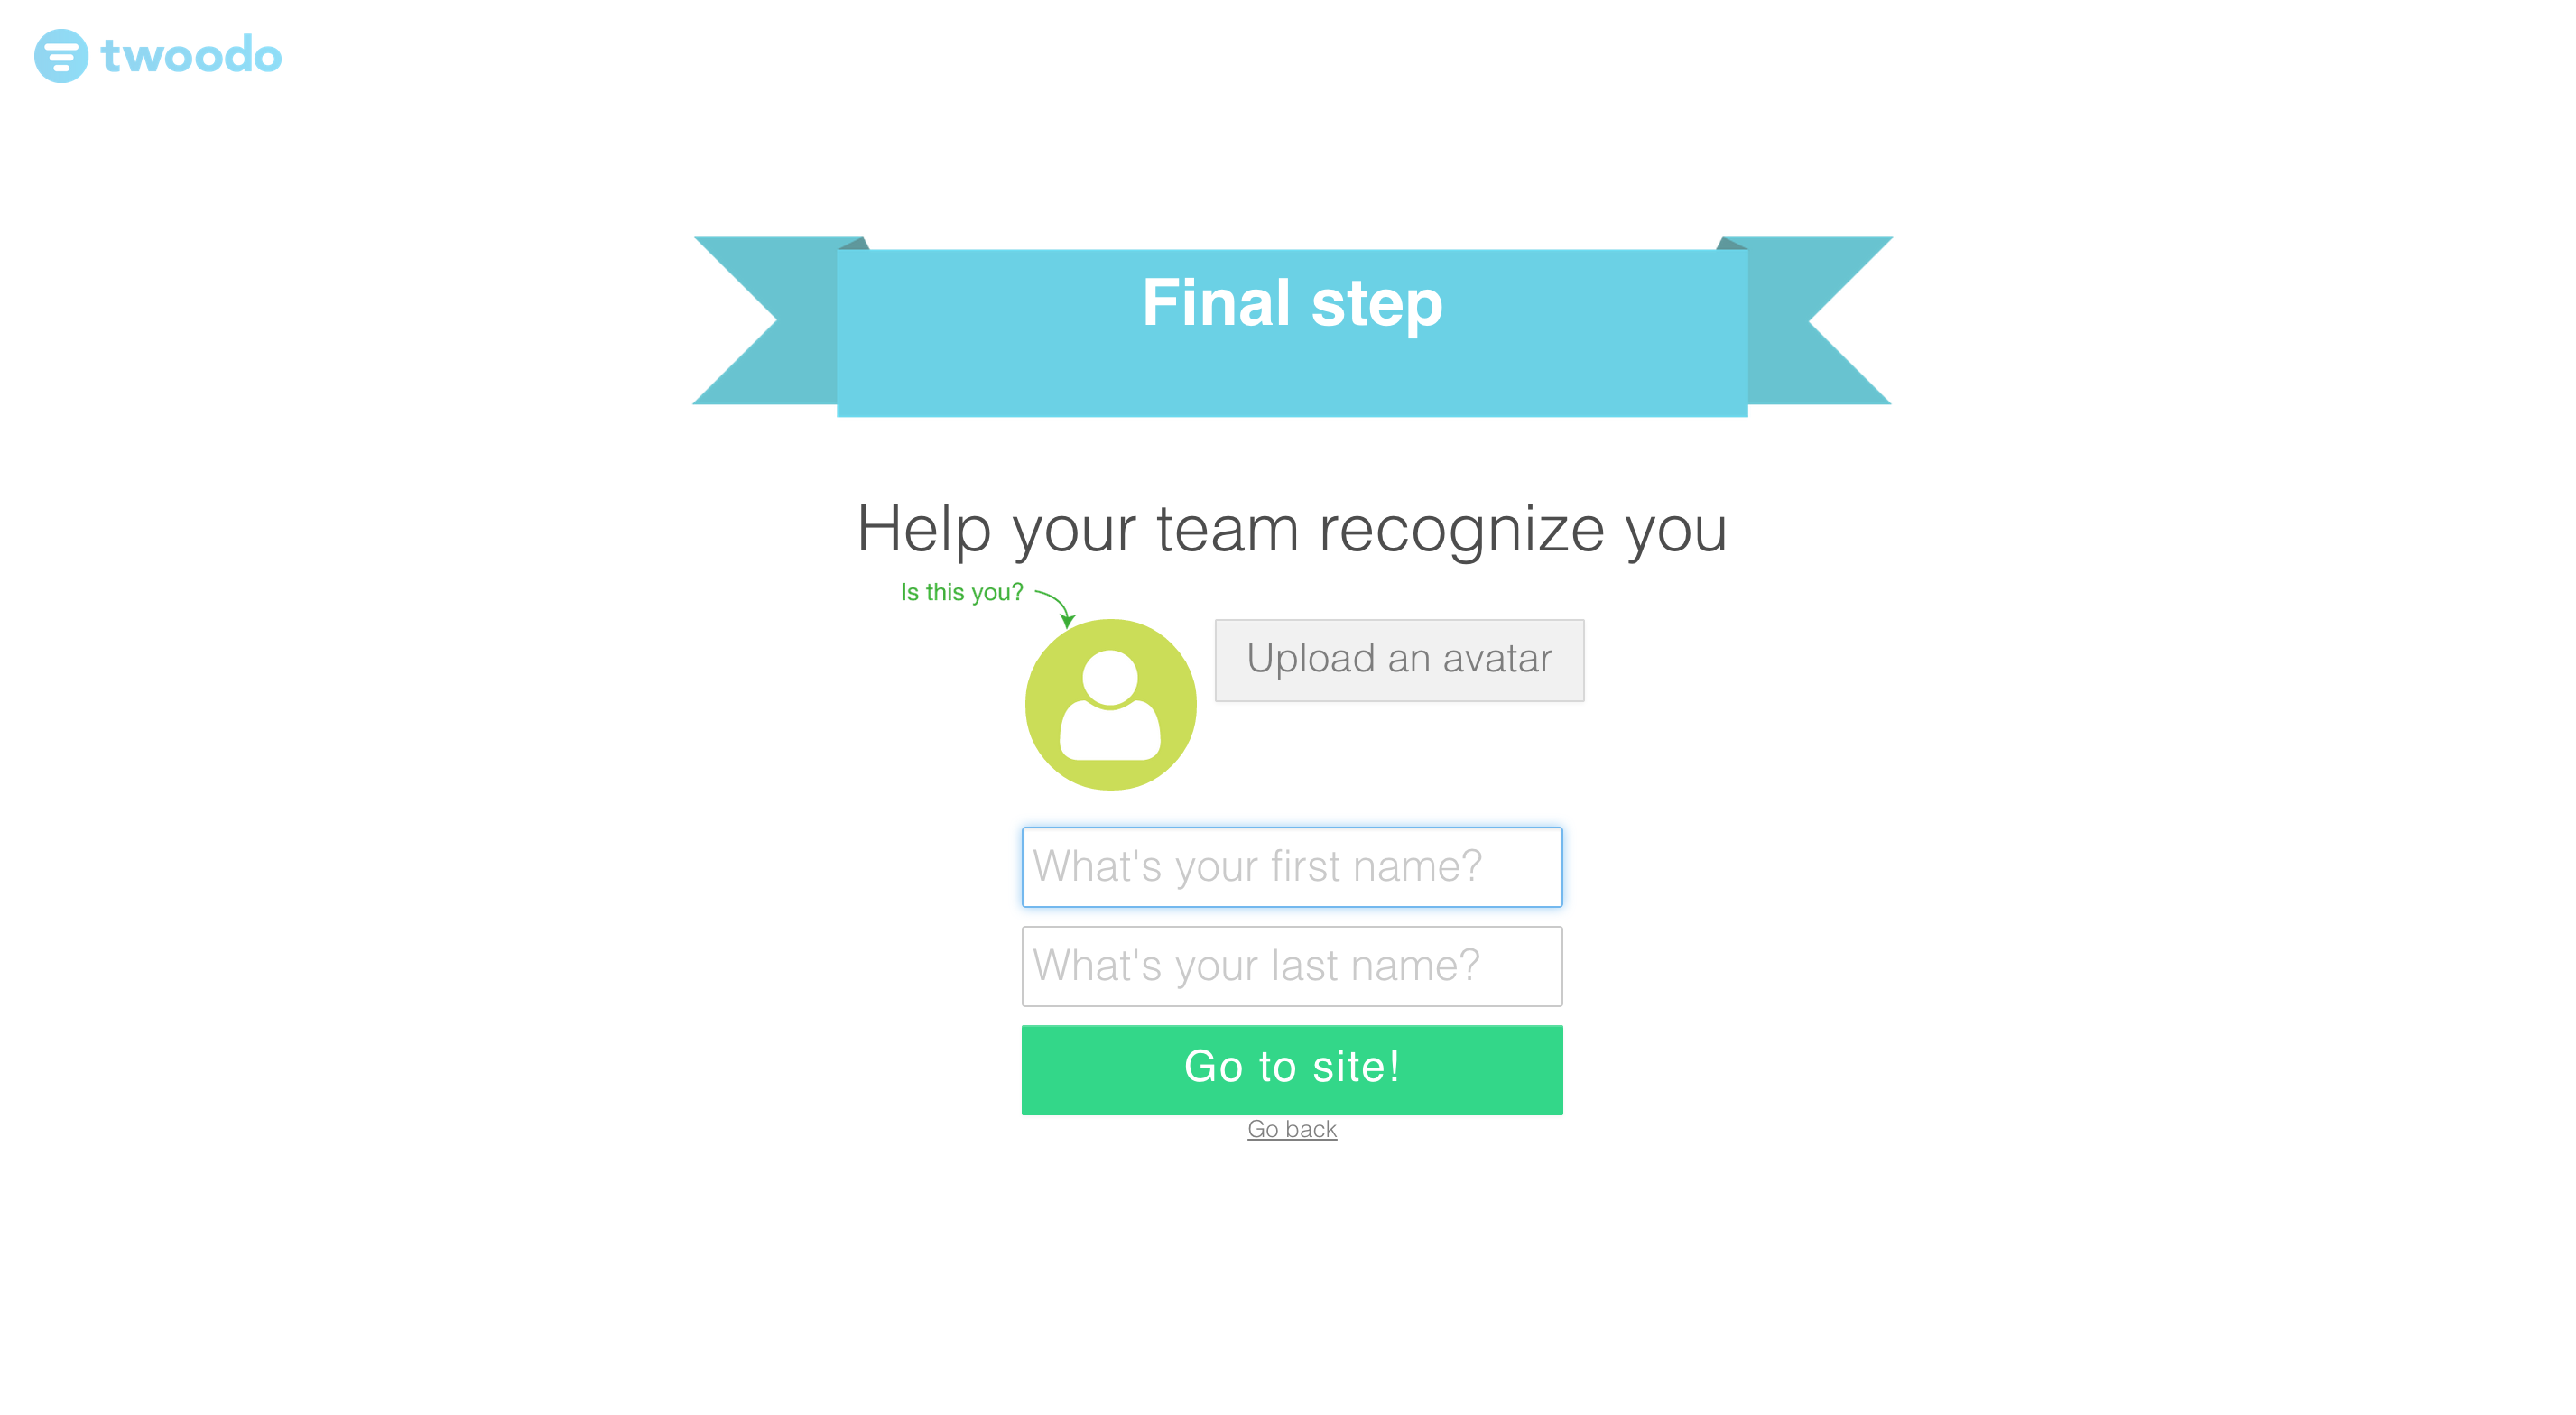
Based on this information we created a B version of our onboarding that would guide new visitors through this journey, step-by-step and removing all the fluff and friction. They basically HAD to go through these steps.
We put the “invite people to your company” much higher in the funnel.

7. A/B Test
We then ran a careful AB test to verify that we weren’t making a huge mistake. We let the test run for three weeks.
The results were quite astounding. With the B version we have an increase in activated visitors of 75 percent. Not only that but new users were inviting 112 percent more people to the platform than before. They were also posting 139 percent more messages and tasks on their first visit. We later also found that activated users were also being retained longer*.
*Of course we were careful to run these stats through a statistical significance calculator. Luckily enough A and B has such a difference in conversions that we didn’t need to run the test too long (2.5 weeks) to reach a significant test.
Read Next: How to tackle content marketing on a budget
Get the TNW newsletter
Get the most important tech news in your inbox each week.