David Arnoux is Head of Growth and co-founder of Twoodo, helping teams organize using simple #hashtags. This post originally appeared on the Twoodo blog.
You’ve probably been reading tons of articles telling you to start setting up metrics for your website, measure your website KPIs and take data-driven decisions. If you’ve already begun setting up metrics and tracking events on your website you probably know that it’s not easy.
We spent quite a bit of time getting it right. In this article we’ll try to explain what you should be measuring, how to measure it and what types of tools you can use to measure them. This is in no way a definitive guide but more a journey of what we did.
First, let me try to convince you a bit….
At Twoodo we’re huge evangelists and practitioners of lean methodology principles: Build > Measure > Learn > Build > Measure > Learn. So, inevitably someone in the company had to be in charge of the “Measure” part.

The 💜 of EU tech
The latest rumblings from the EU tech scene, a story from our wise ol' founder Boris, and some questionable AI art. It's free, every week, in your inbox. Sign up now!
It might not be sexy but we’ll call him our data analyst. As we’ve seen, using jargon such as “events-based tracking” can send a newbie to analyzing data running for the hills. But it is worth spending time understanding how to set up and use your user data properly.
Identifying where there are drops in your conversion funnel is crucial to the success of early-stage startups, and makes a significant difference to established companies. In the example below, we can clearly see something is going wrong, and now we can start hypothesizing about why it’s happening and how we can fix it.
 Source: Mixpanel blog
The first step before starting to track everything and anything is to determine what metrics are important for your organization.
It’s not rocket science, as Mixpanel (the tool we use) assures you. Almost anybody can become a competent data analyst. What you are dealing with are two groups of data:
- Demographics: raw data about the user (name, location, age etc.)
- Events: the things they do on your website (click a link, sign up, leave a comment etc.).
Simply put, you have ‘users’ and ‘events’
In this article we’re interested in events but we go into detail on how to leverage soft data here.
“Events” includes the entire history of a user on your website: What pages he visited, where he clicked, how many invites he has sent, has he posted a comment etc.
Google Analytics can help to some extent with events, but in my opinion it’s quite limited. It is a great tool to understand where your visitors are coming from and can also be used to measure the very top of your conversion funnel. How many visitors arrived on my landing page and then signed up, posted something, stuck around or any other crucial action that you consider a “conversion.”
Unfortunately, GA is not great for going deeper into your conversion funnel and isn’t great for event-based tracking (or I just haven’t learned to use it well enough) – a.k.a.: knowing what each user actually did on your website.
Without event-based tracking there is a lot of ambiguity that leads to guesswork. Guesswork as to what is actually happening inside your product
Are people using the right features, are they following the right steps to see the added value of your website, do they come back, do they come back regularly, do they invite people over, where do they drop off, what should I be improving etc..?
I would recommend using GA for your user acquisition (and a solid UTM tracker framework) efforts but to use an event based tool such as Mixpanel or KissMetrics to track user behavior and ultimately improve your product.
What am I supposed to be tracking?
![]()
There are reasons that people bang their heads off of walls when it comes to using funnels. The first reason is: what am I supposed to be tracking?? We’ve found that using these questions can help solve this issue:
Step 1. What’s the main goal of your website? What is your business objective?
Let’s look at three different examples:
- For an e-commerce shoe store the business objective is to sell shoes.
- For a community website like Airbnb it’s getting people to book what they call “spaces”.
- For a team collaboration tool like ours it’s to get people to login daily and communicate.
Step 2. What is needed for these objectives to be met? What are the Key Performance Indicators (KPIs) that prove your business objective is being met.
There shouldn’t be hundreds. You should probably limit this to one or two. Let’s try to keep it simple in the examples:
- For the e-commerce shoe shop it would be number of shoes sold.
- For Airbnb there are two major KPIs: Number of spaces put up for rent by hosts and number of places booked by guests.
- For Twoodo, it’s number of teams created and number of daily active users.
Step 3. What conversion funnel leads to these steps:
This is where it gets a bit trickier. Depending on your website there can be many different event paths that can lead from Event 1 “Visited your landing page” to the Final Event (“clicked purchase”, “clicked book” or “created a team”) that we mentioned as a KPI.
The trick here is to find paths (and remember we’re looking at events here like: clicked a button, visited a certain page) that ALL your visitors will have in common from landing page to conversion. Sometimes, this means leaving out things like searches, certain pages or certain paths from your funnel because it’s possible for users to get from Event 1 to Final KPI Event without doing certain actions.
Here’s what I mean using the Airbnb example of someone renting an apartment:
- Path 1: Visited landing page > searched for a city > refined search by price > clicked on a place to rent > chose dates > clicked “book” > clicked on “make payment”
- Path 2: Visited landing page > chose dates > clicked on a place to rent > clicked on a “similar place to rent” > clicked “book” > clicked on “make payment”
In this example, only the events marked in green are common between the two paths. The other events should therefore not be tracked here. I know this isn’t the perfect example but it’s to help you get going.
So let’s go back to our three examples. These are the funnels that could be created for the examples we mentioned earlier:
- Shoe shop conversion funnel : Visited a page > Clicked on a product page > Added to cart > Clicked on “checkout > Clicked on “make payment”
- Airbnb host conversion funnel : Visited a page > Clicked on “list my space” > clicked “continue” > clicked “validate”
- Airbnb guest conversion funnel: Visited a page > clicked on a place to rent > clicked book > clicked on “make payment”
- Twoodo conversion funnel 1: Visited landing page > signed up > created a team
- Twoodo conversion funnel 2: Visited landing page > signed up > logged in every day over the past week
These are only real basic examples. There are many other events you should also probably be tracking. We go into much further details on what metrics you could/should be tracking in this introductory guide to SaaS startup metrics.
Now that we know what to track, getting the right data can also lead to mistakes.
What do I mean? Let me walk you through a scenario. Once a user is logged in it is easy to track him. However, tracking those on your website who have not logged in is a little trickier.
Cookies are one way of doing it, but that won’t work if the same user comes to the website from different locations. Also, a registered user may be on your website but just not logged in. How is this user counted?
This is why we pay the our CTO so much to manage our information flows.
How do we count the information that we want?
You don’t want to check the same event multiple times. It’s not just the quantity of the event (eg. people posted 498 times today) – you need to know who did how many posts (eg. JohnX posted 8 times today, and JanetX posted 53 times today).
The events are related from one step to another by being linked with the same user ID – that’s how you get your percent of users who are doing one step or another. Separate the quantity of users from the number of actions occurring.
Don’t worry! Doing this does not require coding experience, but the person setting it up has to be tech savvy (or at least not afraid to give it a go!). In Mixpanel, simply choose from the drop-down menus the information you want in the timeframe you need it.
In order for this data to be actionable, it needs to be drilled down further. Why did only 10 percent view the sign-up page? Are the wrong people being driven to the homepage? Is there a weak CTA? And after that, why do only 1 percent commit? Are we asking too much from them? Is the sign-up form causing friction? Start at the beginning of the funnel and work your way over.
Focus on the highest drop-off rates. Start to generate hypotheses as to why they would drop off at that particular point and find information to support it. And use Inspectlet to figure out WHY these drops are occurring.
The big scary setup
Most metrics tools make getting started as easy as possible (after all, their data told them that onboarding was too difficult!). The best ones have great support available whether by email, IM or calling.
Most tools are as difficult as adding two lines of code to your website – almost half the battle is won! If you are using WordPress for example, install a plugin called “Header and Footer” and paste those two lines of code into the footer – done!
Now you need to make sure to track the important events. Let’s use Twoodo as an example again. When you arrive on Twoodo you have to carry out a certain number of “onboarding steps.”
It’s important for us to know how many users are carrying out the entire onboarding. How many are stopping at step 1, step 2 etc. The funnel looks like this:

As you can see steps 3 and 4 are posing a problem to users. I’ve identified where there’s a drop in my funnel and I can start thinking about how to fix it.
It’s just like algebra 101: you have a variable x and you define what the value y is.
If you think funnels are not that important… think again
A small leak in your funnel can compound over time to lose you a huge amount of revenue (if you reach the revenue positive stage at all!).
Take a look at the calculation below from Don’t Leak Leads – these are the average numbers for 1,000 visitors.
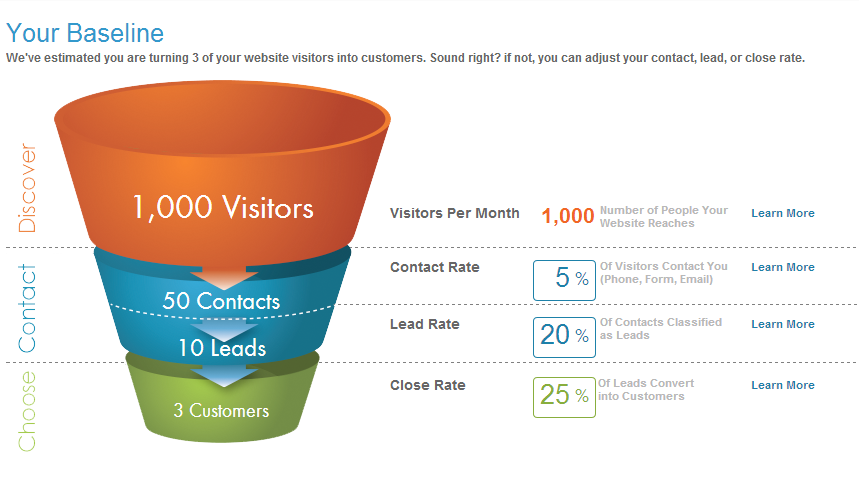 Using data funnels, you can figure out why only 50 out of 1000 people are dropping off. This way you can reduce your CAC significantly.
Perhaps you are targeting the wrong people to visit your website – check the demographics. Perhaps your call to action is unclear or below the fold – move it (and do an AB test) and change it (and again, AB test).
Metrics only tell the data analyst half of the story. They tell you what is happening on your website. The next part is to understand why these things are happening.
A lot can be said about that, usability testing, talking to your customers, exit surveys can all help understand the why and create hypothesis as to how to fix it. But that’s for another article…
Read next: Killer user onboarding starts with a story
Get the TNW newsletter
Get the most important tech news in your inbox each week.