
David Arnoux is Head of Growth and co-founder of Twoodo, helping your team organize itself using simple #hashtags.
A business whose true north is growth will know that collecting quantitative and qualitative data is critical. Organizing your company’s data and knowledge from the beginning is not optional. Without this system, you might struggle to understand why your visitors and users are doing what they do, how they value your product and how they pass on information about it to others.
This means setting up your technical information (such as updates, tests, feature developments) and “business” information (such as design changes, copy updates, blog posts) in a way that the team has a holistic overview of the state of affairs.
The aim is to improve your team’s ability to identify correlation and causation – was there a surge in visits after the new feature was uploaded, or was it because of the new SEO’d blog post published the same day?
Growth philosophy from Day 1? Recording everything
I’m going to start by telling you to record and store everything from Day 1 of your business. Why? Because you don’t really know your users yet.
When we started on our journey to turn hashtags into a principle of team collaboration, all we had were assumptions, a hope and a dream. You may already have a working product – and congratulations to you! But unless:
a) the novelty level is off the charts
b) unless you’ve carried out your customer discovery interviews like a god
– you probably still don’t know who your ideal users are, what they really want and even worse: if they really understand the value of what you’re offering.

Your idea will very possibly evolve over time; and data that once seemed trivial to collect will suddenly become precious. I’m not talking only about metrics and hard data here: I’m talking about soft data, qualitative data, both internal and external, getting into the heads of your user, clients, visitors.
It’s not easy to get the soft data. It’s hard to get people to stop and give you their opinion, to open an email, or to take a survey. SurveyMonkey’s data shows that the average click-through rate for emails is 4 -5 percent (MarketingProfs put it at around 8 percent).
Email is the cheapest way for you to do research, but not the only one. It’s important to grab every opportunity to squeeze a reaction and a suggestion out of those you have identified as ideal personas, as your ideal early adopters.
You can do this through Skype chats, live chats, in-app messaging, questionnaires, widgets or even meeting your users in person (yes that still exists). Lo and behold, you will find a slow but steady accumulation of data that will ultimately drive your business decisions in more ways than one.
Gathering this qualitative data will prove extremely useful for future copywriting, finding the right channels to acquire visitors, removing/adding features to the product… and the list goes on.
In the early days, it might seem urgent to start driving huge numbers of visitors to your website. However, this is the time to do serious qualitative research, and to stick with it until you reach product-market fit.
The product should charm and delight upon the first user experience. It should be simple enough for that person to explain to another without getting into a tongue-twister. There’s no point driving huge quantities of traffic to your app or product if you haven’t figured out what value people get out of it – people rarely return to a website once abandoned.
“Most early stage startups won’t have enough users/customers to heavily rely on quantitative data. You need to be acquiring hundreds of customers every month (preferably thousands) in order to have enough data to support A/B tests and detailed analysis. So focus your time on qualitative data. Remember, your main goal at this point is to find product/market fit. And talking to your early adopters every chance you get will help you find it the fastest.” – Hiten Shah
OK, don’t record EVERYTHING… but record most of it
Let’s be reasonable here – not everything is important; As a business you will most definitely want to get the biggest bang for your buck. Weeding out pointless tasks early on is part of it.
This is where my trusty friend – the Google Spreadsheet – comes in. It’s free, shareable, commentable, and best of all, accessible.
Your first qualitative research will be important to help you identify the “tech enthusiasts” who sign up for everything just to play around with it, and the genuine early adopters. Your feedback needs to be based on the early adopters, not the “passing by” techie nerds thirsty for novelty (whom I love, truly).
How to set up an excellent set of spreadsheets
This is the minimum set of information you need to have at your fingertips in my opinion when you are running a Web business or startup. Being this organized is good for you, for the team, and for your stakeholders – they’ll appreciate the transparency and trust you more. It’s also exceedingly convenient for you to have it all nicely laid out!
1) Technical developments
- Core feature requests + progress
- “Nice to have” feature requests + progress
- smoke tests + results and hypotheses on failures
- list of resources
2) Usability tests
- Usability videos
- Usability test findings
- “What motivated you to sign up?”
- “How would you describe our tool in one sentence?”
- responsiveness – mobile devices, PC
- AB tests to reduce friction (e.g. fewer steps to sign up, less scrolling/reading)
- list of resources and tools used
3) Customer research
- KPIs
- key opinion leaders in the niche
- superuser feedback
- average user feedback
- feature requests
- best user quotes, share comments (social validation)
- list of resources and tools used
4) Growth tactics
- email campaigns
- content marketing campaigns
- outreach campaigns
- websites to get listed on
- ideas + A/B tests to try
- list of resources and tools used
5) PR
- list of mentions in press
- list of places where we want to be mentioned
- list of niche journalists + bloggers
- list of conferences/competitions to apply for
- list of resources and tools used
I italicized “list of resources” for each spreadsheet category because of the diversity of ways that each of my team member’s stores their links to the best stuff. This way, we all get access to the link whenever we need.
So, now you have the basics of starting a business laid out over a bunch of lovely spreadsheets.
Where does my customer research fit into all of this?
In every spreadsheet, you will have a column labelled “hypothesis” or “why am I doing this?” All of your decisions should be customer-driven with the aim of solving a pain point.
Where applicable, I would also recommend using the PIES framework that I discovered by reading some of Peep Laja’s blog posts. The system works like this: For every feature, test, campaign, hypothesis, effort you and your team are going to carry out make a score from 1 – 10 on the:
Potential: What is my gut feeling (based on past experience, knowledge) on how much this can impact my company positively? This could be increase in conversions, increase in brand awareness, a better user experience, and so on.
Importance: How important is this? Does this have to do with some small feature that not many people use (score = 2) or does this have to do with optimizing something on my home page which is the most visited page of my website (score = 10)
Ease: How easy is it to implement this idea? Does it involve the CTO + the Designers + a copywriter? Will it will take 2 weeks to test (score = 2) or does it involve one person that can test it easily (score = 10)?
Score: The sum of the above will give you an indication of what you should be working on right now.
This system means that all decisions must be based on sound evidence – not just gut feeling. The intention isn’t to curb creativity but to make you think deeply and honestly about why you are conducting any test, campaign or making a change.
Real learning and understanding of your personas comes from this. You will get inside your user’s heads and know why they do what they do, what works for them, and what doesn’t.

Good docs organizing is developing good recording habits
I admit, I fall off the wagon every now and again. But we have an agreement in the team to remind each other to catch up on the information we are responsible for recording. Inconsistent and fragmented data-gathering will mean that your interpretations on causation and correlation could be flawed. This could set you back a lot, and waste time.
What can also waste time is poor labelling. Be clear, not clever. Have the tabs in a logical order. Make sure there are no “filler” columns or “repetitive” columns (i.e. a column where all the data is the same).
Here’s an example of what can done for the “results” tab of a blog campaign spreadsheet:
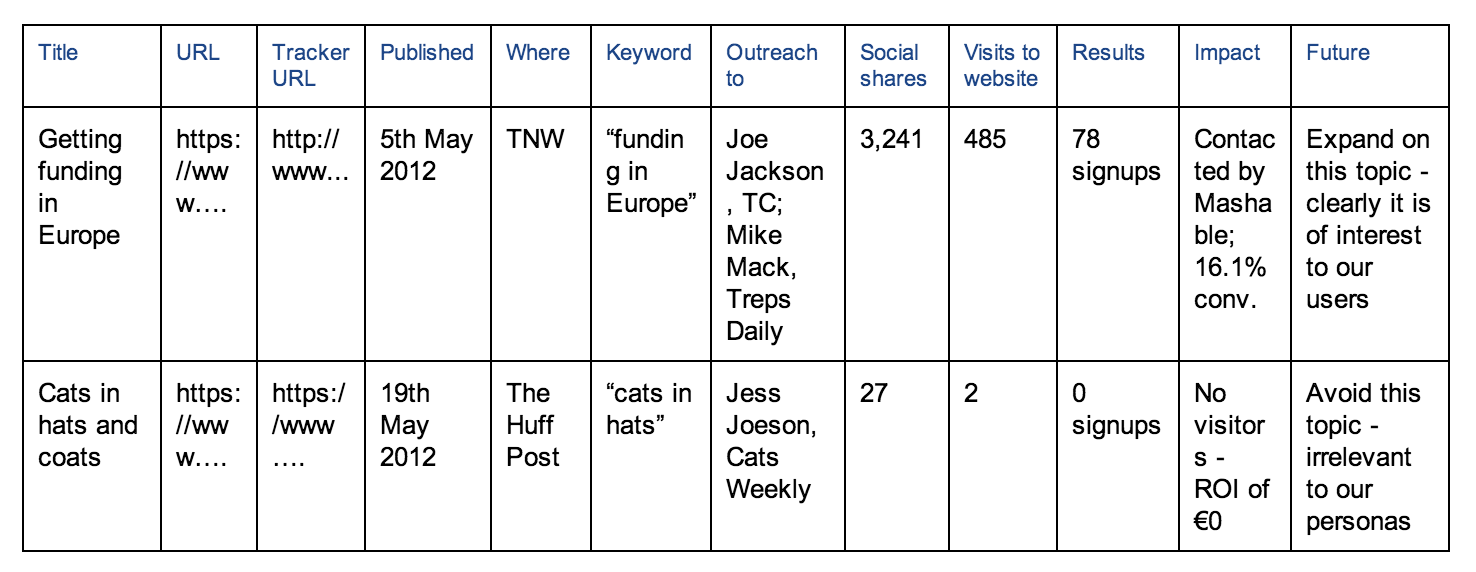
Turns out I should have written about dogs instead… but you get the picture. I can:
- instantly visit the article
- I have the tracker to identify it on my analytics platform
- I have the date published so I can search for correlations in the analytics
- I have the keyword listed so I know what I was trying to rank for
- I have the social sentiment indicating [lack of] interest, and
- I have my results with a reasonable hypothesis
People want to see a “done” list, not a “todo” list. This system is the evidence of your accomplishments and mistakes along the way. Sometimes it’s easy to forget just how much work you have done!
Here is one version of the template we tweaked for running tests. You can use it as a guide.
Revisit the language and behaviour of your visitors and users
Following a guide such as this will reinforce good habits, cause some repetition (which is great for HALLELUJAH insights!) and trust me – you will be constantly amazed by what you learn about your visitors and users!
Growth expert James Currier believes in language and psychology: “Behind every great company is a powerful insight about human psychology.”
If you don’t record what your users and visitors are saying about your product, or observe their conversations about it and take notes, you cannot understand how they perceive the value of your product to them. That’s what will make or break your startup.
Watch Currier speak about the topic and see for yourself.
Get the TNW newsletter
Get the most important tech news in your inbox each week.