The data revolution may be in full swing, but harnessing and capitalizing on this wealth of digital information is a challenge unto itself.
For online publishers, the perennial problem of tracking visitors, gathering data, and acting upon any trends is made easier with the likes of Google Analytics. And for those more concerned about real-time activity, well, companies such as Visual Revenue and Parsely give editors and journalists the tools to act on events as they happen.
Chartbeat too has been carving out a niche in the real-time data space over the past few years, delivering key metrics around user behavior. And today, the company is introducing some significant updates to its platform.
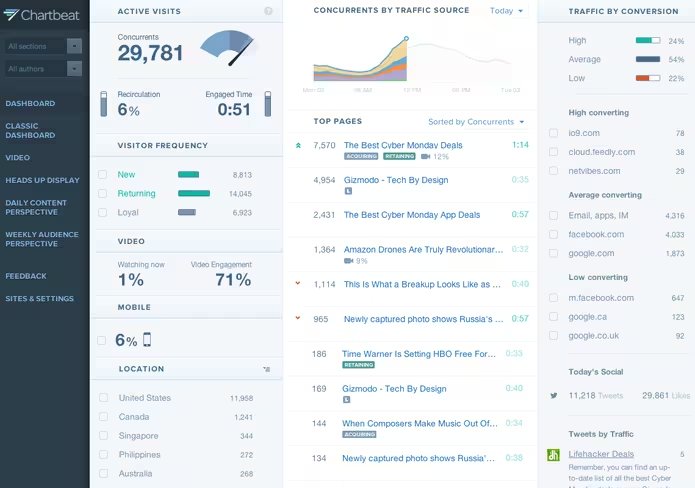
TNW was given a run-through of the rebuilt dashboard today, and it does go into fairly granular detail, covering facets such as how long users are reading a specific piece of content, where they go afterwards, and knowing what articles typically convert new users to regular (and thus monetizable) visitors.

The 💜 of EU tech
The latest rumblings from the EU tech scene, a story from our wise ol' founder Boris, and some questionable AI art. It's free, every week, in your inbox. Sign up now!
Building an audience: Quality not quantity
Ultimately, Chartbeat is about enabling tactical, real-time editorial decisions for those working on the front-line. But with its latest update, it’s focusing more on tracking second-by-second behavior of every website user, with a view towards helping publications think about quality rather than quantity of clicks.
It’s an easy conclusion to jump to. Push out some clickbait headlines on Twitter, throw in a multitude of slideshow-style listicles and drive up the monthly pageviews. More clicks equals more engagement, right? Well, Chartbeat’s Tony Haile reckons this mindset is killing good journalism, and we should really be measuring actual time spent reading articles and whether visitors come back to read more.
 Indeed, it’s not necessarily saying that quantity doesn’t matter, it’s just that if the focus is placed primarily on quality, then quantity should follow. “It’s about building an audience,” says Haile.
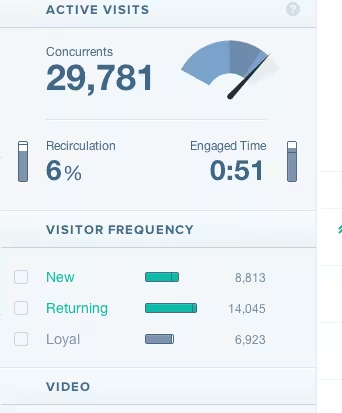
By measuring visitors’ behavior on a second-by-second basis, it should become easier to understand what factors contribute to their chances of becoming a return or even loyal visitor. According to Chartbeat’s data, people who read an article for three minutes return twice as frequently as those who only spend a minute perusing a piece.
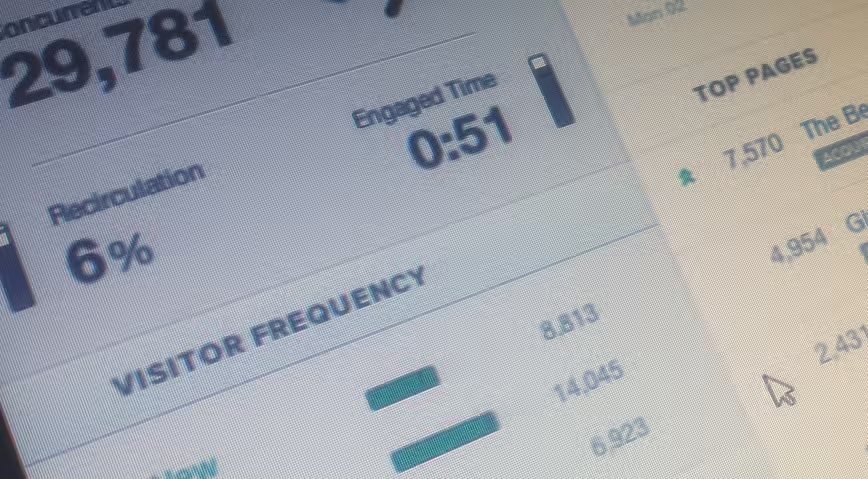
This consumption metric is what the company calls ‘Engaged Time’, and measures audience attention in real-time through keystrokes, mouse movements, scrolling, navigation and more. This is what you’ll now see at the forefront of the new dashboard.
Then there’s ‘Recirculation’, which is a brand-new metric that tells publishers how well they’re doing at keeping users on-site, shifting from one article to another.
You can also drill down and filter by geographic region and platform (e.g. mobile/desktop) so you could choose to see what percentage of new users you have reading your content on their smartphone.
Video analytics have now been introduced to the editorial dashboard to let you see how videos are performing in relation to any content elsewhere on a page – so are they actually viewing or are they reading something else on the page?
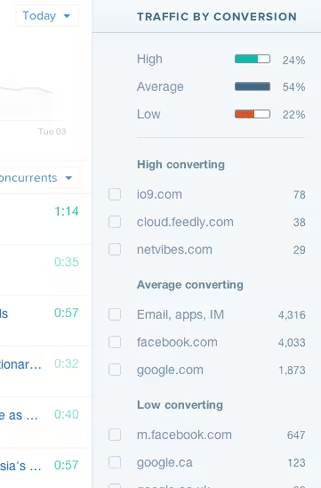
In terms of traffic drivers, you can garner a quick snapshot of which publications are the biggest converters and thus place extra emphasis on building relationships there, or working harder to increase traffic from other sources.
The new audience-development-focused dashboard has been a work-in-progress for the past nine months, and based on our initial preview, it should offer publishers a compelling alternative to others in the market.
You can have a play around with a new demo version of its dashboard here.
Get the TNW newsletter
Get the most important tech news in your inbox each week.