
Social analytics firm Shareaholic today released browser share data for the year 2013 so far. There are quite a lot of figures to go over, but the biggest trend that immediately jumps out is Chrome’s utter dominance.
In September, Chrome was used more than Firefox, Internet Explorer, and Opera combined. If you combine Chrome and the Android stock browser, Google’s browsers have greater usage share than Firefox and Safari combined.
Here are Shareaholic’s three biggest takeaways from the results:
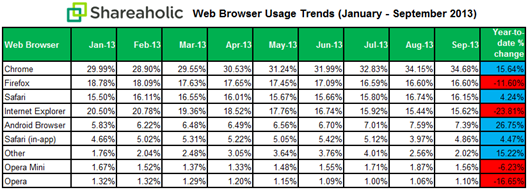
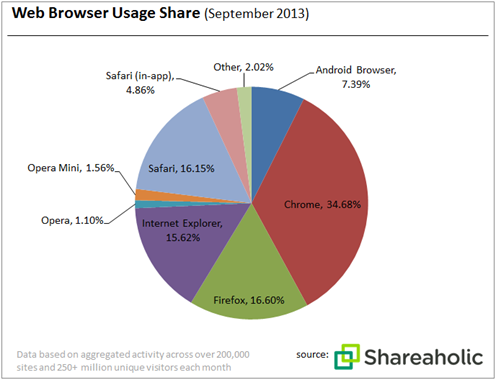
- The top four browsers are used by more than 80 percent of the market. Last month, Google Chrome held the first place spot by capturing more than a third of the market with 34.68 percent market share. This was double Firefox’s market share (16.60 percent), which came in second place, followed closely by Safari (16.15 percent) and Internet Explorer (15.62 percent).
- Only the stock Android browser and Chrome experienced double-digit growth.
- Half of the browsers tracked were in decline. Internet Explorer was hit the hardest, followed by Opera, Firefox, and Opera Mini.
The last two points are percentages of percentages, however, which is not exactly the best way to measure growth. Nevertheless, it’s clear that Chrome is the real winner here and Internet Explorer is taking the biggest hit for it.
Yet as we report every month, IE is still the most popular browser by a wide margin, according to Net Applications. So what gives?
Usage versus users
For the last nine months, Shareaholic tracked 250 million users visiting its network of 200,000 publishers. Net Applications captures data from 160 million unique visitors each month by monitoring some 40,000 websites for its clients. It’s also worth noting that Shareaholic is including mobile browsers in its data while Net Applications keeps desktop and mobile stats separate.
Shareaholic’s data encompasses the usage of browsers by measuring how many webpages are viewed by each browser. Net Applications meanwhile looks at users by measuring how many people using each browser are viewing webpages.
For example, say five people use IE to view a single page and one person uses Chrome to view 25 pages. Net Applications will show IE having a greater market share than Chrome while Shareaholic will show the reverse. That’s a bit of an oversimplification of course, but the point is to get an idea of the different ways to measure browser share.
Top Image Credit: Kimihiro Hoshino/GettyImages
Get the TNW newsletter
Get the most important tech news in your inbox each week.