Just before the 2010s ended, Spotify released “Spotify Wrapped”, a visual overview of our personal, changing music listening habits over the past millennium. Watching popular styles and our tastes change over time was both confronting, and amusing. In fact, it was considered so wildly amusing that you couldn’t open Instagram without having to go through a bunch of stories of people’s personal Wrapped.
Now, what if you don’t want to wait till December to get a new, up-to-date, summary of your listening behavior? Well, look not further… we’ve got you covered! With Spotify’s option to export your personal data, and Google’s free, easy-to-use tool to visualize data called Google Data Studio, we’re going to show you just how to do that. That might still sound a bit overwhelming, but rest assured, no technical understanding is required — we even have a ready-to-use template for you to make it look badass.
So, without further ado, let’s go through the step-by-step process.
Download your Spotify data
- Spotify allows you to get a copy of one year of personal data. Simply go to spotify.com, log in, hit the top right Profile menu, and then hit Account.
- Now navigate to Privacy settings using the menu on the left side.
- Scroll down to Download your data and click the Request button below Step 1.
- Now, it’s just a matter of waiting a few days to receive an email from Spotify with a link to download your personal data. This won’t be a large file, as it mainly contains textual data.
- Once you’ve received the email, download your data, and make sure to return to this article to follow the next steps.
Prepare your data
- Unzip the downloaded zip file called my_spotify_data.zip, simply by double-clicking on it.
- A new folder will appear, containing the data files. Head into the folder, called MyData.
- For Google Data Studio to be able to read our data, it must be in either in a CSV file or a Google Sheet. We’re going to put it in a Google Sheet, so that we can prepare the data a little bit first.
- In the folder, identify all the files starting with StreamingHistory. If you’ve got more than one of these files, it means you’ve listened to more than 10,000 songs over the past year, as Spotify splits your listening history per 10,000 plays across files.
- We have to convert each of the files starting with StreamingHistory from a JSON file to a CSV file, to make it ready to be imported into a Google Sheet document. Simply head over to csvjson.com/json2csv and click Select a file on the left, navigate to your MyData folder, and select the first file starting with StreamingHistory. Once it’s uploaded (100%), click the Convert button, and then the Download button. Repeat this process for all the files starting with StreamingHistory. Now, you should have all your StreamingHistory files as CSV files in your Downloads folder.
- Head over to drive.google.com and create a new Google Sheets document using the New button on the top left. Name it Spotify data, for instance.
- In the newly created Sheets document, navigate to the File menu, and hit Import. Choose Upload, and select the first of your StreamingHistory CSV files that you just obtained using the conversion site named csvjson.csv. Choose Replace current sheet, and hit the Import data button. You now have the data imported into a sheet. Repeat this process for all of the csvjson.csv files if you have more than one downloaded from the conversion site, for instance csvjson (1).csv, but make sure to first create a new sheet in the same document, using the + button on the bottom left every time you start a new import.
- Now, you have all the songs you played last year in one Google Sheet document. But we actually want it all to be in one sheet, not spread across multiple sheets in the same document, so Google Data Studio can read it at once. To do this, we’re going to consolidate everything into the first sheet.
- Scroll down to the bottom row of data in that first sheet. Now, head over to the second sheet of data (if you have multiple). Remove the top row (the header row) of the second sheet of data, with a right mouse-click on the ‘1’ on the left of the first row, and hit Delete row. Now select the whole sheet with Command-A, and use Command-C to copy all of its rows of data. Now head back to your first sheet, your base sheet, select the first empty cell in the A column below the rows of data, and hit Command-V to paste the data rows from the second sheet under it. Repeat this process if you have more than two sheets of song listening data, so all rows of data are captured in the first sheet. After this process, delete all the sheets that are not your base sheet, by clicking on the arrow next to those sheets’ names and hitting Delete.
- Now that we have all of the song listening data in one sheet, let’s enrich our data a little bit before visualizing it with Google Data Studio. In cell E1, type Language. In cell E2, type =DETECTLANGUAGE(C2) and hit enter. It will now detect the language of the song from the song’s title, and insert that language code in E2. To make sure it adds this information to all the rows of data, simply select E2 and double click on the blue box at the bottom right corner of the selected cell.

The 💜 of EU tech
The latest rumblings from the EU tech scene, a story from our wise ol' founder Boris, and some questionable AI art. It's free, every week, in your inbox. Sign up now!
Phew, you’ve done the hardest part of the work now. All that’s left is hooking up your data to our Google Data Studio visualization template, which we’ll explain briefly below.
Visualize your data
- Head over to our Google Data Studio template on datastudio.google.com. Feel free to take a look at my weird, personal listening data.
- In the top right corner, hit the second button to Make a copy of this report.
- A pop-up appears, asking for your data source. Choose Create new data source and select Google Sheets as the Google Connector on the following page. Hit the Authorize button.
- Now navigate to the Google Sheet document populated with your Spotify data, which you just prepared. Select it, and hit the Connect button on the top right corner. The pop-up reappears, now with your file selected as the data source. Hit the Copy Report button.
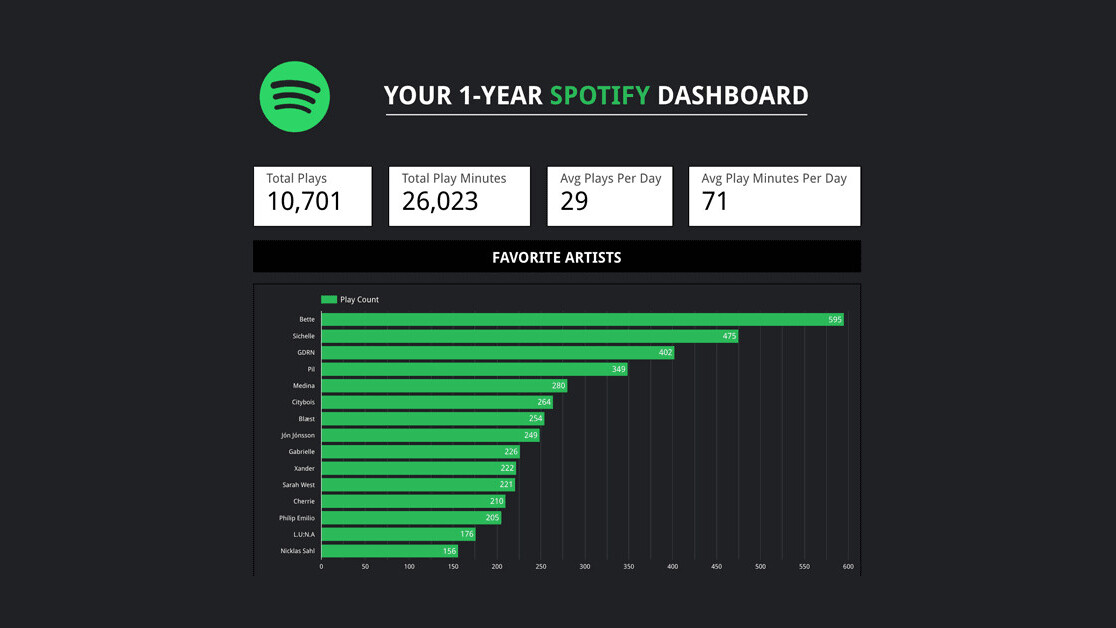
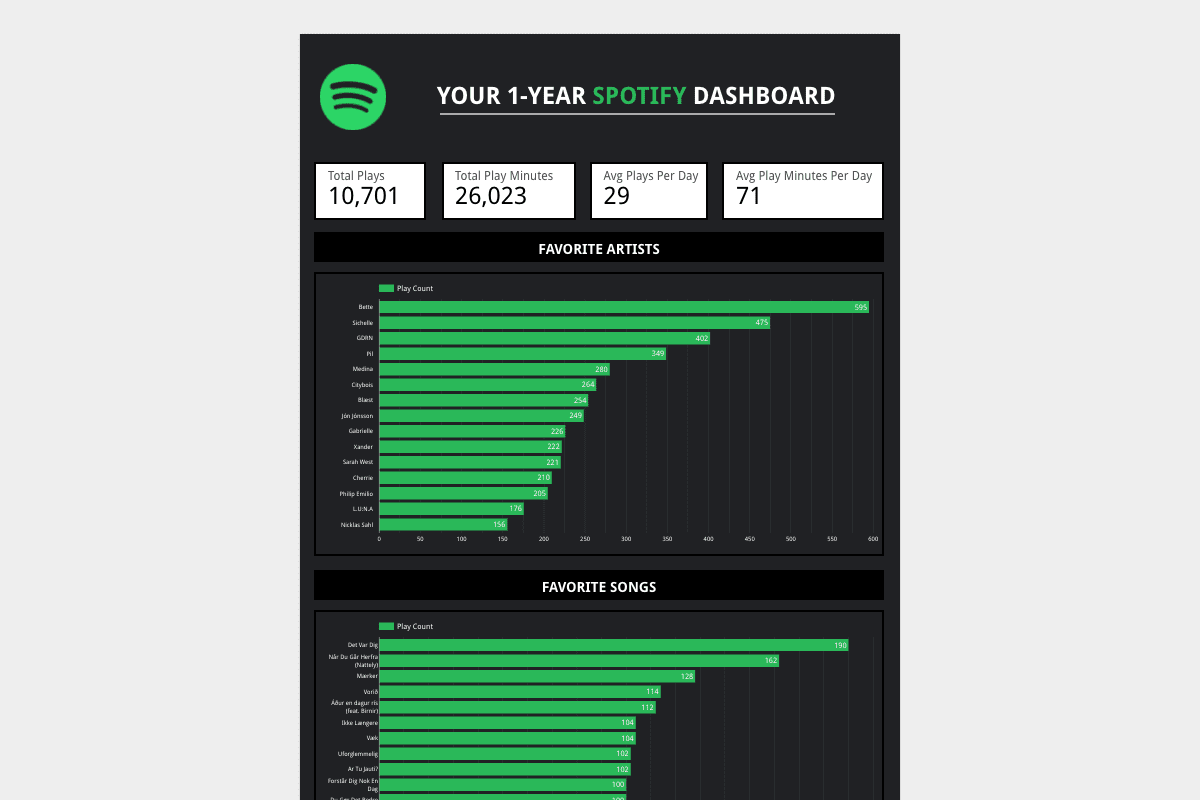
That’s it! Your data visualization is done. Enjoy finding out how often you listen to music, what your most listened-to songs and artists are, and which languages you prefer when it comes to music.
Get the TNW newsletter
Get the most important tech news in your inbox each week.