
State regulators and consumer advocacy groups have scrutinized Allstate Corporation’s use of big data and personalized pricing in the way it calculates how much the company charges its private auto insurance customers.
We tested whether Allstate’s personalized pricing algorithm treated customers differently based on non-risk factors by analyzing rare customer-level data we found in documents that were part of a 2013 rate filing submitted for approval and subsequently disapproved by Maryland regulators. This filing provides the most insight into Allstate’s retention model available to the public, with a level of detail that is typically shielded from public view by Allstate and other insurers.
Our analysis revealed that one of the most significant factors correlated with policyholders’ ultimate proposed price shift was how much they were already paying.
In Allstate’s filing, the company indicated that more than half of its customers were paying too much and others too little for car insurance based on current risk factors. The rate the company calculated the policyholders should be paying is called the “indicated premium” in its filing. (In this paper, we’ll call it the “ideal price.”)
But Allstate didn’t propose adjusting rates to those ideal prices. The company submitted a rating plan based on proprietary customer “retention model” algorithms to more slowly adjust their customers’ rates. Allstate called the rates they wanted to charge the “selected premium.” (In this paper, we’ll call it the “transition price.”)
Our analysis found Allstate saved its highest percentage and dollar rate increases for policyholders who were already paying high rates. Drivers whose premiums were more than $1,883.97 during the preceding six-month period and were due an increase faced transition rate increases of up to 20 percent.
Other customers to whom Allstate had assigned the same ideal price but were paying lower premiums at the time would not have gotten anywhere near as high a bump. Instead, Allstate capped their transition price increases at 5.02 percent.
In other words, it appears that Allstate’s algorithm built a “suckers list” that would simply charge the big spenders even higher rates.
We found that customers who would have received massive rate hikes under Allstate’s plan were disproportionately middle-aged. Customers between the ages of 41 and 62 were the most likely to receive a massive rate hike, likely related to the fact that this age group had the highest median current prices.
Those with massive rate hikes were also disproportionately male. They were also disproportionately living in communities that were more than 75 percent “nonwhite.”
In addition, while Allstate’s own data stated that more than half of its customers in Maryland were being overcharged, the company’s algorithm determined that none of them should be given a substantial discount. Customers aged 63 and older were disproportionately affected by the lack of meaningful discounts.
There are limitations to our analysis. The proposal was never put into use in Maryland. And we can’t state with certainty that Allstate customers in other states would be affected in exactly the same way because company officials say they create variants of its models for each state.1 However, we did find filings in 10 states where Allstate said it uses retention models in its auto insurance pricing.
Car insurance is mandatory for drivers in every state but New Hampshire and Virginia2 and is regulated at the state level. Car insurers in the United States are supposed to set customers’ rates based primarily on drivers’ risk of getting into an accident or suffering other losses that will cost the insurance company money. Most states forbid insurers from charging customers rates that aren’t tied to risk—a common phrase used is “unfairly discriminatory”3—meaning two customers with similar risk profiles shouldn’t be charged different prices.
Insurers regularly submit “rating plans” to regulators. According to the National Association of Insurance Commissioners, these plans include “a set of rules, risk classifications and sub-classifications, factors, discounts, surcharges, and fees applied to a base rate.”4 These plans are used to calculate premiums.
In recent years, some insurers have introduced predictive analytics using increasing amounts of customer data in their rating plans. Unlike the techniques of the past, these methods are not straightforward. It can be unclear, to regulators and consumer advocates alike, how customer characteristics affect the pricing decisions made by insurers.
One controversial data-driven practice is called “price optimization,” which involves charging customers personalized prices that are based on factors other than risk. Among them is “retention” or how likely a customer would be to switch companies based on a price hike or to stay without a price drop.
Concerns about price optimization arose in 2013, when the software developer Earnix published a market survey of 73 executives and pricing professionals representing large insurers in the United States and Canada, showing that 45 percent were using price optimization and another 29 percent planned to join them in the near future.5 6
In a 2014 letter to state insurance regulators, the Consumer Federation of America (CFA) accused Allstate of incorporating price optimization in some of its recently introduced rating plans through a factor called “Complementary Group Rating.”7
The CFA analyzed a Wisconsin Allstate filing and found that the company had divided policyholders into nearly 100,000 “micro-segments” based on the zip code, years of prior insurance, birthdate and gender of the oldest person on the policy. The consumer group accused Allstate of using “illegal techniques” to shift rates.
“The filing shows what we have alleged throughout the ongoing debate over Price Optimization: that insurers are unable to resist the temptation to use Price Optimization to break up risk classes and base prices on non-risk related factors such as price elasticity,” the consumer group said in the letter to state regulators. They urged the regulators not to accept any Allstate rate changes that used the factor and to force insurers to disclose whether they used price optimization techniques.
In 2015, the National Association of Insurance Commissioners (NAIC), a professional advisory group for state insurance regulators, published a white paper on price optimization. It found that while there was no agreed-upon definition of price optimization, many of the practices labeled as such could lead to the use of non-risk based factors, including charging drivers based on how much they are willing to pay, whether they shop around for other insurance options, and if they ask questions or file complaints.
The report stated that these practices could cause customers with similar risk profiles to be charged different rates for the same coverage. The report raised questions about whether price optimization would harm people of color and low-income drivers the most but did not provide an answer.
In the paper, the NAIC suggested that insurance commissioners publish guidance reiterating that rates should not be unfairly discriminatory, and specifying that discrimination includes “[r]etention adjustment at an individual level.”8 In the past five years, at least 18 states and Washington, D.C., have issued public statements prohibiting “price optimization.”
Nevertheless, Allstate was undeterred in its push toward setting rates based on retention. Eight months after the NAIC white paper was adopted, Allstate claimed that it was using retention models in 23 states.9 It typically inserts these retention models as part of its Complementary Group Rating (CGR)—or a successor factor that it calls Table Assignment Number (TAN) Group Rating. In the past decade, Allstate has proposed rate plans that use CGR or TAN in at least 39 states.10
At least three states have rejected these proposals.11 Georgia explicitly disapproved a plan submitted by Allstate that used TAN, stating: “The Department does not allow the use of price optimization.” Maryland regulators said the use of CGR “results in rates that are unfairly discriminatory.” Florida regulators disapproved an Allstate filing in 2014, writing in their rejection letter that Allstate’s plan to set an individual’s premium based on his or her “modeled reaction to rate changes” was “unfairly discriminatory.” Allstate withdrew proposals in some other states, including Louisiana and Rhode Island after regulators asked pointed questions.
Our review of public records shows that in at least 10 states, Allstate’s current auto insurance pricing schemes include TAN or CGR with a retention model.
In its letter to Georgia regulators, Allstate defended its practices, stating that TAN is not price optimization. The company said the regulators should approve the algorithms inside TAN because they only use variables that have previously been approved by state regulators. The company also said that because its rate changes are revenue neutral—in many of the filings we reviewed, rate increases and decreases had an overall impact of zero percent—it does not harm customers.12
How we acquired the data
We used S&P Global Inc., a commercial data provider, to identify relevant public filings Allstate made with state regulators regarding their rating plans. The details of its algorithm are not included in many filings to state regulators. In some filings, Allstate includes information about the algorithm in an exhibit that is kept from the public.
Through examining hundreds of filings, we identified a withdrawn 2013 Maryland filing (SERFF# ALSE-129270805) that was supplemented in 2014 with individual pricing information for 92,792 Allstate policyholders. We then retrieved the filing, complete with customer-level pricing information, from a public database maintained by the Maryland Insurance Administration, SERFF.
Allstate withdrew the filing after Maryland found it to be discriminatory and disapproved the rate request.13 However, this particular filing is the most complete portrait of CGR’s effect on individual insurance rates that is available to the public.
Each individual policy outlined in the filing listed several six-month premiums, including the “current premium” the policyholder was paying at the time, the “indicated premium” Allstate thought each policy should actually be paying using a new risk model, and a “selected premium” the policyholder would be paying once the filing went into effect.
The filing also contained information about the gender and birthdate of the oldest driver on the policy, a “territory” that corresponded to the zip code where the policyholder resided, and the number of years the policyholder had been with a previous insurer. It did not include the number of drivers insured by each policy.14
We joined this data with demographic information on the zip code level from the U.S. Census’s 2015 5-Year American Community Survey (ACS). Of the 92,792 entries, 70 had zip codes not included in the ACS data, and were removed.
How Allstate’s proposed pricing worked
Allstate started by calculating how much to charge each Maryland customer not once, but twice, using an older risk model and a newer risk model. It had been charging customers based on the old model and wanted to transition them toward the price indicated by the new model. Allstate has stated that it views the new model as more accurately reflecting the risk carried by each policyholder.15
For some customers, these two prices differed by thousands of dollars. Allstate claimed that it wanted to avoid “extreme premium changes” that might cause these customers to switch to another insurer.16 To avoid losing them, the company added an extra step, the “Complementary Group Rating” (CGR), to transition customers toward the new model.17 Each policyholder is assigned an individual CGR factor—which ranges from .1066 to 9.3823, resulting in a table that is 1,101 pages long.
Because each policyholder has a personalized CGR, Allstate customers who are assigned similar ideal rate increases could receive dramatically different rate hikes during the transition period once CGR is applied.
CGR is based in part on proprietary “retention models.” In a 2015 letter to Louisiana regulators, Allstate explained: “The retention models estimate a customer’s propensity to retain in reaction to rate changes.” The letter stated that retention is a way for Allstate to estimate its “competitive position in the marketplace.”18
In the Maryland filing, dozens of characteristics are listed as input variables to the retention models, including how many women are covered, the age of the youngest driver, and the number of vehicles.19
Customers’ CGR rates are then set by the predictions of this retention model. Two Allstate customers might both have been assigned a 50 percent increase to reach their new model prices, but one of them might have seen only a 5 percent increase, while the other would have gotten a 20 percent increase under the proposal.
Our analysis showed that the most significant factor determining whether a customer due a significant increase under the new model was hit with a 5 percent increase or 20 percent increase was the amount the customer was already paying. We found that Maryland policyholders paying more than $1,883.97 over the existing six-month period and whose ideal price increase was $381 or more would be hit with up to a 20 percent increase. Those whose indicated increases were similar but paying less than $1,883.97 would only have had to shoulder a 5 percent increase.
Consider two 32-year-old men in Prince George’s County. One was paying Allstate $2,617.42 for six months of coverage, the other, $814.48. They needed a 21.7 percent increase and a 21.8 percent increase, respectively, to reach their ideal prices.
Under the proposed plan, the man with the lower rate would have gotten a 4.8 percent increase, or $39.17, for a new transition price of $853.65. The other man would have gotten a 20.0 percent increase, his rates shooting up $522.45 to a transition price of $3,139.87 for six months of coverage.
The cutoff prices had fuzzy borders. There were 200 policyholders in the Maryland dataset who met conditions for the large increase, but Allstate instead capped their increases at about 5 percent. Most of them, 128 policyholders, had current prices between $1,883 and $1,983 and an ideal price increase of $381 or more. The other 72 policyholders were paying more than $1,983 and were due increases of between $381 and $609.
Effects of the proposed retention model on Maryland customers
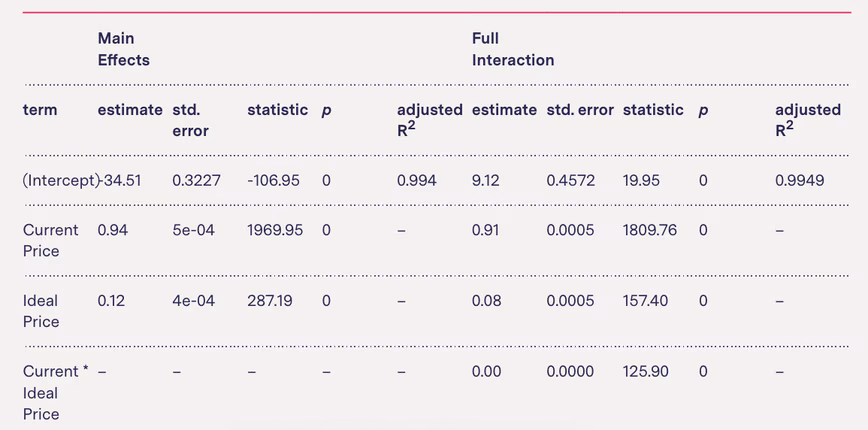
The retention model is used to calculate a price (“selected premium”—which we are calling a “transition price”) between what customers were charged before the filing was submitted (“current premium”—which we are calling the “current price”) and the prices that Allstate calculated for them using the new model (“indicated premium”- which we are calling the “ideal price”). To begin investigating potential effects of the retention model, we first considered a linear model of the transition price regressed against the current and ideal prices. The model output is contained in the table below.
Model output for both main effects and full interaction models
In plotting the residuals of the linear model, it is apparent that there is an anomalous group. For exploration, we calculated a price change for each customer by dividing their transition price by their current price and multiplying by 100. When we plot the residuals against this price change, it is clear that the group is made up of customers with price shifts greater than 9.5 percent.
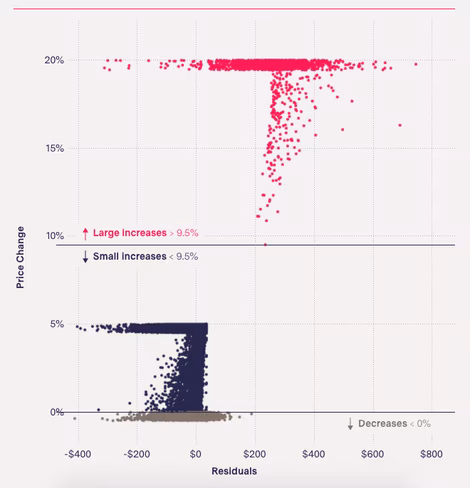
The customers with proposed price increases greater than 9.5 percent were also clustered at the top of the premium price range.
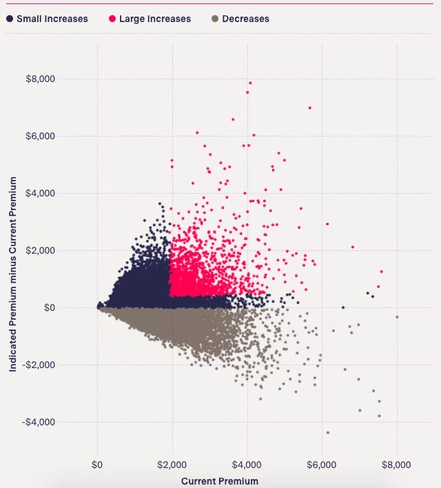
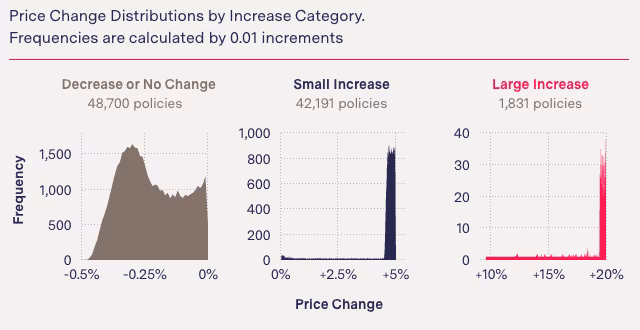
We plotted each part of the regression and found that customers’ proposed premium changes fell into one of three categories:
- 52.52 percent of Maryland customers would have received transition discounts—but much smaller ones than what they were owed. One hundred customers wouldn’t have received discounts at all, despite being owed as much as $691.97. No customer got a transition discount greater than half a percent. These customers had a median difference of $150.04 between what they were currently paying and their ideal premiums, but Allstate gave them a median transition discount of just $1.92. More than half of all Maryland customers were owed discounts under the ideal pricing plan.In a particularly egregious example, a customer who was paying $6,149.75 had an ideal premium of $1,795.52. Allstate was planning on giving him a transition discount of a mere $5.83.
- 45.50 percent of Maryland customers would have received a small transition increase, even though they often needed a much larger increase to reach their ideal premiums. Maryland customers in this category needed a median increase of 21.8 percent to reach their ideal premium. Instead of such a large increase, customers would have received transition price increases between zero and five percent.
- 1.97 percent of Maryland customers would have received a much larger transition increase. These increases ranged from 9.5 to 20 percent. These customers were already paying some of the highest premiums. The smallest current premium being paid by customers in this group was $1,883.97, more than double the median overall price customers in the dataset were paying at the time of the proposal, $860.49.
Exploring the retention model effects with CART analysis
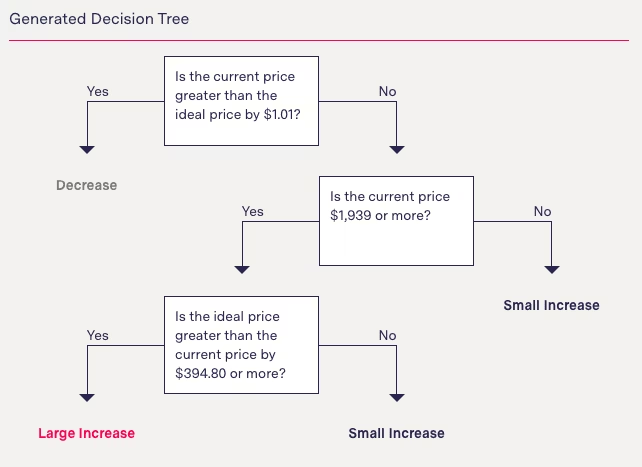
In addition to the regression model, we used a machine learning technique called a “decision tree” to explore the effects of the proposed retention model and it showed the same pattern.
Using the three price change categories identified by the regression, we randomized the Maryland dataset and divided it into groups consisting of 80 percent and 20 percent of the data for training and testing the decision tree model.
For input variables, we used customers’ current premiums, the difference between their indicated and current premiums, and their CGR identifiers: gender, age, and years with prior carrier. Because location is also included as a CGR identifier, we also tested median income and whether the population was majority white.
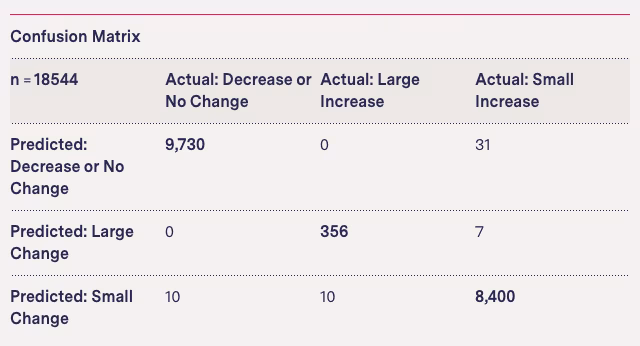
We fit a decision tree model with a depth of three using a five-folds cross validation. Our simple model was able to correctly categorize the testing dataset 99.69 percent of the time.
Disproportionate effects
To determine which attributes of the large increase group might be different from those of the rest of the Allstate customers in the dataset, we investigated group proportions by several categorical variables. For the variables “age of oldest operator” and “percentage ‘nonwhite,’ ” we considered the continuous distributions as well as discretization of the variables for the purpose of statistical testing.
For each level of each categorical variable, we compared each of the categorical proportions to the sample proportion with a z-test of proportions and each of the categorical proportions to each other using the Marascuilo procedure; all testing was performed at α-level 0.0001.
Gender of oldest operator
The “Gender of Oldest Operator”20 is an identifying factor for each policy in the dataset. We found men were more likely to be in the large increase group than the population proportion suggests, regardless of age.
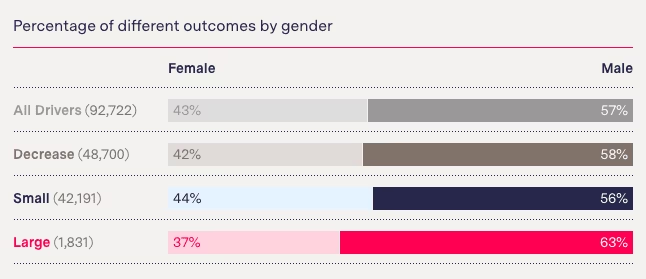
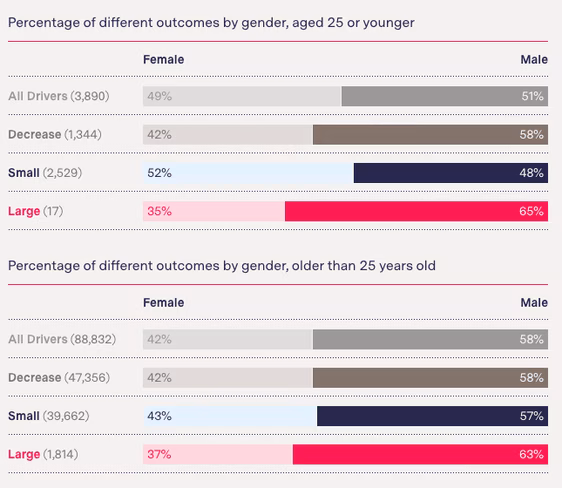
Studies have shown that men under the age of 25 are charged higher premiums than women in the same age group.21 To test whether that was having an effect on the overall results, we examined differences in male and female operators under 25 separately from those who were 25 or older, in addition to the dataset in its entirety.
We found that policies with men as the oldest operator were more likely to be in the large increase pool, regardless of whether the oldest operator was over or under 25. The sample size for men who are under 25 and in the large increase pool is n=11. Since this sample size is small relative to the total number of men in the large increase pool, we can conclude the riskier subgroup of under-25 men is not driving the differences observed using the whole sample.
Age of oldest operator
The “Birthdate of Oldest Operator” is an identifying factor for each policy in the dataset. We calculated the age of each of the oldest operators in the dataset at the requested effective date of the filing April 11, 2014.
When we plotted the distribution of each price change category in comparison to the overall age distribution, we found differences in how the increases and decreases would have disproportionately affected different age groups.
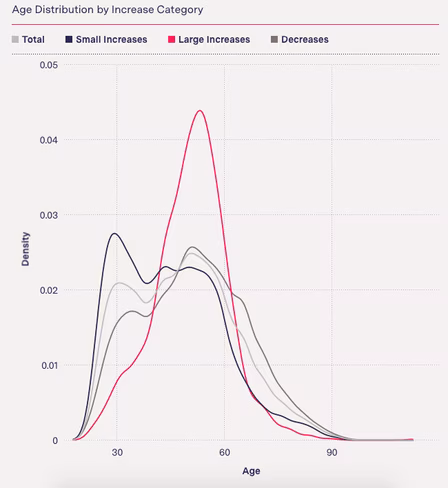
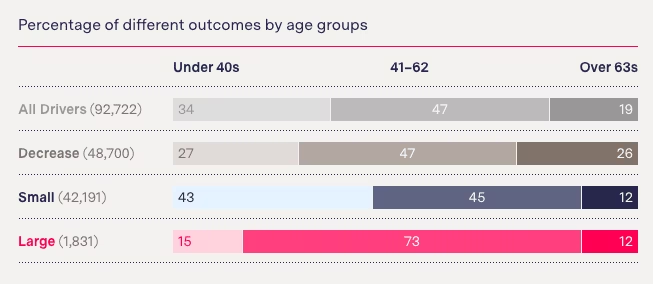
We split the dataset into three buckets, guided by the ages of the bulk of the large increase group and the small decrease group: 40 and 62, respectively.
For policies where the oldest operator was between the ages of 41 and 62, the proportion of those who received a large increase was statistically significantly larger than both the sample proportion and the other price change categories for that age group. In other words, a disproportionate number of customers in that middle-aged group would have received a large increase had the proposal been put into effect.
Policies where the oldest operator was 63 or older were disproportionately more likely to receive a small discount than any other price change.
This is significant when we consider that customers who were 63 or older were most likely to be owed discounts under the ideal pricing plan. Of the 16,570 customers in that age group, 70.8 percent were owed discounts. These customers were owed a median discount of $163.79 to reach their ideal price, but would have received a median transition discount of a paltry $1.64.
Racial composition of zip code
The Maryland dataset contains information about the zip code of each policyholder. We used the 2015 5-Year American Community Survey from the U.S. Census Bureau to estimate the percentage of “nonwhite” residents within each zip code as a proxy for race. We then examined the relationship of race to the price change groups.
When we plotted the density of the total dataset alongside the densities of each price change category, we found the proposed distribution of large rate increases would have disproportionately affected minority communities.
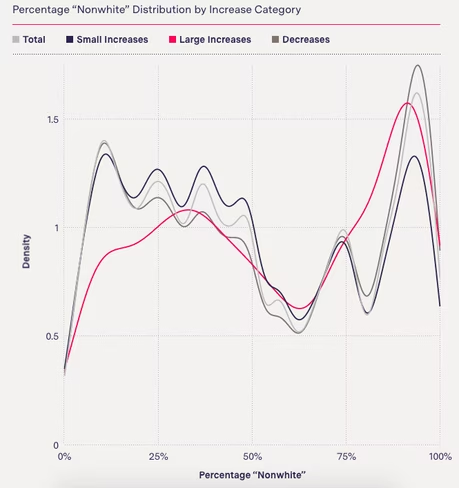
Unlike the small discount and small increase groups, the large increase group does not track with the overall distribution.
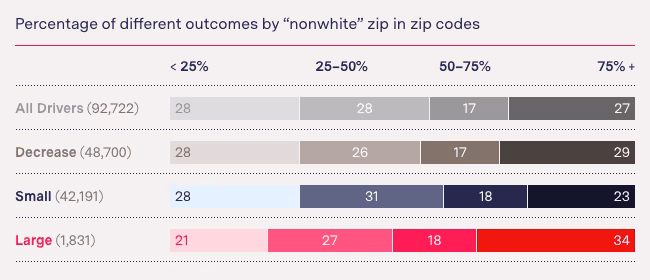
We split the data into four buckets based on the percentage of “nonwhite” population living in their zip code.
Customers living in zip codes where residents are overwhelmingly white (with less than 25 percent “nonwhite” residents) were underrepresented in the large increase category. Those living in zip codes where the population was between 25 percent and 50 percent “nonwhite” were overrepresented in the small increase group relative to their share of the overall sample size.
Customers in zip codes where residents are overwhelmingly people of color (75 percent or more “nonwhite”) were overrepresented in the large increase group in comparison with the overall sample size.
Allstate’s response
Allstate declined to answer any of our detailed questions and did not raise any specific issues with our statistical analysis, which we provided to the company in November, including the code used to calculate our findings.
“Our rating plans comply with state laws and regulations,” read a short statement emailed by spokesperson Shaundra Turner Jones. The Maryland proposal, the statement said, aimed to “minimize customer disruption and provide competitive prices.”
In a later email, she added that our reporting on the Maryland filing is “inaccurate and misleading” because it is “based on a rating plan that was never used.”
In emails Jones insisted the insurer had withdrawn the filing.
Maryland Insurance Administration spokesperson Joseph Sviatko said Allstate withdrew the filing only after the state emailed the denial letter. Oddly, the filing is labeled “withdrawn” rather than “disapproved” in public records and Sviatko said he couldn’t explain why. He said the designation makes “no practical difference” internally.
He also could not explain why the state’s denial letter was not mentioned or included in the public record—we had to request it twice to get a copy. The first time we were told it didn’t exist.
Allstate’s retention model appears to determine customers’ willingness to absorb their new rate hikes or continue to overpay based largely on how much they are already paying. This raises the question of whether Allstate’s proposed model was truly based on drivers’ risk, as the company claims.
In addition, the proposed plan would have disproportionately affected different groups. People living in communities that were 75 percent or more “nonwhite” were overrepresented among those who received large increases under the proposal. So were middle-aged drivers and men.
Those who would have been harmed the most by Allstate’s proposed rates in Maryland were customers who Allstate indicated were already overpaying. While those customers were owed an average of $218.47, the company planned to give them an average discount of only $2.46. Policies where the oldest driver was 63 or older were overrepresented among those who deserved discounts, taking up 25.96 percent of the discount category, despite making up 19.47 percent of the overall dataset.
This article was originally published on The Markup by Maddy Varner, Aaron Sankin, Andrew Cohen and Dina Haner, of Consumer Reports and was republished under the Creative Commons Attribution-NonCommercial-NoDerivatives license.
Get the TNW newsletter
Get the most important tech news in your inbox each week.