
Earning top-tier media coverage for your brand can be a thrill. You’re dramatically boosting your brand’s awareness, and the links themselves can provide substantial improvements to your organic rankings, as well.
As an added benefit, when a very popular, authoritative site covers your content, other sites often syndicate it, earning you more links over time organically without any additional effort.
But as a content creator, I asked myself: “How can I tap into link syndication more deliberately to reap these brand recognition and SEO benefits? Why do some stories enjoy massive syndication after initial earned media coverage while others don’t?”
Toward this goal, I leveraged new machine learning classification techniques to better understand which categories of content and which specific entities (people, places, things, organizations, ideas) seem to disproportionately drive high levels of link syndication.

The <3 of EU tech
The latest rumblings from the EU tech scene, a story from our wise ol' founder Boris, and some questionable AI art. It's free, every week, in your inbox. Sign up now!
Read on to learn how you can use natural link syndication to your advantage when promoting your content to online publishers.
Which topics are most represented among “successful” stories?
First up, here’s a quick overview of my process:
- I selected the top publishers online (based on my internal experience and understanding of the media landscape). I ended up with 141.
- Pulled all of their stories from the last two years and filtered to keep only stories that earned at least 10 links. I ended up with roughly 4,000.
- Scraped the text of each of these stories.
- Ran the scraped text through Google’s Natural Language API for ‘categories‘ and ‘entities.’
- Analyzed the data to look at trends and correlations between domains, story categories, entities within stories, and their connections to links earned.
The following analysis reveals interesting insights about the topics and publications that lead to the most syndication (and thus are the most productive in terms of link building objectives).
Perhaps among the most actionable data I found in this analysis was through understanding which topics and subtopics occur most frequently in my dataset of “successful” stories, or the ones that earned at least 10 links (as described above in the description of the process).
Because Google’s Natural Language API labeler returns Category/Subcategory/SubSubcategory, there’s a lot of granularity to explore.
Let’s begin with top overall categories (category/subcategory) found among all news stories earning 10 or more links:
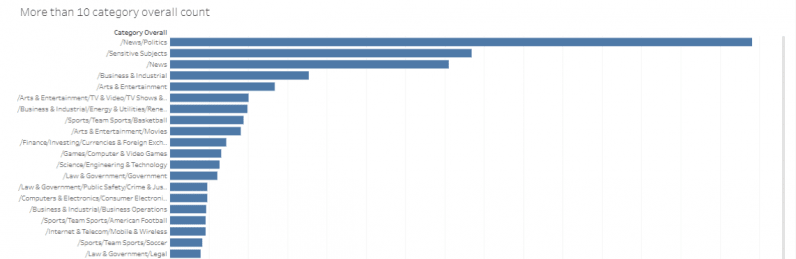
Top first level categories (category)
- News
- Arts and entertainment
- Sensitive subjects
- Business and industrial
- Law and government
- Sports
- Health
- People and society
- Computers and electronics
- Science
Top second level categories (category/subcategory)
- Politics
- Team sports
- TV and video
- Energy and utilities
- Public safety
- Movies
- Music and audio
- Computers and video games
- Investing
- Government
Tableau dashboards
While the results here are not entirely unexpected, they can certainly be instructive when deciding between topical areas when creating content.
Of course, creating content related to your company/product/service is essential, but understanding that arts and entertainment angles work extremely well, for example, could be a reason to ideate around your company’s niche + some arts and entertainment connection.
Takeaway: Consider which of these topics might make sense for your brand and brainstorm how you can create content in these topic areas to leverage their higher overall likelihood for link building success.
For example, if your product is a nutrition tracker app, you could consider sensitive subjects you’re comfortable speaking about, like the topic of medical discrimination against people who are overweight.
Which topics generate the highest median number of links?
Another way to look at the link-driving ability by topic area is to look at the median links of all the content I passed through Google’s category detection AI (vs simply seeing which categories/subcategories were most frequent overall).
By doing this, I can get a better understanding of which categories and subcategories drive disproportionate volumes of links compared to other categories and subcategories in a typical median case.
Here I see some similar results, though there are some interesting differences.
Top overall categories by median links
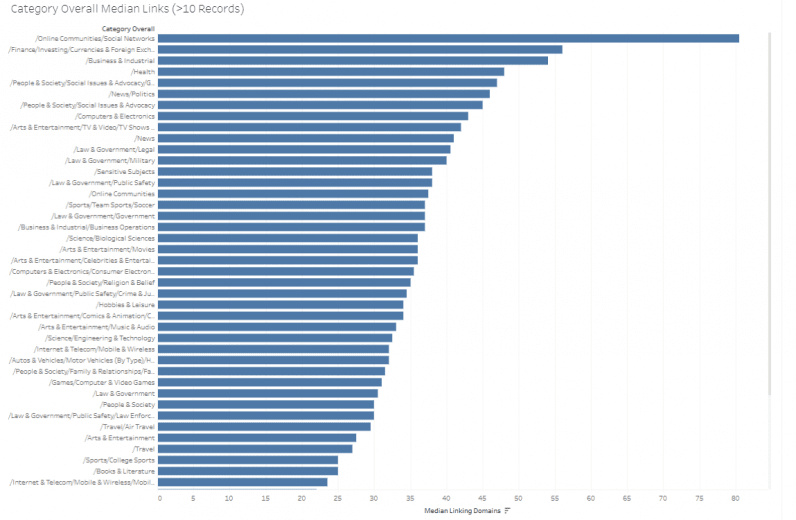
Top first level categories by median links (category)
- Health
- Online communities
- Finance
- News
- Business and industrial
- Sensitive subjects
- Law and government
- Computers and electronics
- People and society
- Shopping
Top second level categories by median links (category/subcategory)
- Social networking
- Investing
- Computer security
- Restaurants
- Politics
- TV and video
- Social issues and advocacy
- Legal
- Military
- Movies
Tableau dashboards
The topic of health provides an interesting example of how these two views can inform each other. It shows up in both of the previous views, but it’s no. 7 in the first while being no. 1 in overall median links per article.
This tells me that while there are perhaps fewer high-performing health related articles overall, the ones that are present tend to perform exceptionally well.
Conversely, with arts and entertainment, I see that though there are a lot of stories of this variety, it does not break the top 10 for median links. This might mean there are a lot of these types of stories that do reasonably well, but fewer that really stand out.
Takeaway: If you’re producing a lower volume of content, it might be wise to invest in a topic area that tends to overperform in terms of median links generated. If you produce a high volume, you can experiment more to see what topics and subtopics work best for your vertical.
To continue the previous example, if you’re a nutrition tracker app that can only produce a small amount of content, perhaps focusing on the financial angle of eating healthy could be the most effective use of your resources by tapping into the popularity of the “Finance” topic.
Which outlets generate the highest median unique linking domains?
This analysis has the added bonus of providing insight into publishers themselves. If your primary content marketing objectives are building links and brand awareness, it makes sense to target the publications that tend to syndicate well.
In this view, I can understand which news publishers have the highest median number of linking domains per story.
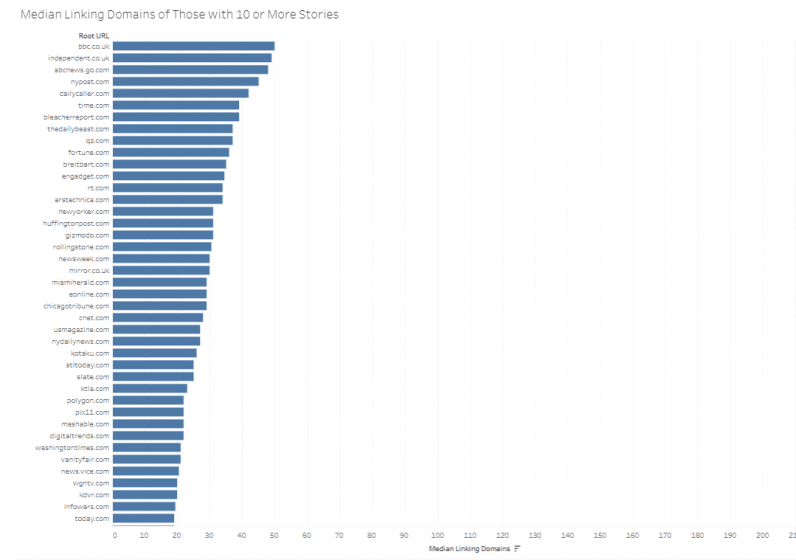
Takeaway: While a lot of general news sites are featured here (and they’re always great to target and create content for). But note that there are also more vertical-specific publishers that appear here, like Quartz for business, Gizmodo for technology, and E News! for entertainment.
Don’t overlook industry-specific (and industry-respected) publishers when building out your pitch lists.
Which entities with wiki entries drive the most links?
In addition to category labeling, Google’s Natural Language API tools can also give you back “entities” (person, place, thing, brand, etc.).
Google returns two types of entities: a broad “web entity” and a “wiki entity,” which is an entity with a known Wikipedia page.
These wiki entities are more useful in this case because they allow us to exclude the long-tail of entities that do not appear on many articles, leaving only the more common entities. Applying this labeling to my dataset of top performing link building articles, I’m able to uncover additional valuable findings.
- Overall
- Event entities
- Location entities
- Consumer good entities
- Organization entities
- Work of art entities
- Person entities
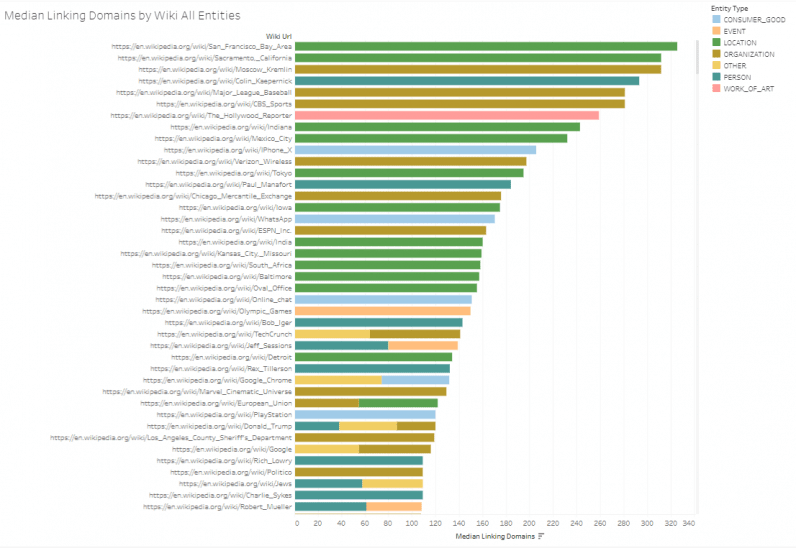
The view above is the entities that drive the highest numbers of median linking domains. These topics can be thought of as the “most newsworthy” or “most likely to syndicate.”
Notice that many are location based and can be inferred to mostly represent breaking news related to a specific place. I also see individual people like Paul Manafort, Colin Kaepernick, and other person entities often taking top spots. Take a look at the full Tableau dashboard for many more interesting insights on which entities tend to overperform.
Takeaway: After exploring the Tableau dashboards, consider which entities might be the most evergreen and applicable to your content, and brainstorm how you might be able to incorporate them into your content.
Back to our hypothetical nutrition app — you might have noticed a lot of locations appear in the “overall” list. Consider geographic angles to increase your content’s appeal; perhaps a list of local restaurants that offer healthy food!
Further exploration
If you want to dive a bit deeper, feel free to explore the additional tabs in the Tableau Dashboard, where you’ll find views of the more granular entities.
In general, I’ve found utilizing AI driven tools to be a huge benefit for uncovering actionable insights about how to identify the right categories/topics/entities to create content on and which media outlets will result in the best chance at high levels of visibility and link syndication success.
Get the TNW newsletter
Get the most important tech news in your inbox each week.