It’s only been three months since I published our first round of Digital 2019 reports here on TNW, but our new Q2 Global Digital Statshot – produced in partnership with We Are Social and Hootsuite – shows that the connected world has already changed considerably during that time.
You’ll find all the latest charts in the SlideShare embed below, but read on for my analysis of all the key trends. Highlights this quarter include some surprise numbers for Instagram and Snapchat, a new entry in our ranking of the world’s top social media platforms, and a closer look at what’s really happening with TikTok.
Essential headlines
 As usual, let’s kick things off with a look at this quarter’s headline numbers:
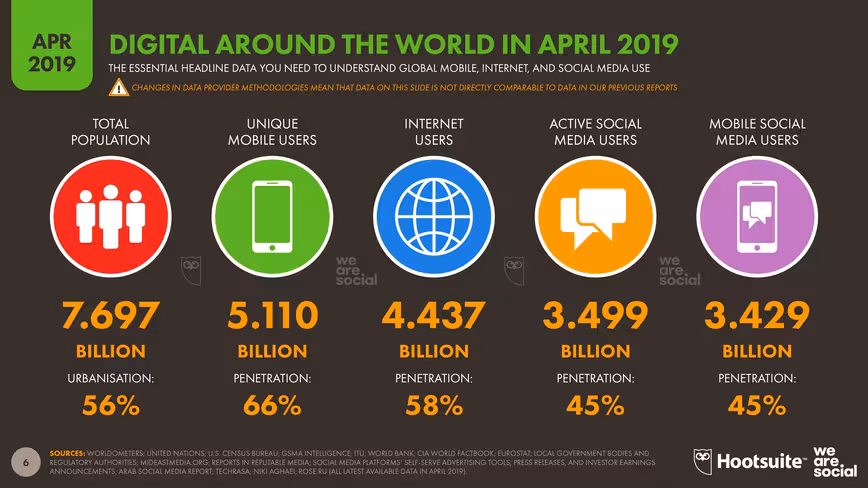
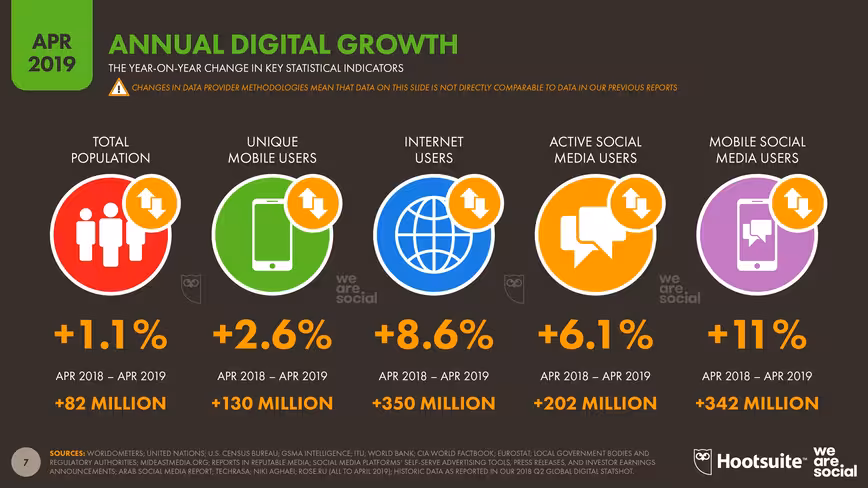
- Global internet users grew by 8.6 percent over the past 12 months, with 350 million new users contributing to an overall total of 4.437 billion by the start of April 2019.
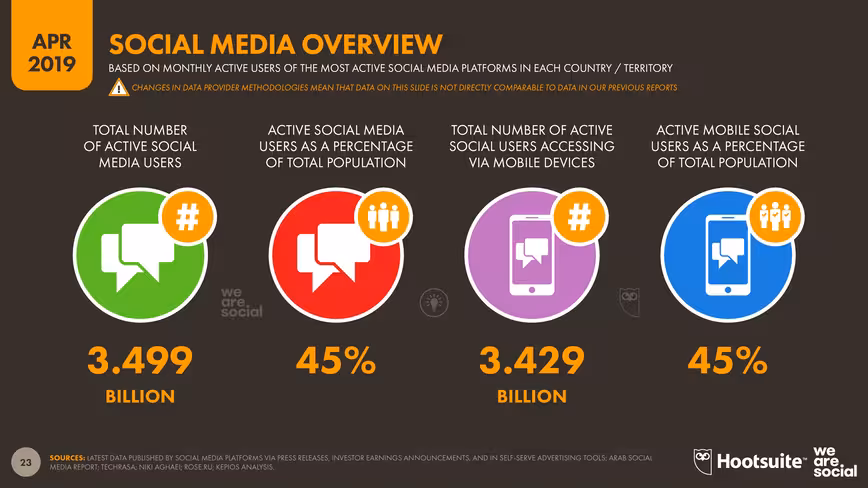
- Social media user numbers have also registered solid growth, increasing by more than 200 million since this time last year to reach almost 3.5 billion by the time of publication. However, recent changes in Facebook’s reporting methodology mean that actual growth was probably even higher, as I’ll explain below.
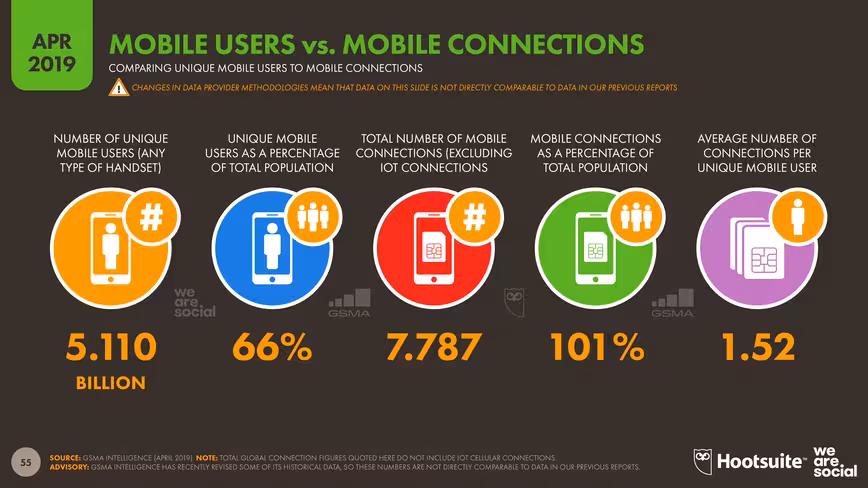
- There are now more than 5.1 billion people around the world using a mobile phone – a year-on-year increase of 2.7 percent – with smartphones accounting for more than two-thirds of all devices in use today.
- Roughly 98 percent of the world’s social media users – more than 3.4 billion people – access social platforms via mobile devices.
 Before we continue, I’d like to offer my thanks to GlobalWebIndex, GSMA Intelligence, and Locowise, without whom this report wouldn’t have been possible.
It’s also important to highlight that some changes in this quarter’s datasets mean that various figures in this report are not directly comparable to those we published in previous reports. In particular, changes in Facebook’s reporting methodology have had a significant impact on the audience numbers that the company publishes for both Facebook and Instagram, while revisions to GSMA Intelligence’s data mean that the mobile figures we quote in this report won’t tally with the numbers we published in our January reports.
However, the good news is that these changes have actually revealed some new insights of their own, so let’s dive into the data to find out what they are…
Internet use in April 2019
The latest reported figures suggest that an average of almost 1 million people came online for the first time each day over the past year, continuing the strong growth that we saw in our recent Digital 2019 reports. We’ve made some revisions to our data sources since then though, and without those changes, these growth figures would have been even higher.
 India accounted for the greatest share of growth in internet users in the first quarter of 2019, with data from the Telecom Regulatory Authority of India showing that the country added more than 44 million new internet subscribers in the first three months of the year.
CNNIC’s February 2019 report (in Mandarin) also shows meaningful growth in the number of internet users in China, with the total increasing by 29 million new users since the organization’s previous report in August 2018.
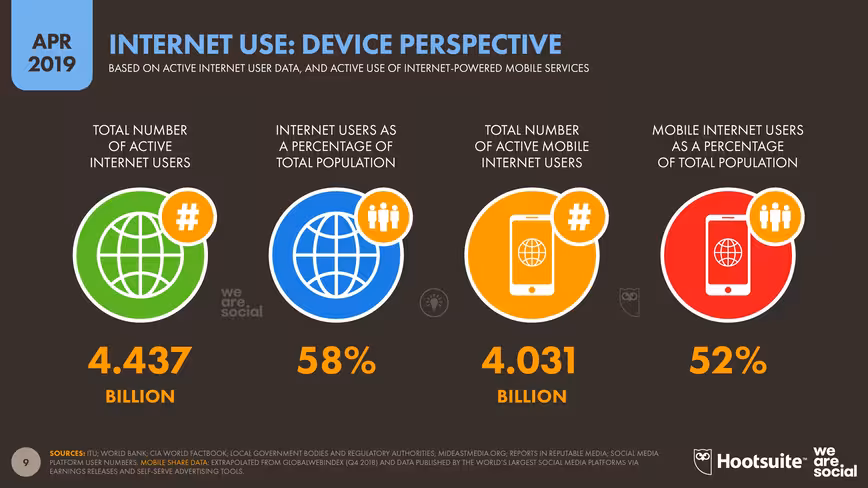
Perhaps unsurprisingly, the vast majority of the world’s internet users now go online via mobile devices, with data from GlobalWebIndex indicating that more than 9 in 10 internet users connect using a mobile phone.
However, the latest data from Statcounter suggest that mobile phones only account for 49 percent of global web traffic, with laptop and desktop computers accounting for almost the same share of activity, at 47 percent.
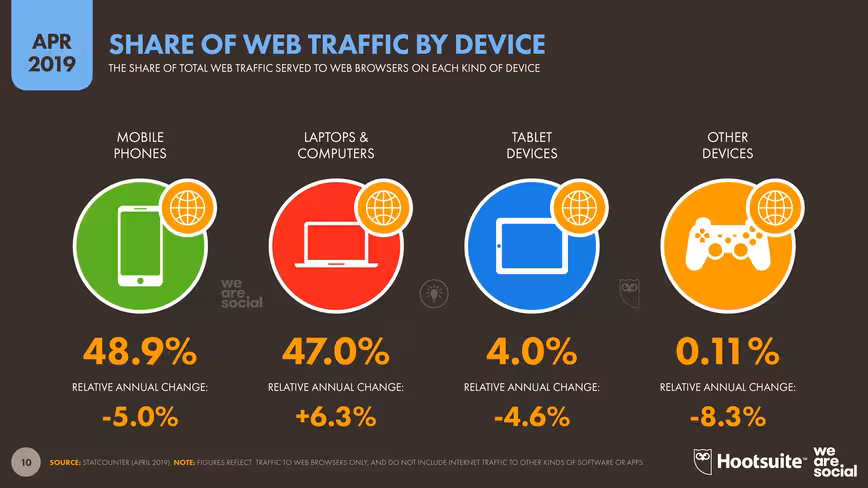 These findings may seem to contradict each other, but in fact, they reveal some important insights into people’s evolving online behaviors.
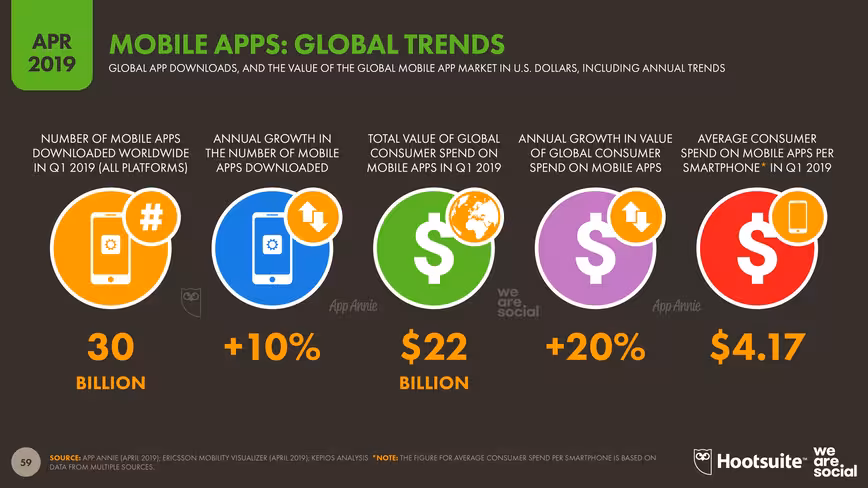
Firstly, they support the hypothesis that mobile users are increasingly turning to dedicated mobile apps – rather than to the mobile web – to achieve their desired outcomes on mobile devices.
This trend is evident in the latest app store data, too. App Annie reports that mobile app downloads across the Google Play and iOS stores have grown by 10 percent year-on-year, with smartphone users downloading a total of 30 billion apps in the first 3 months of 2019 alone – that’s more than 3,850 downloads every second.
What’s more, App Annie’s figures don’t include downloads from third-party app stores, which account for a significant share of activity in countries like China.
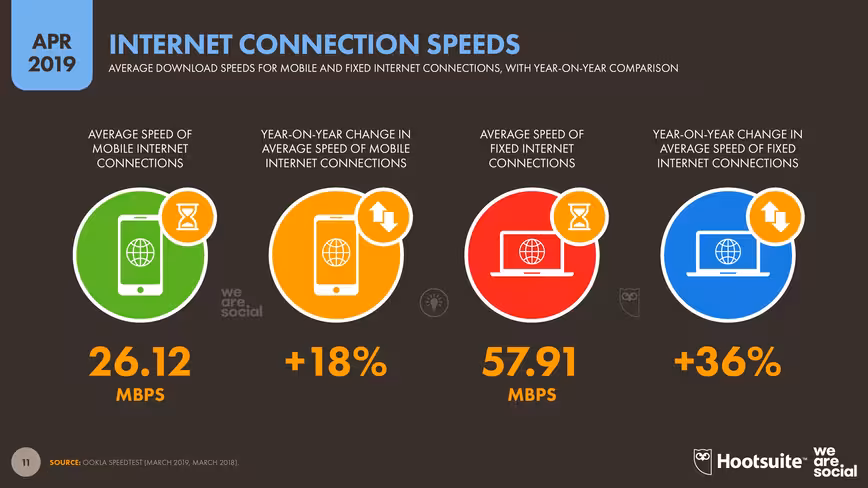
 On the other hand, as mobile plays an increasingly pervasive role in our everyday lives, Statcounter’s finding that web traffic is fairly evenly split between mobiles and computers offers a timely reminder that computer-based web activities are still an important part of global online behaviors, especially when it comes to business-related activities.
This may be partly because fixed internet connections are still considerably faster than mobile connections. The latest data from Ookla reveal that the average fixed connection is more than twice as fast as the average mobile connection, although we can expect to see this change significantly with the advancing roll-out of 5G mobile networks.
The growing role of voice
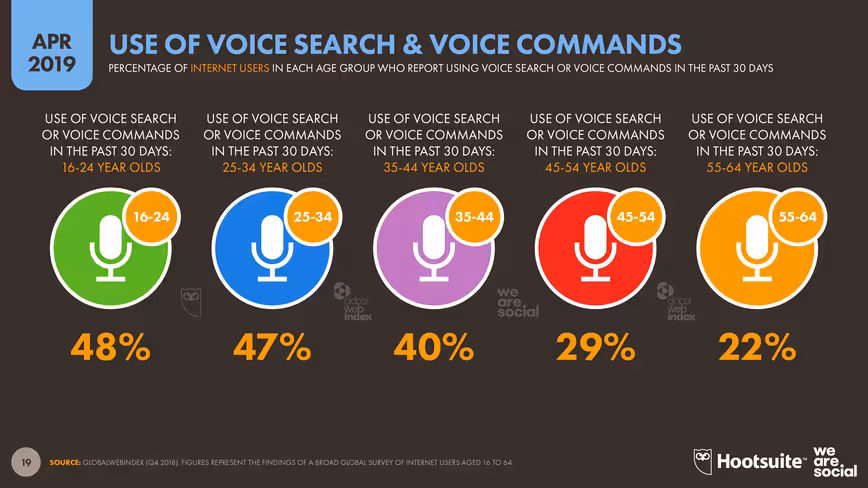
GlobalWebIndex’s latest data show that more than 4 in 10 internet users made use of voice commands and voice search in the past 30 days, but that adoption of these tools varies considerably around the world.
Perhaps most tellingly, the use of voice is most common in India, China, and Indonesia – countries that already have some of the world’s largest internet populations, but that are also experiencing some of the greatest increases in new internet users.
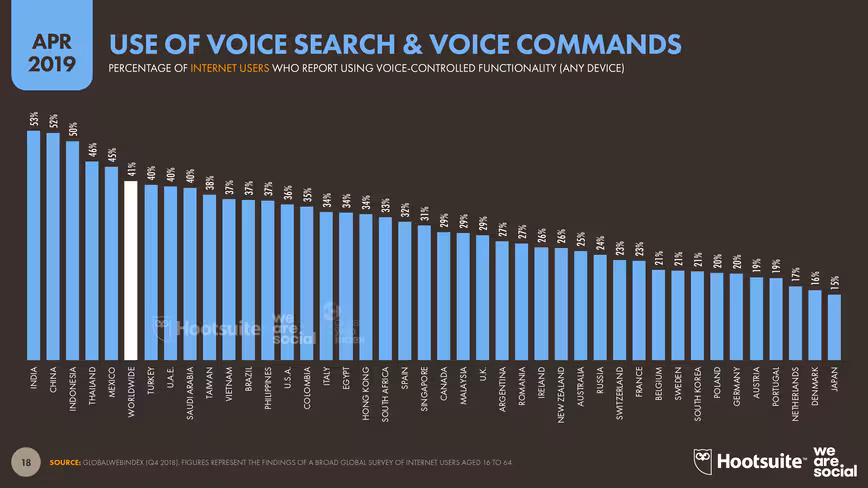 What’s more, despite Western media’s fixation on smart speakers like Amazon’s Echo devices, it’s important to stress that the majority of voice users are making use of voice functionality for everyday activities on their mobile phones.
This is particularly true of younger users, many of whom have not yet developed ‘fixed’ habits when it comes to using digital devices and services. Indeed, the latest data from GlobalWebIndex shows that almost half of all internet users aged 16 to 24 already use voice, compared to less than 30 percent of users aged 45 and above.
 It’s also important to recognize that voice is more of a necessity than a novelty for people in many of the world’s emerging economies.
In particular, for people with lower levels of literacy, and for people who speak languages with character sets that aren’t yet available as smartphone keypads, voice is the default interface for almost all of their digital activities.
Considering that a disproportionate share of the people coming online for the first time today fall into these two groups, it’s likely that we’ll see voice adoption accelerate in the coming months.
Meanwhile, the desire to achieve economies of scale means that the trend towards increasing adoption of voice in the world’s largest internet populations will likely translate into an imperative for developers to move voice functionality to the center of the experience for all users around the world – even in developed nations.
Social media use in April 2019
The number of people around the world using social media continues to increase, but – as I noted above – some important changes in platform reporting definitions and methodologies mean that growth figures look a bit softer than they have done in previous quarters.
However, it’s important to stress that this softness is purely due to those changes in reporting, and it should not be interpreted as an actual slowdown in user growth.
Almost 3.5 billion people around the world now use social media, with roughly 98 percent of them accessing social platforms via mobile devices.
 Overall, Facebook Inc.’s portfolio of services continues to dominate the global social landscape, while Tencent has further consolidated its lead position in mainland China.
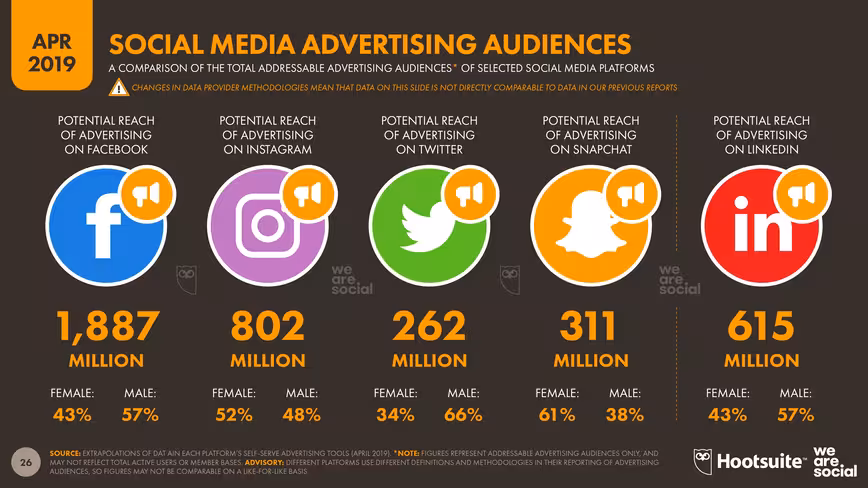
 Exploring each platform’s latest advertising audience numbers offers another valuable perspective on social media use though, so let’s take a closer look at the key developments and trends in the seven major platforms over the past three months.
1. Facebook
Facebook recently made some fundamental changes to the ways in which it reports advertising audience numbers across its various platforms, and – sadly – these changes mean that we’re unable to report like-for-like growth trends this quarter.
As Facebook states in its Ad Help Center:
Estimated potential reach is now based on how many people have been shown an ad on a Facebook Product in the past 30 days. We previously based estimates on people who were active users in the past 30 days. — [shortened for clarity]
However, these changes are actually quite helpful: firstly, they enable advertisers to build a clearer picture of the number of people they’re able to reach with ads on each of Facebook’s platforms, and secondly, they provide investors with a better understanding of how well Facebook is ‘monetizing’ its platforms’ users.
This second point is a good place to start our analysis, because the new figures reveal some interesting insights into Facebook’s performance as a business.
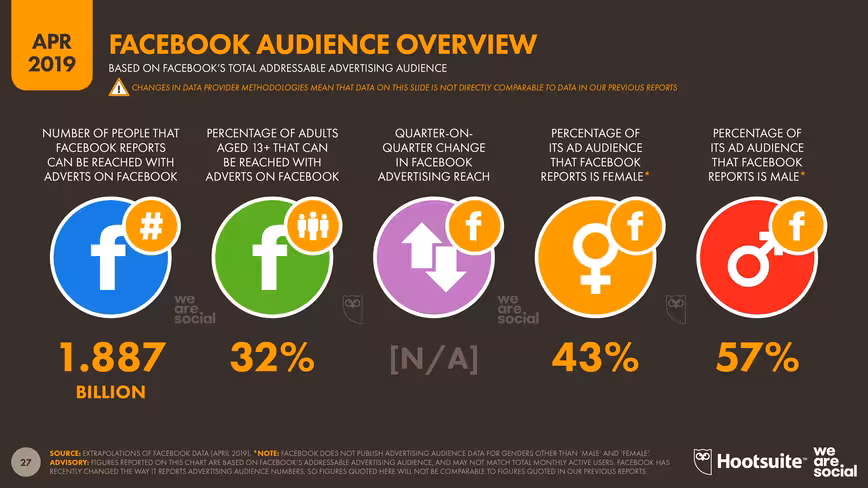
In its Q4 2018 earnings announcement back in January, Facebook reported a total monthly active user base of 2.320 billion users on the core Facebook platform – i.e. not including figures for Instagram and WhatsApp.
Meanwhile, the latest figures the company is reporting in its self-serve advertising tools suggest that Facebook showed adverts to 1.887 billion of these users in the past 30 days.
That means that Facebook is monetizing roughly 81 percent of its total active user base.
 However, there are a number of reasons why Facebook cannot monetize all of its monthly active users. In particular, Facebook has a sizeable active user base in various countries where it is unable to sell advertising due to international sanctions, such as Iran, Syria, and Cuba.
But the good news for Facebook is that these changes in reporting appear to have improved the company’s story when it comes to user activity on the platform.
Whereas the company’s Insights tools had been showing steady declines in users’ median number of ad clicks over the past three quarters, the latest data show much healthier figures.
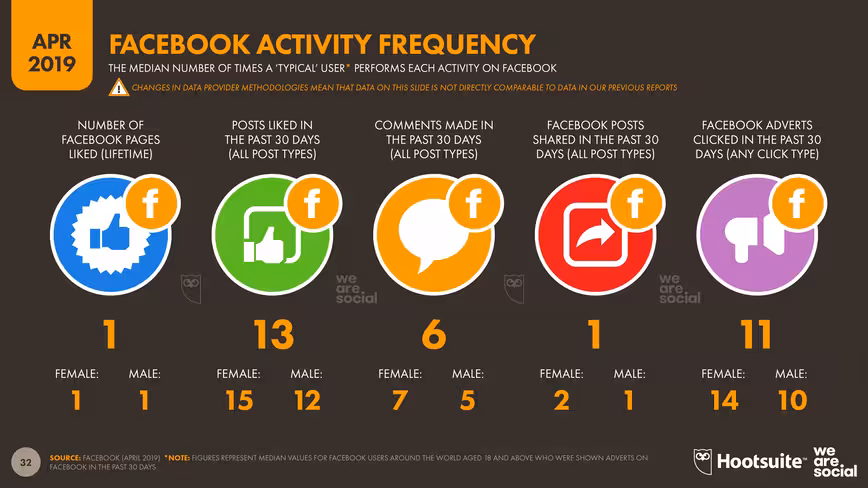 However, changes in audience definitions and reporting methodology mean that these figures can’t be compared on a like-for-like basis to previous reports, so these healthier figures do not necessarily mean that people have actually been clicking on more ads, nor can we be sure whether people have been sharing or commenting on Facebook posts more frequently.
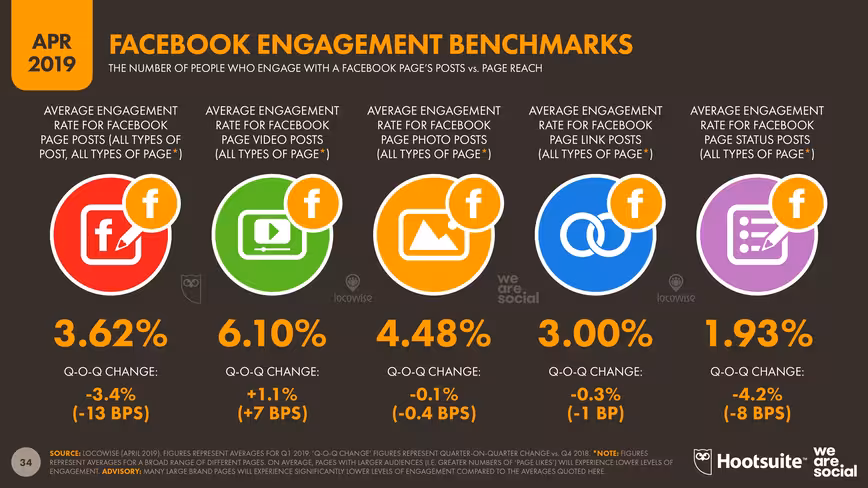
Indeed, the latest insights from Locowise reveal that engagement with Facebook Page posts continues to decline, with the average post now garnering a response rate of just 3.6 percent – a relative drop of 3.4 percent in just the past three months.
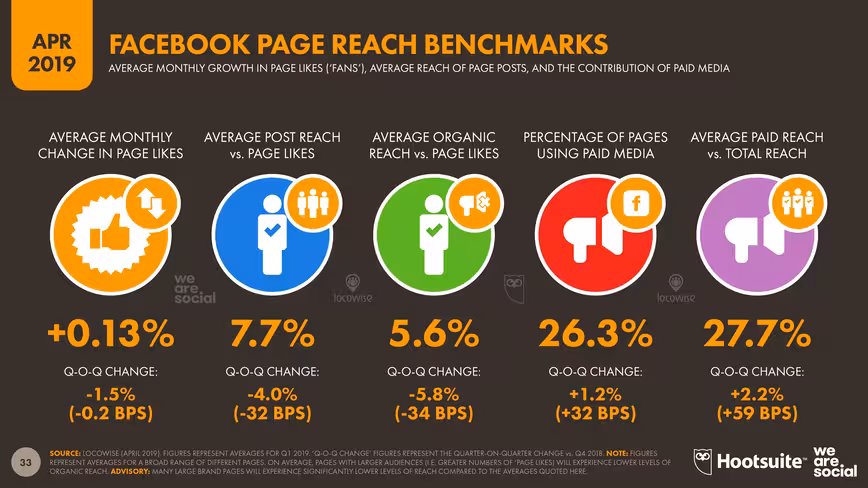
 Meanwhile, organic reach for Facebook Page posts also continues its relentless downward trajectory, with Locowise reporting that barely 1 in 18 of a Page’s fans now see posts without paid media support – a relative decline of almost 6 percent in just the past three months.
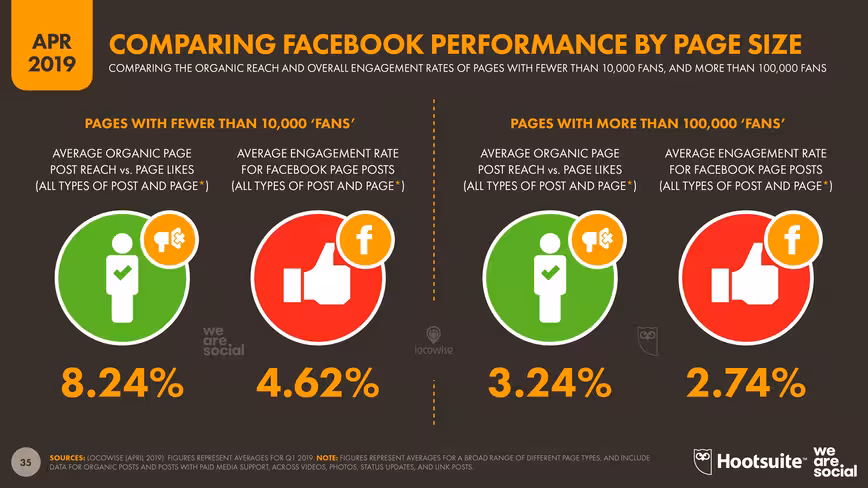
 What’s more, the figures I’ve quoted above are the averages for all kinds of pages and page sizes. Once we focus in on pages with 100,000 fans or more, the figures for organic reach and engagement are even lower still.
 However, it seems that Facebook’s decision to throttle organic reach continues to drive the platform’s commercial success, with more and more pages turning to promoted posts to make up for these declines.
Locowise reports that more than a quarter of the Pages that it tracks invest in some form of paid promotion, which would indicate that – globally – more than 20 million businesses now invest in Facebook’s paid media products.
2. Instagram
Facebook has made the same definition changes in its reporting of Instagram audiences, and – interestingly – this has resulted in similar patterns to those we saw above for Facebook.
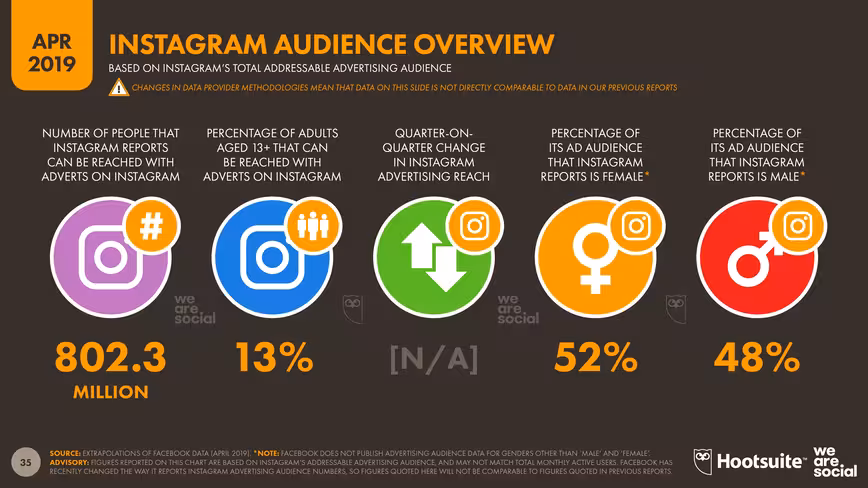
Instagram announced that it had passed the billion active accounts milestone back in June 2018, but the latest figures in Facebook’s self-serve advertising tools suggest that the company only showed adverts to 802 million Instagram users in March 2019.
 Frustratingly, the changes in Facebook’s audience definitions make it difficult for us to report on one of the most interesting trends that we’ve been tracking over recent months: an apparent decline in the use of Instagram amongst younger users.
However, the good news is that data that we do have still tell an interesting story.
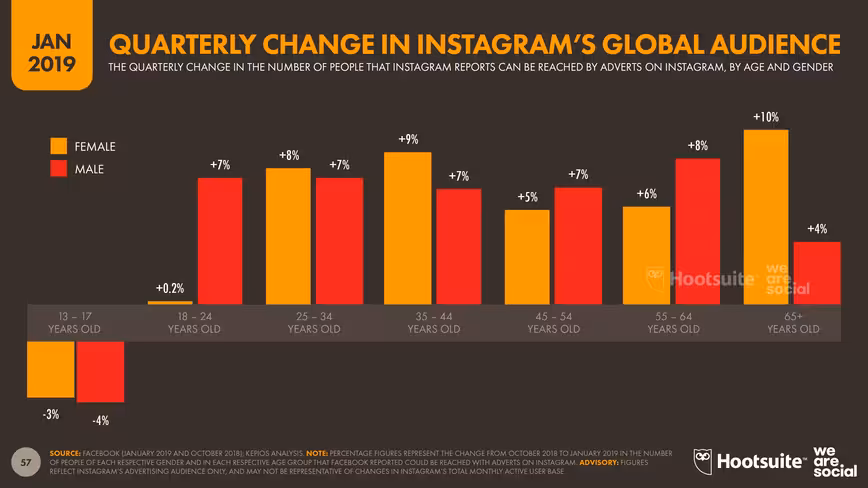
Despite media speculation that teenagers have been flocking to Instagram in recent months, the advertising audience data that we collected prior to the recent change in Facebook’s audience definitions show that the number of Instagram users aged 13 to 17 actually fell by more than 3 percent between October 2018 to January 2019.
But as you can see in the chart below, it’s only this younger group that’s affected; all other age groups showed very healthy growth, and overall, the size of Instagram’s advertising audience actually increased by more than 4 percent during the same period (October 2018 to January 2019).
 Because of those recent definition changes, we’re unable to identify whether this trend has continued since January. However, we’re hopeful that we’ll be able to offer an update to this story as part of our Q3 report in July.
The definition changes have revealed some interesting new insights, though. By comparing the relative changes in audience sizes, we’ve been able to identify that advertisers have been disproportionately targeting Instagram’s younger, female users, which has likely led to an increase in the number of sponsored posts that these specific users have been seeing.
The available data don’t show whether this increase in advertising has contributed to the decline in Instagram’s younger users that we explored above, but it’s certainly a provocative hypothesis. If this were indeed the case, the Instagram team would face the awkward conundrum of whether to reduce the amount of advertising it shows to these audiences, sacrificing short-term growth in order to keep these valuable younger audiences for the longer term.
But – perhaps more importantly – if Instagram is losing younger audiences, the big question is: where are they going?
As usual, there’s plenty of speculation here, so let’s look at what the data tells us…
3. TikTok
In my recent conversations with senior marketers, journalists, and even the world’s biggest investors, it’s clear that many people believe TikTok is “the next big thing” in the world of social.
And with the company already claiming more than 500 million active users – and more than a billion downloads – it’s easy to see why.
TikTok doesn’t publish audience figures to the same level as peers like Snapchat and Instagram though, so we need to look at some different data sources to get a sense of TikTok’s current status and growth.
A good place to start is Google Trends, which shows that worldwide interest in TikTok has grown significantly over the past year.
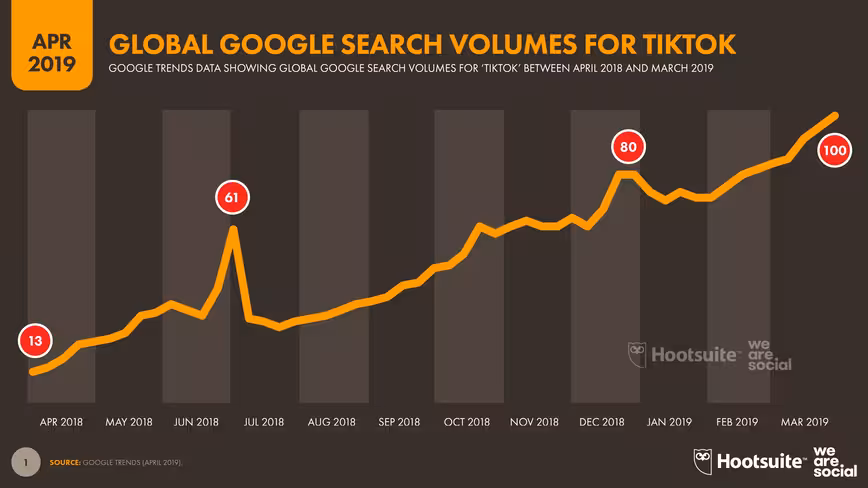 The Google Trends data clearly shows the extent to which Tik Tok has captured people’s attention, and that it’s still gaining momentum.
But how does the platform compare to its peers? Google Trends data shows that worldwide interest in TikTok is already on a par with Snapchat (note that the TikTok trendline in the chart below also includes searches for “Tik Tok” – i.e. with a space – which appears to be a common variation in spelling for searches relating to the platform).
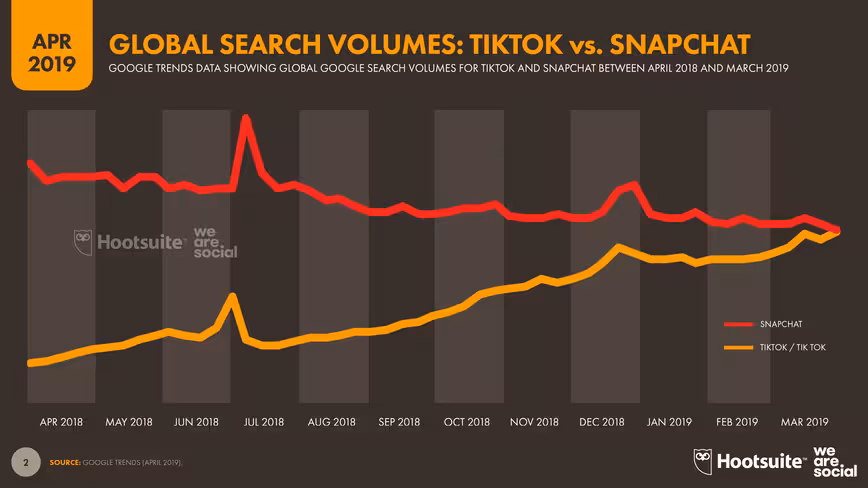 TikTok still has a long way to go before it can match global search volumes for Instagram though, which are currently between 15 and 20 times greater than search volumes for TikTok.
The data I’ve been exploring don’t always tell a good story for TikTok, either. Some app download trends tell very different stories to those we see in the Google Trends numbers above, with some even suggesting that we may have passed ‘peak TikTok’ in key Western markets.
For example, the chart below tracks TikTok’s position in App Annie’s daily download rank for all apps in the iPhone app store in the UK and USA between January 20 and April 19 in 2019, and the trendlines tell a clear – and somewhat worrying – story.
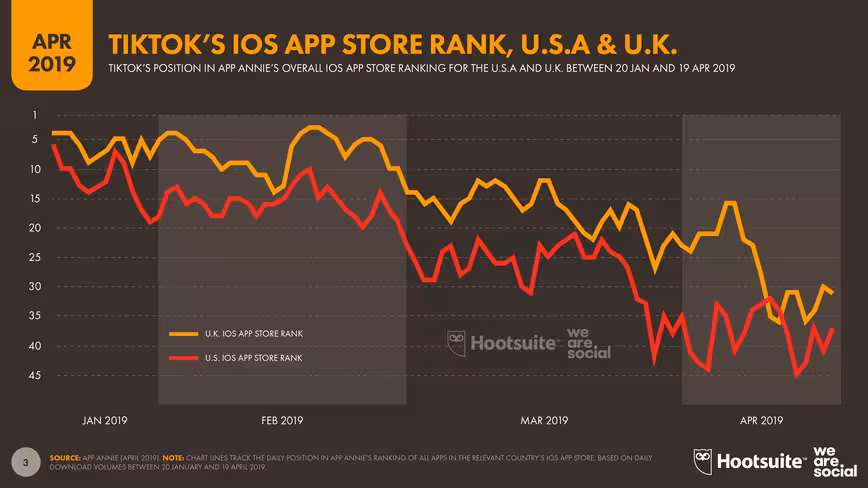 These trendlines are just for two markets though, and TikTok’s overall download figures for the first quarter of 2019 make for much happier reading for ByteDance and its investors.
SensorTower reports that TikTok added 188 million new users in the first three months of this year, and the company ranks the app as the number one top performer in Apple’s iOS app stores for Q1 2019.
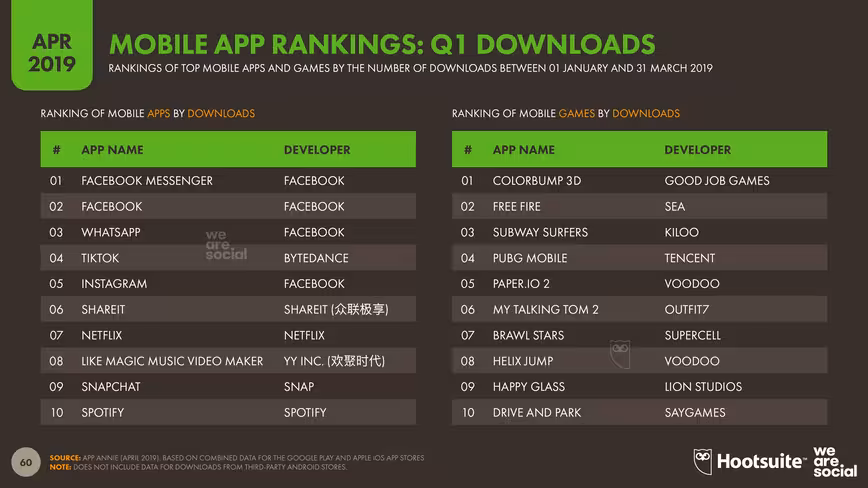
Meanwhile, App Annie reports that TikTok ranked fourth overall in the world’s most downloaded apps across iOS and Google Play stores for the whole of Q1.
That puts TikTok behind Facebook, Messenger, and WhatsApp, but ahead of Instagram:
 However, the Indian government’s recent order for both Apple and Google to remove TikTok from their app stores may have important consequences for the app’s growth over the coming months, especially in light of reports that India may account for more than a quarter of the app’s worldwide downloads to date.
4. Snapchat
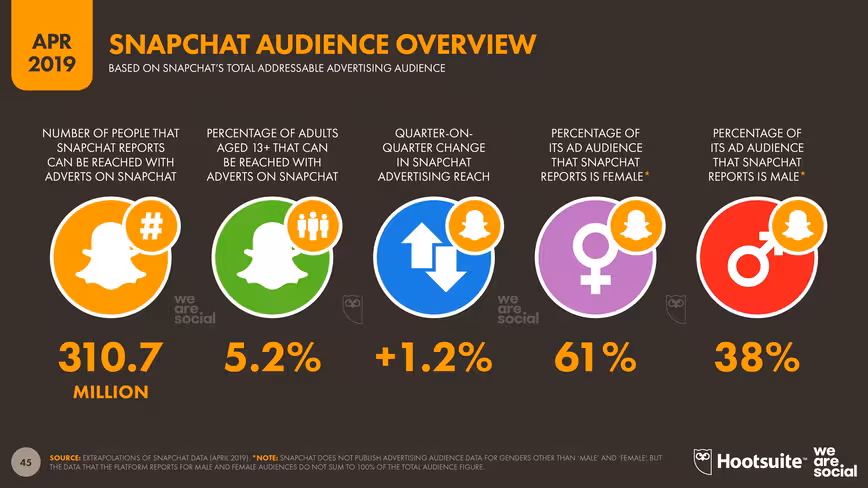
After a worrying start to the year, Snapchat saw some more reassuring trends in its advertising audience numbers this quarter, with the platform’s total addressable audience growing by 1.2 percent since January.
 India accounted for almost a quarter of the growth in Snapchat’s audience over the past three months, which correlates to the surge in internet adoption across the country that I reported in the internet section above. However, given the Indian government’s recent decision to block TikTok, Snapchat will need to keep a close eye on the political climate within this key market.
Snapchat also saw disproportionate growth in Russia this quarter, with the platform’s audience in the country up by almost 8 percent in the past three months.
Interestingly, Snapchat’s self-serve advertising tools also report a slight increase in the size of the platform’s audience in the United States – a finding which seems to go against media speculation that the platform would see declines in its US user base this year.
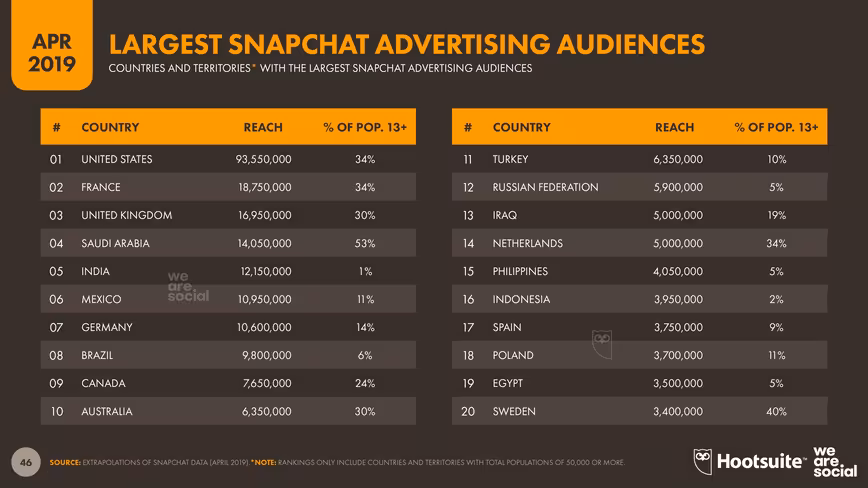 The data alone don’t reveal the cause of this reversal in Snapchat’s fortunes, but there’s a possibility that recent improvements to the platform’s Android app have revived interest among previously frustrated users.
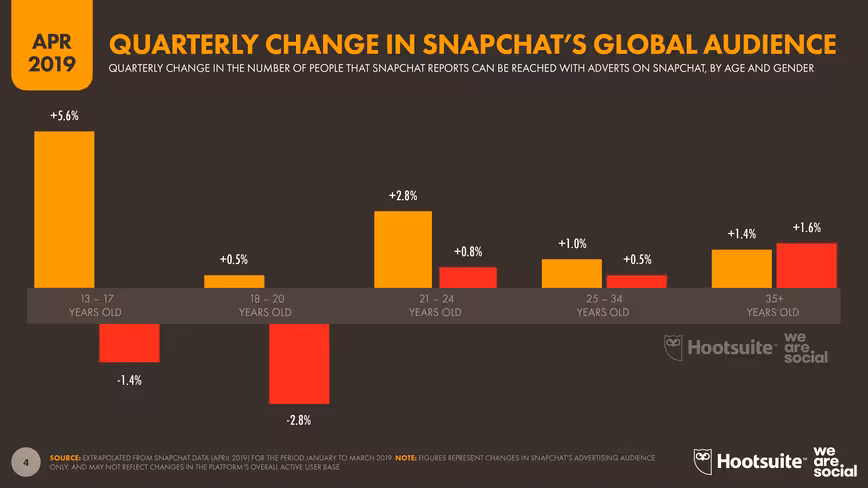
It’s not all good news for Evan Spiegel and team, though. Snapchat saw its male audience decline by an average of 0.3 percent over the past three months, with males aged 13 to 17 down by 1.4 percent during the same period, and males aged 18 to 20 down almost 3 percent.
However, this was more than offset by the growth in female audiences. Overall, the number of women that advertisers can reach on Snapchat has grown by more than 2 percent since January, while the number of women aged 13 to 17 has grown even faster – up 5.6 percent in just three months.
5. Twitter
The figures that Twitter publishes in its self-serve advertising tools tend to fluctuate significantly – even over short periods of time – which can make it trickier to identify precise trends for the platform.
However, the latest data suggest that Twitter also saw overall growth in its advertising audience in the first three months of 2019, with the global addressable audience up by 4.5 percent since January.
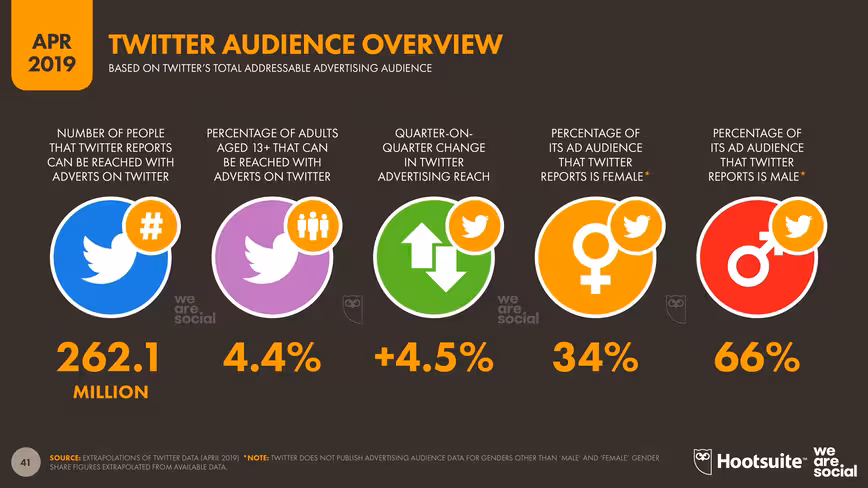 Twitter’s largest reported gains were in Russia, where the platform’s advertising audience grew almost five times over the past three months, up from just over two million in January to almost 10 million at the time of writing.
Meanwhile, Twitter’s self-serve advertising tools also show an audience increase of almost 2.5 million in the United States, equating to quarter-on-quarter growth of more than 5 percent.

6. LinkedIn
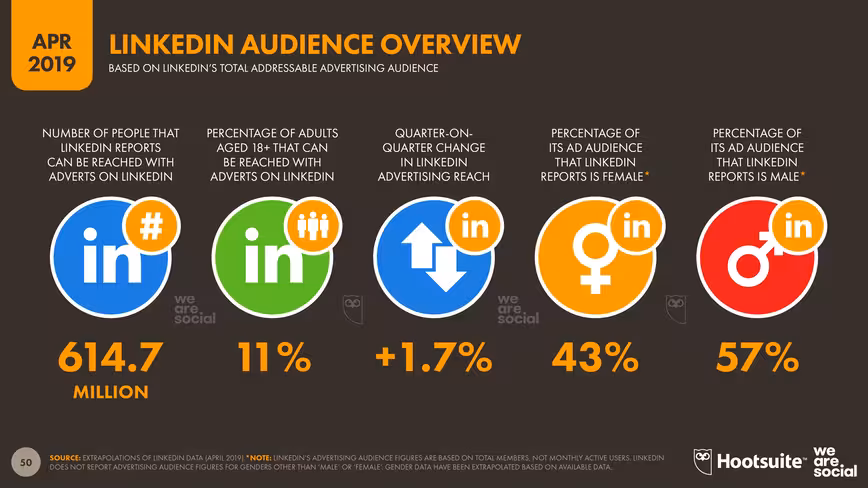
The world’s most active professional social network saw good growth again in the first quarter of 2019, with the platform’s self-serve advertising tools reporting an increase of 1.7 percent in its total addressable audience.
Advertisers can now reach almost 615 million people on LinkedIn, although it’s worth highlighting that these figures are based on registered users, rather than the monthly active user figures reported by most other platforms.
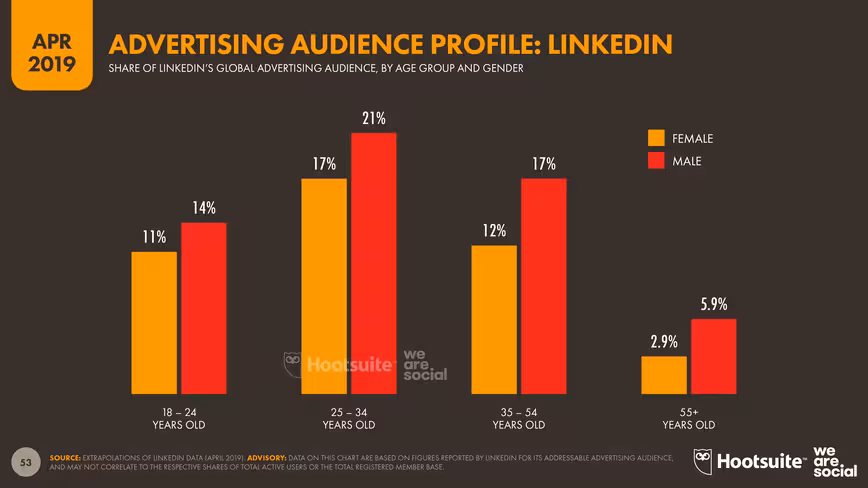
 Interestingly, the quarter-on-quarter trends suggest that LinkedIn is growing fastest among the 18 to 24-year-old group, who now account for roughly 25 percent of the platform’s total advertising audience.
7. Discord
Discord is a new entrant to our ranking of the world’s most active social platforms, having recently exceeded a quarter of a billion active users.
Discord is a messaging platform that’s hugely popular with the world’s billion-plus online gamers, which should be more than enough reason for marketers need to add it to their list of potential opportunities.
However, it’s Discord’s focus on communities that makes it particularly interesting as a platform, especially in a world where privacy concerns are increasingly important drivers of people’s social media preferences and behavior.
 Reports suggest that Discord is growing at a rate of roughly 2.5 million users every week, but I expect we’ll see that figure increase over the coming weeks as the platform gains awareness and momentum beyond its current core user base of gamers.
Perhaps more importantly than growth, however, Discord’s compelling blend of interest-based communities – or ‘servers’ – together with its public and private messaging, mean that Discord may well have a disproportionate impact on how the overall social media landscape evolves in the coming months.
In particular, given Mark Zuckerberg’s penchant for ‘taking inspiration’ from other platforms’ features, I wouldn’t be surprised to see various elements of Discord’s architecture appear in the more privacy-focused offerings he promised in a recent announcement.
If you’re new to Discord, or if you’d like a handy explainer, check out this great overview video from CNBC, complete with excellent stats and founder interviews:
Mobile use in April 2019
Our partners at GSMA Intelligence have revised their historical data for unique mobile users since January, but the worldwide total has since returned to the figure of 5.11 billion that we reported in our Digital 2019 report.
After the revisions, GSMA Intelligence reports that unique mobile users have grown by roughly 2.6 percent over the past twelve months, equating to an additional 130 million new mobile users since this time last year.
Note that we’ve changed the way we report mobile subscriptions too, and the 7.787 billion figure we’re quoting in this quarter’s report no longer includes IoT connections.
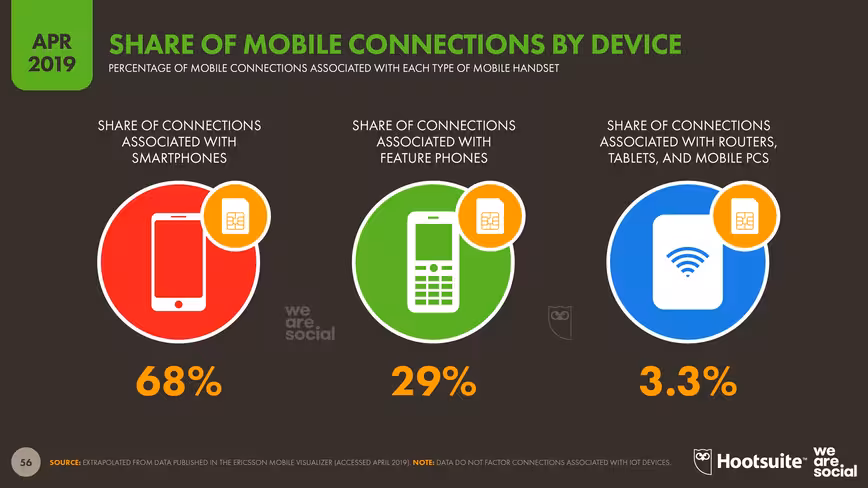
 The latest data from Ericsson shows that smartphones now account for 68 percent of mobile connections, with feature phones’ share of connections dropping below 30 percent for the first time.
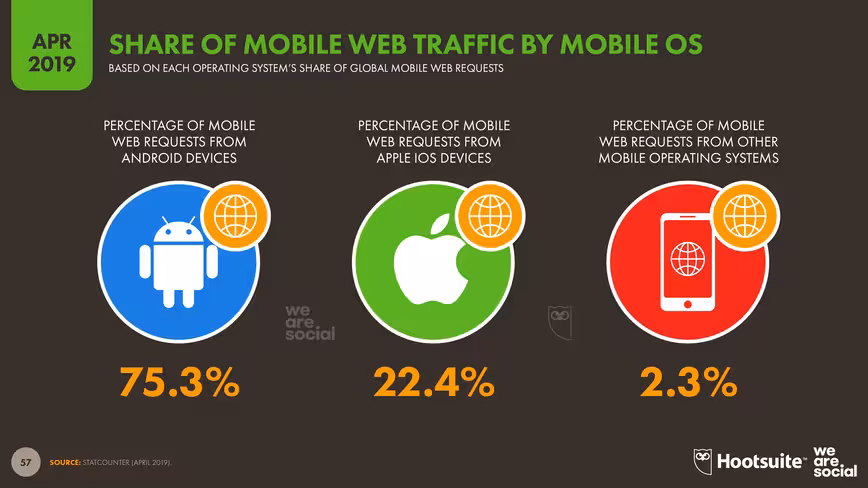
 Meanwhile, Android has strengthened its control of the mobile market, with the latest data from Statcounter showing that the Alphabet-owned operating system accounted for more than three-quarters of all mobile handsets that access the web in March 2019.
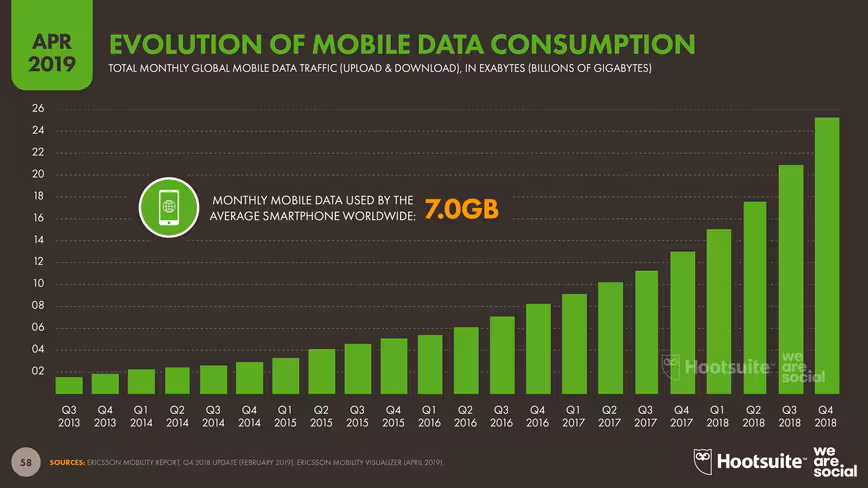
 Our addiction to mobile data shows no signs of slowing either, with Ericsson reporting that monthly data consumption grew by an average of more than 4 billion gigabytes over the last quarter of 2018, to reach 25 exabytes per month.
Making sense of the future
Hopefully all that data has given you an excellent perspective on the state of digital in April 2019. However, it’s only when we act on data that it can start to deliver value.
That’s not always easy though, so if you’d like some help translating all of these numbers into sharper insights and more actionable tips, you’ll want to join me at the TNW Conference in Amsterdam on May 9 and 10.
I’ll be delivering the closing keynote on the Re:brand stage at the end of day one, and I’d love to see you there, so go grab your tickets now.
Get the TNW newsletter
Get the most important tech news in your inbox each week.