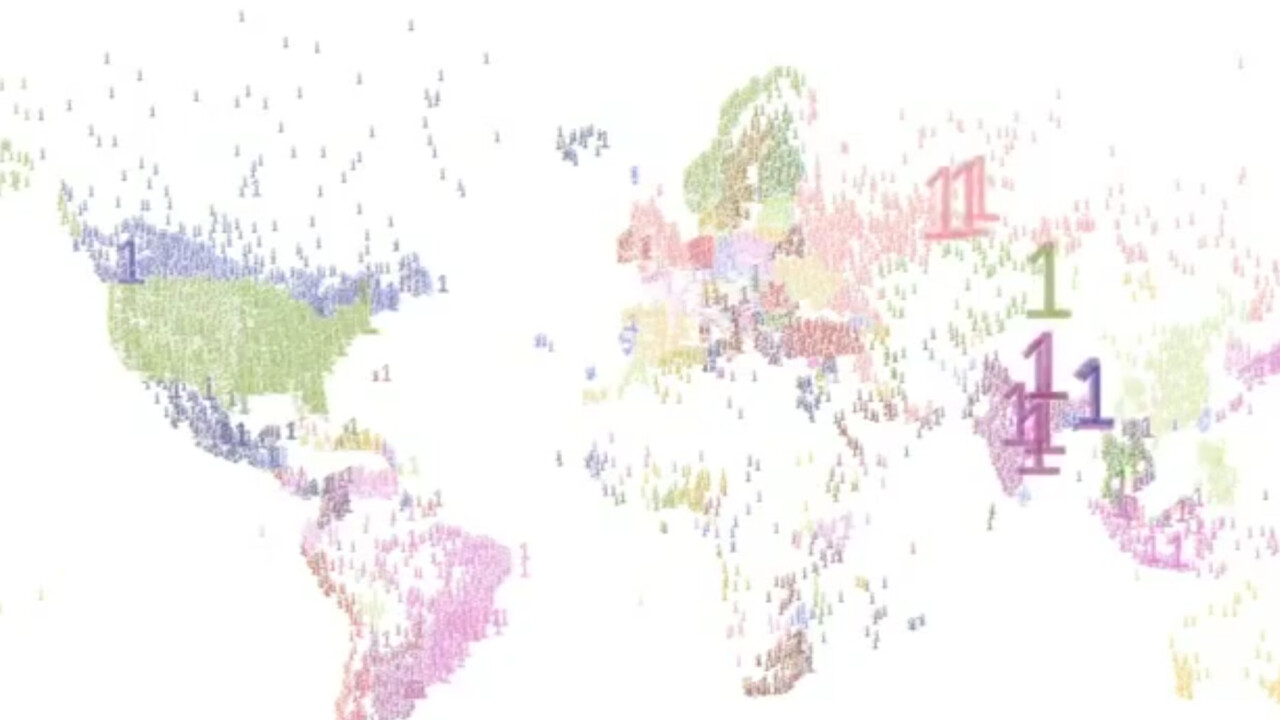
Twitter has posted up a new video that visualizes every Tweet sent last Friday that mentioned the term 11:11 on 11.11.11. The binary alignment of the data and time seemed to enthrall people for some reason, and my timeline was flooded with mentions of it all day.
This video puts together all of the mentions of this ‘momentous’ occasion and spins it into a visualization that shows how those tweets spread across the globe.
The first right-to-left wave is when the day clicked over to the 11th and people began talking about it on Twitter. This moves roughly with the dateline + a couple of hours, as people wake up and begin using Twitter.
The second wave is as the clock hit 11 and all of the numbers fell into place.
It’s an interesting look at how an event that is based on a certain date or time makes its way around the globe, and shows you that Twitter really does act as a sort of realtime pulse of the planet.
Twitter has shown off the worldwide flow of Tweets around events like the earthquake in Japan before, which reveal a different kind of ebb and flow.
Get the TNW newsletter
Get the most important tech news in your inbox each week.


