A collaboration between two professors – one of music and one of engineering – at Virginia Tech resulted in the creation of a new platform for data analysis that makes it possible to understand data better by turning it into sound.
This is a pioneering approach to studying spatially distributed data which instead of placing information into a visual context to show patterns or correlations – meaning, data visualization – uses an aural environment to leverage the natural affordances of the space and the user’s location within the sound field.
Funded by the National Science Foundation, the work combines elements of music, geospatial science, computer science, and human-computer interaction. It’s the first time a research project led by a faculty member from the university’s School of Performing Arts working in collaboration with the College of Engineering
Ivica Ico Bukvic, associate professor of composition and multimedia in the College of Liberal Arts and Human Sciences, and Greg Earle, professor of electrical and computer engineering, used unique infrastructure provided by the Institute for Creativity, Arts, and Technology to investigate how immersive sound can be used to develop a better understanding of complex systems.
“Identifying new time and space correlations between variables often leads to breakthroughs in the physical sciences,” explained Dr. Bukvic, who also serves as a senior fellow for the Institute for Creativity, Arts, and Technology. “It makes sense that we would want to go beyond two-dimensional graphical models of information and make new discoveries using senses other than our eyes.
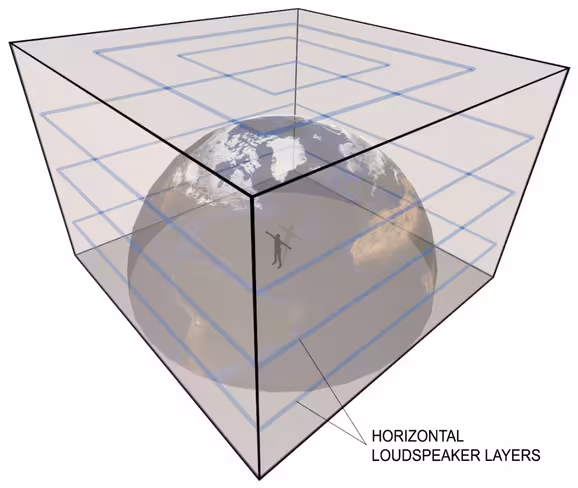
Titled “Spatial Audio Data Immersive Experience (SADIE),” the project is the first large-scale endeavor focusing on immersive spatially-aware sonified data using a high-density loudspeaker array. The research will focus on the earth’s upper atmospheric system, which features physical variables that are spatially and temporally rich. Each of the data sets associated with this system will be represented by distinct sound properties, such as amplitude, pitch, and volume.
These sounds will be played through a 129-loudspeaker spatially distributed immersive sound system in the Cube, located in the Moss Arts Center. A combination of performance space, research laboratory, and studio, the Cube is a collaborative research facility at Virginia Tech where researchers, composers, and musicians are uncovering new possibilities in immersive sound.
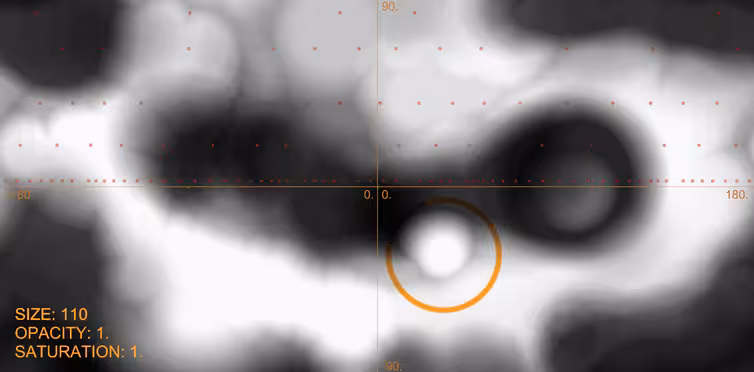
Using the Cube’s motion capture system, similar to the interface imagined for the film Minority Report, participants will be able to navigate the sonified data using a gesture-driven interface, which will allow them to rewind, fast-forward, rotate, zoom, amplify, speed up, and slow down the data playback. The system will also be used to capture critical user study data.
Allowing the brain’s innate signal processing mechanisms to identify specific features in complex data sets is a logical way to link computational sciences with human sensory perceptions. This merging of technology and nature could further current analysis techniques and foster new breakthroughs involving complex systems in science, with the potential to produce new technologies designed to spur creativity,” concludes Dr. Bukvic, who says that if this approach to experiencing data can be proven to improve people’s understanding of complex relationships in physical systems, it could be applied to other fields of study:
“It could have applications to fields such as thermodynamics, quantum mechanics, and aeronautical engineering; help advance visualizations and virtual reality systems; and create interdisciplinary bridges between scientific communities, including music, computing, and the physical sciences.”
Get the TNW newsletter
Get the most important tech news in your inbox each week.