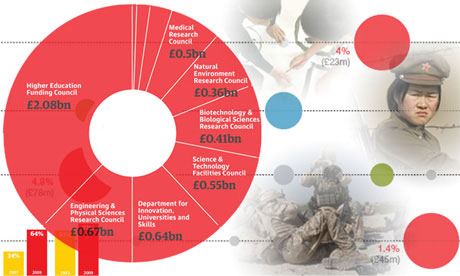
Who doesn’t love infographics? Today, The Guardian, a British national daily newspaper and website launches its “Data journalism” site as a new way to visualize content and understand the news.
[Journalism is] going to be about poring over data and equipping yourself with the tools to analyse it and picking out what’s interesting. And keeping it in perspective, helping people out by really seeing where it all fits together, and what’s going on in the country. Tim Berners-Lee
Visualizing data is so much easier and more pleasurable than poring over paragraphs of description or even worse- spreadsheets. But they take a lot of work, both in data gathering and in design. It’s fantastic that the Guardian is dedicated an entire site to this effort. Its site will include “key data of the day,” their “pick of the data blogosphere,” world government data and featured apps.
Get the TNW newsletter
Get the most important tech news in your inbox each week.