Unless you’re using cryptocurrencies already, it’s hard to know just how much Bitcoin changes hands online.
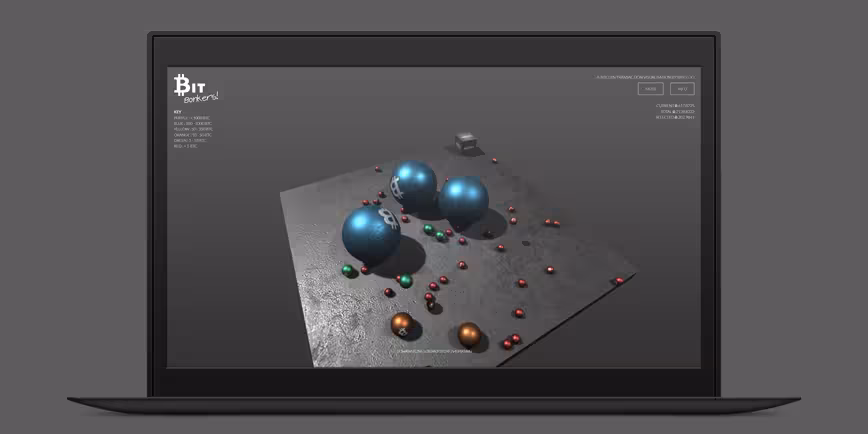
A new WebGL project called Bitbonkers visualizes Bitcoin transactions from the blockchain using 3D shapes that land on a tile in space.
The cubes represent blocks or collections of transaction records and their size varies depending on the number of bytes it contains. The colored balls represent transactions of different denominations.
You can click on them to see the value of each transaction and hit the space bar to clear the tile if it gets too crowded. It looks gorgeous, but you’ll want to check it out in Chrome for the full effect.

The 💜 of EU tech
The latest rumblings from the EU tech scene, a story from our wise ol' founder Boris, and some questionable AI art. It's free, every week, in your inbox. Sign up now!
If Bitbonkers sounds familiar, it might be because you’re thinking of Bitlisten, another visualization which lets you hear gentle tones generated by Bitcoin transactions and see them as bubbles floating across your screen.
Get the TNW newsletter
Get the most important tech news in your inbox each week.