Medium has today unveiled a handy tool called Charted for making beautiful charts in a few seconds.
The company says that Charted was built as an internal tool by the Product Science team at Medium to help “analyze data and communicate our findings with the team.”
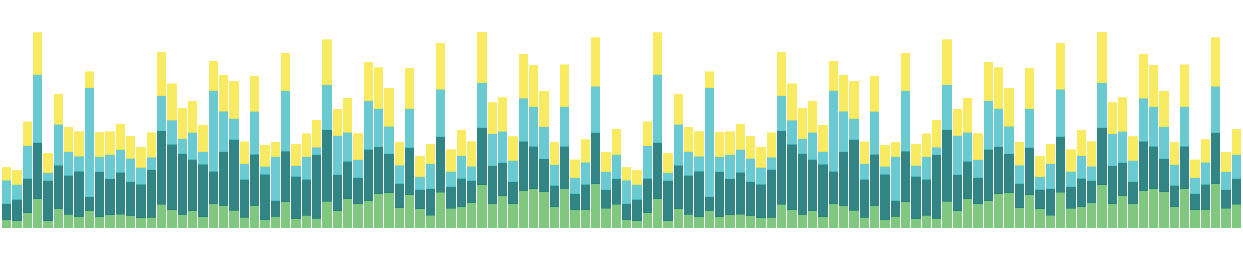
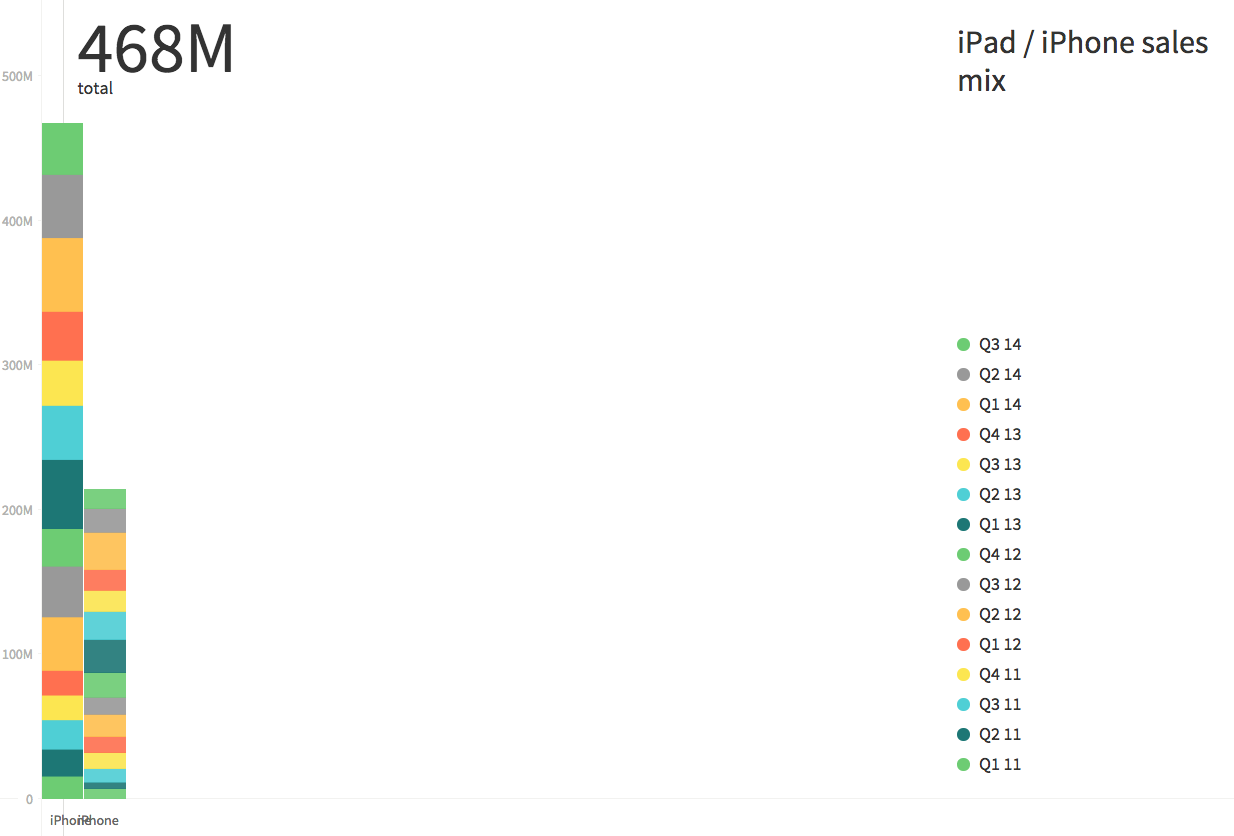
It’s as simple as giving Charted a CSV file or a link to a Google Spreadsheet and the tool does all the graphing work for you. I threw in a spreadsheet I keep of Apple’s sales mix for iPhones and iPads and Charted spat out a fairly useful graph in seconds.
 Charted is open source and available for anyone to use for free. Medium says that Charted does not store or adjust any data and is also “not a formatting tool” so it is “deliberately sparse in features.”

The 💜 of EU tech
The latest rumblings from the EU tech scene, a story from our wise ol' founder Boris, and some questionable AI art. It's free, every week, in your inbox. Sign up now!
➤ Charted
Get the TNW newsletter
Get the most important tech news in your inbox each week.