I suspect most photographers have a decent grasp on the cameras they use and what kind of shooting they tend to do. But to see it quantified, complete with charts and graphs, may be a little jarring — though educational.
If you’re interested in what your Lightroom catalog reveals about your shooting habits and methodologies, have a look at the new Lightroom Dashboard, a free online utility that you can access directly from your browser.
The dashboard was built by San Francisco-based software engineer Cheyne Wallace, a photography enthusiast. He states in the About section of the site, “I built this tool so I could better understand my photography habits and possibly justify to myself purchasing that new f/2.8 lens (as it turns out, I can’t).”
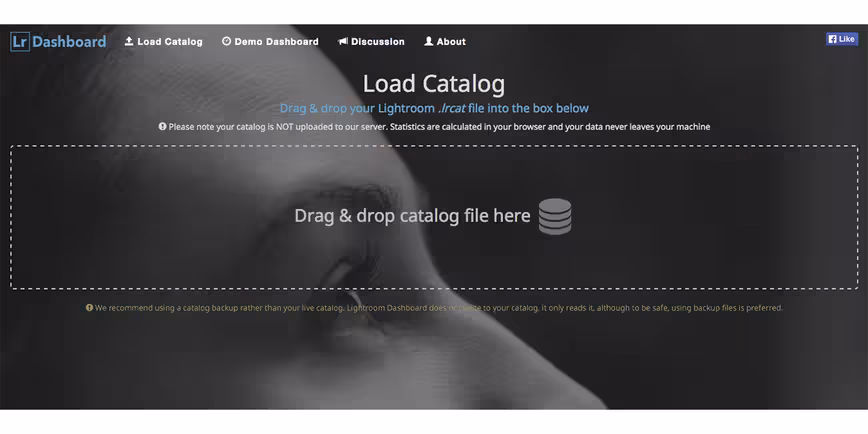
Just drag and drop your lrcat file into the window, and the algorithm will immediately display your camera statistics in visually appealing charts and graphs based on your library.
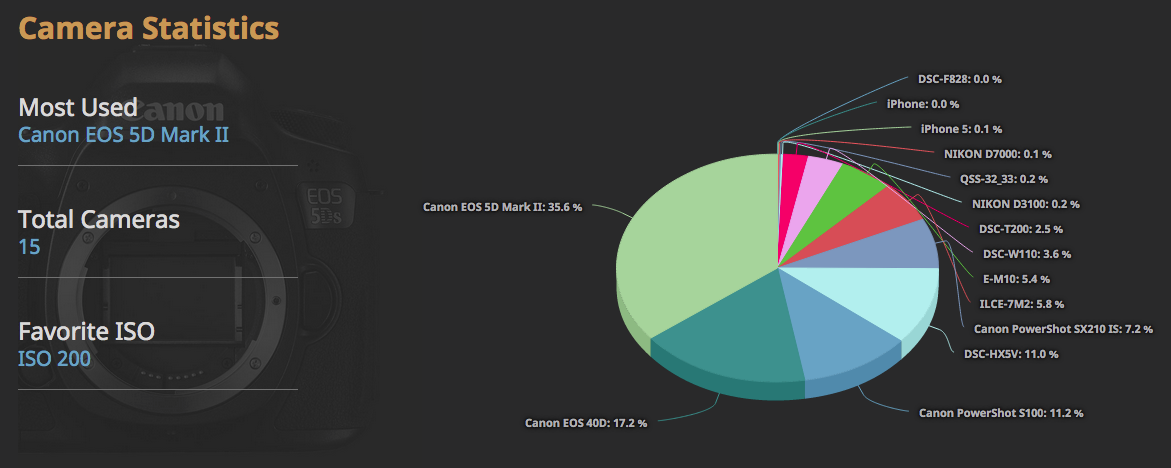
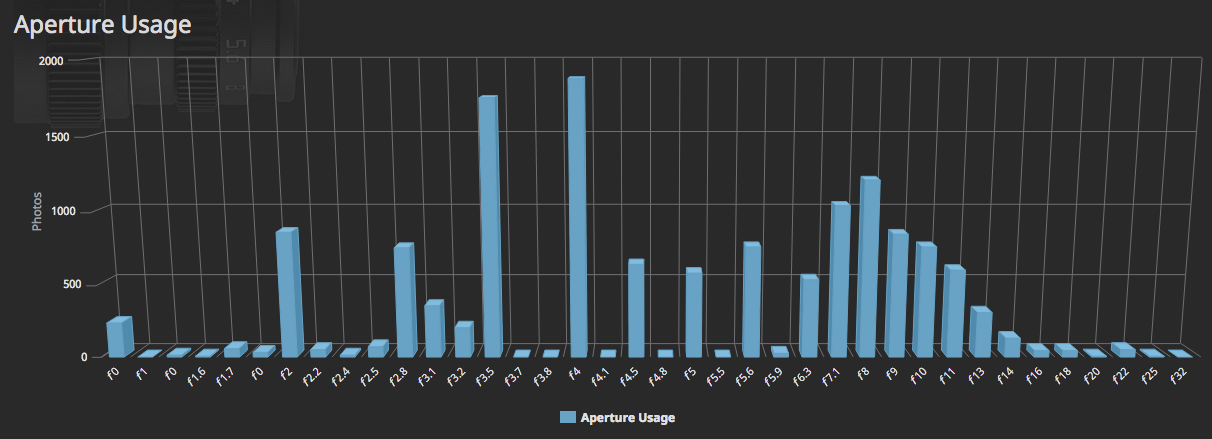
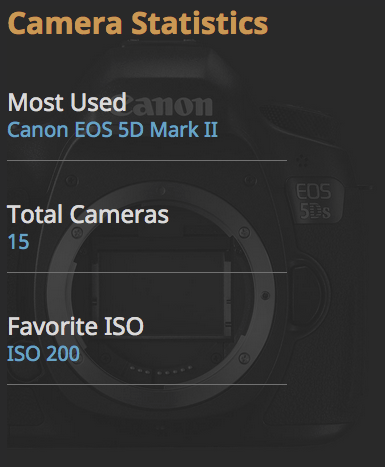
It gives you photo volume by month, statistics like your most-used camera and the number of cameras you have shot with from that library. It can read your favorite ISO and divulge your general ISO usage. It also tells you your most-used lens, favorite aperture and focal length usage.
File statistics include the total number of files in your catalog, formats and bit depths of your photos by percentage and favorite resolution.
While the Lightroom Dashboard was built as a “side project,” and Wallace is offering it to the community for free, he leaves open the possibility of further development, and accepts donations on his website, if you’re interested in supporting it.
I found the information fascinating, as I normally do not keep tabs on this sort of thing. And while it’s not something most people will take to heart, it might propel some in the direction of using a different camera or shooting different subjects, just to shake things up.
I tested this utility in Chromc and Safari on the Mac, and it worked fine in both, though your mileage may vary. Meantime, check out the demo dashboard to see the whole picture.
➤ Lightroom Dashboard Can Help You Visualize Your Photography Habits [PetaPixel]
Read next: Grids for Instagram desktop app arrives on Windows
Get the TNW newsletter
Get the most important tech news in your inbox each week.