
Developers using Google Cast were left with a lot of blind spots when it came to user behavior. Now, the company is introducing a new visualization tool in the Google Cast Developer Console.
It’s fairly robust, too. Google is tracking several points of interest — how many devices have launched an application, sessions and average playback time — with options for viewing them by region, sender platforms or total.
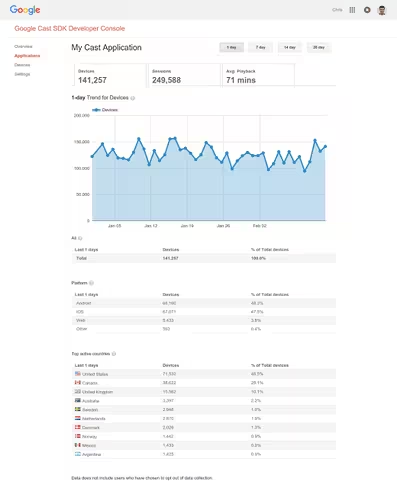
Each tab can be viewed in seven, 14 or 28-day rolling totals. If you want a more detailed look, there’s also a daily usage view.
As Cast becomes useful for more devices and within more apps, this developer console view is a timely addition from Google.
➤ Introducing Analytics for Google Cast Applications [Google Developers]
Get the TNW newsletter
Get the most important tech news in your inbox each week.