
Facebook has launched two public dashboards today that show almost real-time information for power usage effectiveness (PUE) and water usage effectiveness (WUE) in two of its data centers.
Users can log-in to see these two crucial metrics, alongside the external humidity and temperature, for Facebook’s data installations in Prineville, Oregon and Forest City, North Carolina.
The data is remarkable and is displayed in a way that is simple for anyone to digest. The figures down the right-hand side show the current PUE and WUE levels, and will update automatically once the counter in the top left-hand corner refills.
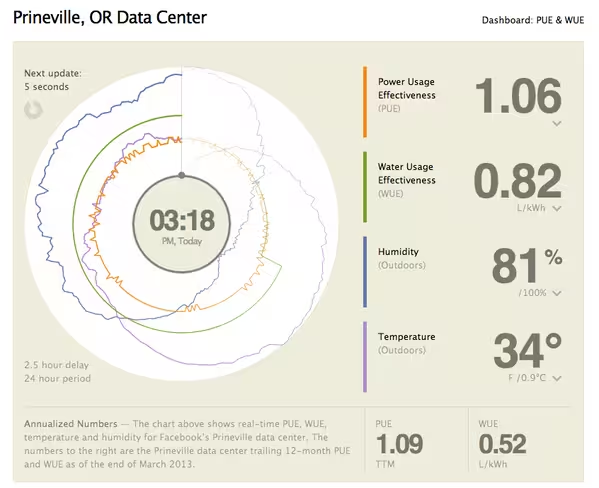
The circular graph at the top of the page is particularly revealing, however, because it provides some context for the ongoing levels. Rolling over the graph will move the needle back and forth, displaying updated figures for earlier in the day.
The data can be pulled back by up to 24 hours, although it’s worth noting that the ‘real-time’ metrics on the right-hand side run on a two and a half hour delay.
Despite this considerable lag, Facebook should be commended for providing its users with such transparency. The company first released PUE information for its Prineville data center in the second quarter of 2011, following it up with some WUE data in the summer of 2012.
On both these occasions, Facebook only provided annualized averages. These are still prevalent in the new, public dashboards, however, and will be updated as necessary.
‘Far from straightforward’
Lyrica McTiernan, a program manager for Facebook’s sustainability team, said building the dashboards was far from straightforward. Part of the problem is that the data centers haven’t been completed yet; suites are still being installed and building management systems are yet to be tested.
It’s a work in progress, which makes the publication of such data even more commendable.
“All our data centers are literally still construction sites, with new data halls coming online at different points throughout the year,” she said.
“Since we’ve created dashboards that visualize an environment with so many shifting variables, you’ll probably see some weird numbers from time to time. That’s OK. These dashboards are about surfacing raw data – and sometimes, raw data looks messy.”
So expect Facebook to mess up. McTiernan says she welcomes users to look “behind the curtain” with how the data centers operate, but to appreciate that fluctuations and minor problems might occur. This is the real world, after all, and mistakes happen.
Google has published the PUE figures for its own data centers since 2008. Such releases are only available every quarter, however, which is a far cry from the real-time information that Facebook is aiming for.
Image Credit: Ed Jones/AFP/Getty Images
Get the TNW newsletter
Get the most important tech news in your inbox each week.