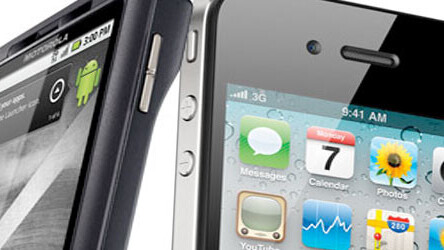
The battle between Android and iPhone has been hectic indeed. I’ve been in more than enough friendly debates with friends over which smartphone device works better than the other that I could probably fill pages upon pages with reasons. Opinions vary according to each individual user, of course, and many times, you’ll find that it’s not the smartphone itself that determines its value, but the consumers themselves.
Recently, the folks at Hunch released an infographic reporting the ways in which Android and iPhone users vary. Hunch polled 15,818 users with, “What operating system does your cellphone use?” Apple iOS ranked highest at 32%, while Android followed at 21%. Windows gets an honorable mention at 8%, while other miscellaneous operating systems combined for 23% (and 16% either didn’t know, or just plain don’t have cellphones). After crunching those responses with 80 million former poll results, they discovered a few interesting highlights about Android and iPhone users. Some of the more interesting points:
- For core demographics, more men than women are using Android (Android users are 10% more likely to be men, while 18% of iOS users are more likely to be women).
- In terms of personality, Android users are slightly more likely to be pessimists, while iOS users are slightly more likely to be optimists.
- When it comes to life experiences, Android users are 71% more likely to have never traveled outside of their native country, while iOS users are 50% more likely to have visited more than five countries.
- Regarding technology, Android users are 57% more likely to prefer an ugly device that’s full-featured, while iOS users are 122% more likely to prefer a sleek device that does just a few things.
- For actual phone usage, Android are 35% more likely to pass the time waiting in line by texting, while iOS users are 50% to more likely to text while driving.
Among other interesting notes are the types of food Android and iOS users eat, the media they consume, what they wear, where they shop, and even their favorite ice cream.
What OS is your cellphone using, and if you are an Android or iOS user, do you identify with any of the above highlights? We’re curious to hear your thoughts. See the full infographic here:
Get the TNW newsletter
Get the most important tech news in your inbox each week.


