Despite the rapid increases in digital adoption and use that we’ve seen since the start of the COVID-19 pandemic more than a year ago, the latest update in the Global Digital Reports series reveals that digital growth rates remain elevated as we move into the second half of 2021.
DataReportal‘s Digital 2021 July Global Statshot Report – published in partnership with Hootsuite and We Are Social – shows that social media continues to drive connected activity around the world, with global social media user numbers fast approaching another impressive milestone.
This quarter’s data reveals some potential challenges ahead for marketers though, with the impact of changes in Apple’s privacy policies and the rollout of the EU’s ePrivacy Directive starting to appear in some of our numbers.
You’ll find a handy summary of this quarter’s top stories in the video embed below (you can also click here), but read on below for the full report, and for my in-depth analysis of the latest essential trends.
Just before we dive into the data, I’d like to say a big thank you to the partners who make our Global Digital Reports possible: GWI, Statista, Semrush, Skai (formerly Kenshoo), SimilarWeb, Locowise, and App Annie.

The 💜 of EU tech
The latest rumblings from the EU tech scene, a story from our wise ol' founder Boris, and some questionable AI art. It's free, every week, in your inbox. Sign up now!
Full report
You’ll find the complete Digital 2021 July Global Statshot Report report in the SlideShare embed below (you can also click here), but read on past that to understand what all these numbers might mean for you.
Essential headlines
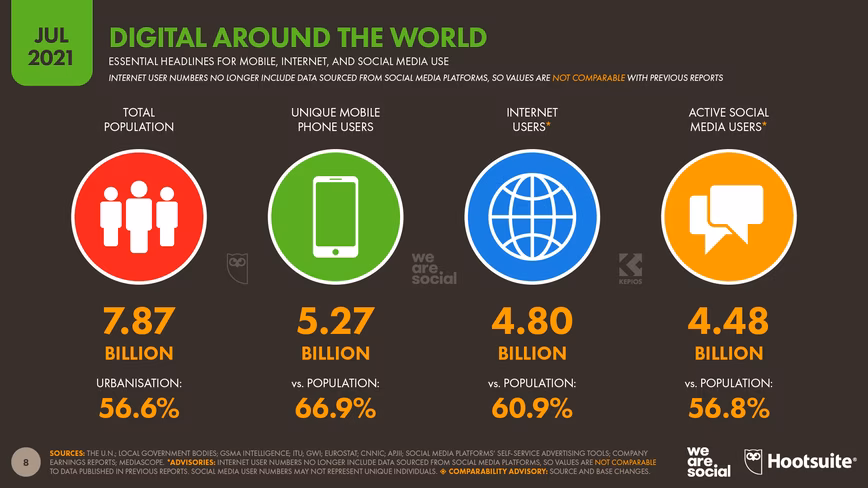
Let’s start with the key figures for digital adoption around the world in July 2021:
- Global mobile users have reached 5.27 billion, equating to just under 67% of the world’s total population.
- The number of mobile users has grown by 2.3% over the past year, increasing by 117 million in 12 months – that’s almost 10 million new users per month.
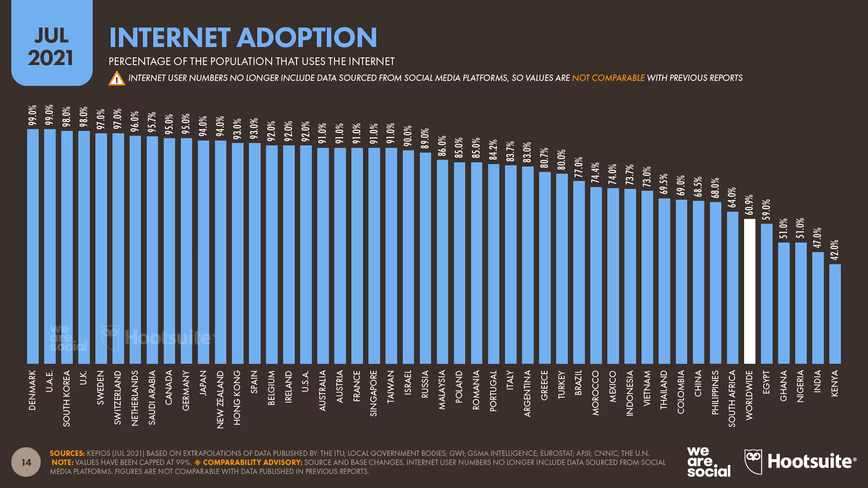
- Internet users have increased by more than a quarter of a billion since this time last year, registering year-on-year growth of close to 6%.
- There are 4.80 billion internet users around the world today, equating to almost 61% of the world’s total population.
- Social media user numbers have jumped by more than 13% since this time last year, with the latest data showing an increase of more than half a billion users in just 12 months.
- There are now 4.48 billion social media users around the world, which is equal to almost 57% of the world’s total population.
Social media growth continues
Despite COVID-19 restrictions easing in some parts of the world over recent months, the pace of growth in social media users shows few signs of slowing.
The global unique user total grew by 520 million over the past year, representing annual growth of more than 13%.
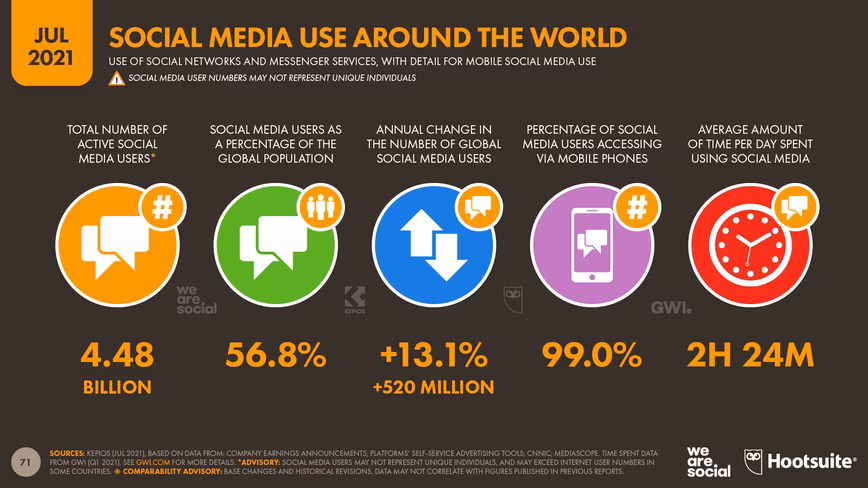
For context, that means that more than 1 in 9 of today’s social media users started using social platforms for the first time within the past 12 months.
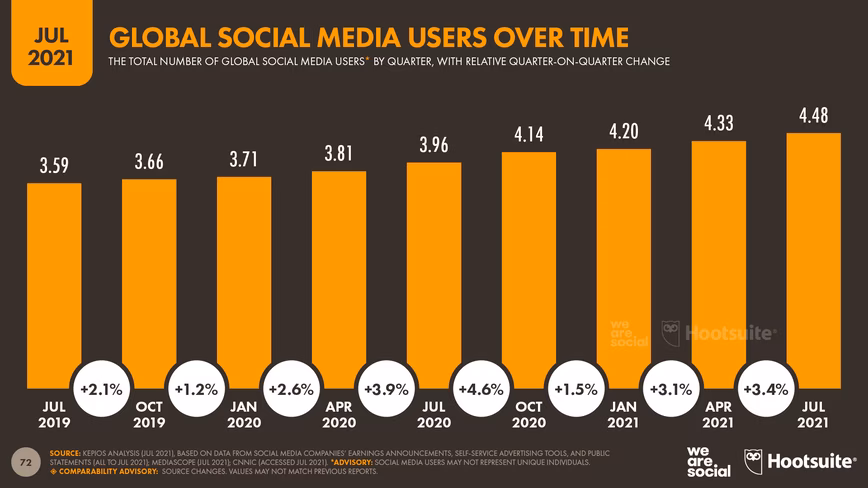
Furthermore, today’s user total is 147 million higher than it was just 3 months ago, equating to quarter-on-quarter growth of nearly 3.5%.
This is one of the fastest quarterly growth rates that we’ve reported in the Global Digital Reports series, but it’s important to stress that the latest figures have benefited from a meaningful upward correction in Facebook’s ‘family active people’ numbers.
As the company noted in its 2021 Q1 earnings announcement,
“In the first quarter of 2021, we updated our metrics calculations to maintain calibration of our models against recent user survey data, and we estimate such update contributed an aggregate of approximately 70 million [users] to our reported worldwide [total].”
However, while this correction may have inflated the latest quarterly growth rates, Facebook appears to update its models and metrics on a regular basis, so the 13% annual growth rate that we’re reporting this quarter should still be representative of actual year-on-year trends.
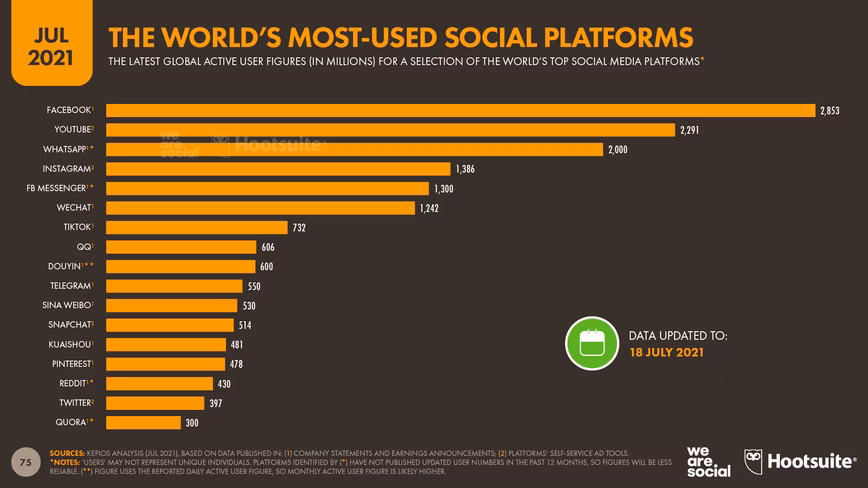
At an individual platform level, Facebook is pushing ever closer to the 3 billion monthly active user milestone, with current trends suggesting that it may reach this level by early next year.
However, the company’s investor reports indicate that roughly 3.5 billion people already use at least one of Facebook’s ‘family’ of platforms – Facebook, WhatsApp, Instagram, and Messenger.
There were no updates to user numbers from YouTube, WhatsApp, or Messenger this quarter, but the latest data from Instagram suggests the platform has enjoyed significant growth over recent months – a story that we’ll explore in more detail below.
TikTok is still keeping its latest user numbers close to its chest too, so we’re unable to report any ‘official’ updates to its monthly active user figure this quarter.
However, data from Sensor Tower indicates that the TikTok mobile app was downloaded roughly 57 million times in June 2021 alone, so there’s a good chance that the platform’s active user base continues to grow (note that we’ve removed figures for China from Sensor Tower’s total, because we treat Douyin as a separate app).
Reporting of internet user growth continues to lag
Despite the latest data showing that internet user numbers have increased by more than a quarter of a billion over the past year, it’s clear that internet user data continues to be impacted by research limitations caused by the ongoing coronavirus pandemic.
In particular, many countries in the developing world haven’t published updates to internet user numbers since the outbreak of COVID-19 more than a year ago, and these are the countries where we’d expect to see the most significant increases.
As a result, we continue to anticipate a meaningful upward correction in internet user numbers once research and reporting can return to normal.
Internet time decreases
The average amount of time that people spend using the internet each day dipped slightly in the past 3 months, compared with the values we reported in our Digital 2021 April Global Statshot Report.
Data from GWI shows that average daily internet use dropped by almost a minute per day, with people spending roughly 30 seconds less online on computers, and 30 seconds less online on mobile devices.
People are still spending close to 7 hours per day using the internet though – more than twice the amount of time that they spend watching television.
However, it’s worth noting that people have been spending more time watching television in recent months.
The ‘typical’ internet user around the world says that they watched an average of 3 additional minutes of TV per day compared to the previous quarter, which equates to more than 5 additional hours of television content over the past three months.
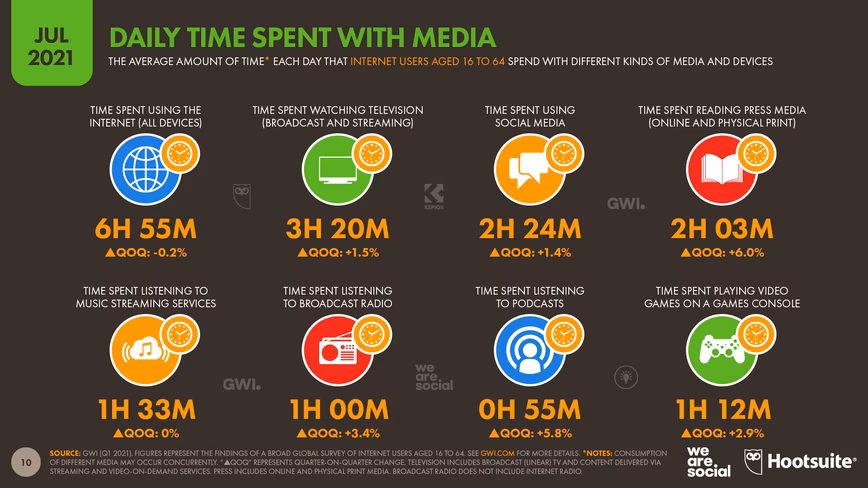
Meanwhile, despite the drop in overall internet time, people say that they’ve been spending more time using social media.
GWI’s most recent survey found that people spent roughly 2 minutes longer on social platforms each day over the past 3 months, compared to values for the previous quarter.
Interestingly, GWI also found that people have been spending more time with ‘conventional’ media in recent months.
Survey respondents’ self-reported values for time spent reading physical newspapers and magazines increased by 8.5% over the past three months, equating to an additional 4 minutes per day – faster than the increase we’ve seen for online press consumption.
Similarly, the amount of time that people say they spend listening to broadcast radio has increased by 3.5% over the past 90 days, equating to an increase of 2 minutes per day.
An increase of just a few minutes per day might not sound like a lot, but added up, these increases mean that the typical global internet user spent an additional 6 hours consuming print media over the past quarter, and an extra 3 hours listening to broadcast radio.
Social media dominates the world’s online activities
New data from GWI reveals that more than 95% of the world’s working-age internet users now use social networks and messaging services each month.
Interestingly, this data suggests that the use of social networking platforms like Facebook outranks the use of messaging services like WhatsApp, albeit only by a tiny margin.
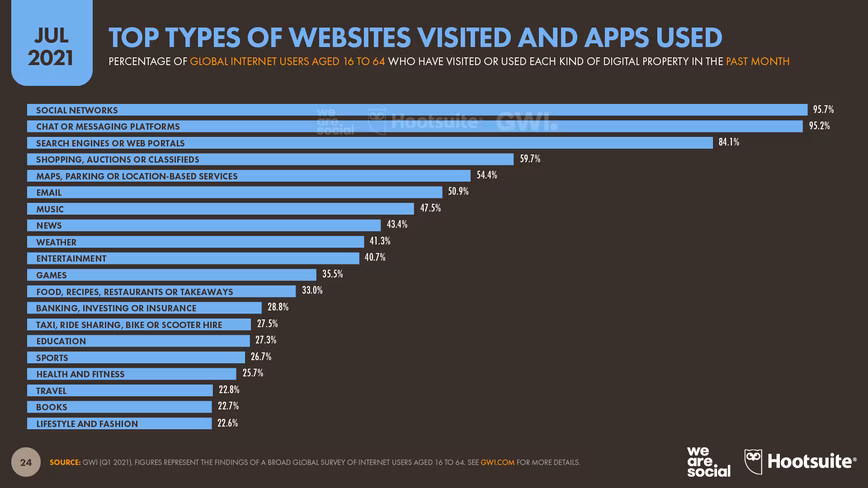
More than 5 in 6 internet users between the ages of 16 and 64 also visit search engines and web portals each month, but this figure is more than 10 percentage points lower than the figure for social networks.
Meanwhile, roughly 6 in 10 internet users say they’ve visited some kind of online shopping platform in the past month, and more than 50% of internet users say that they shop or browse for products online every week.
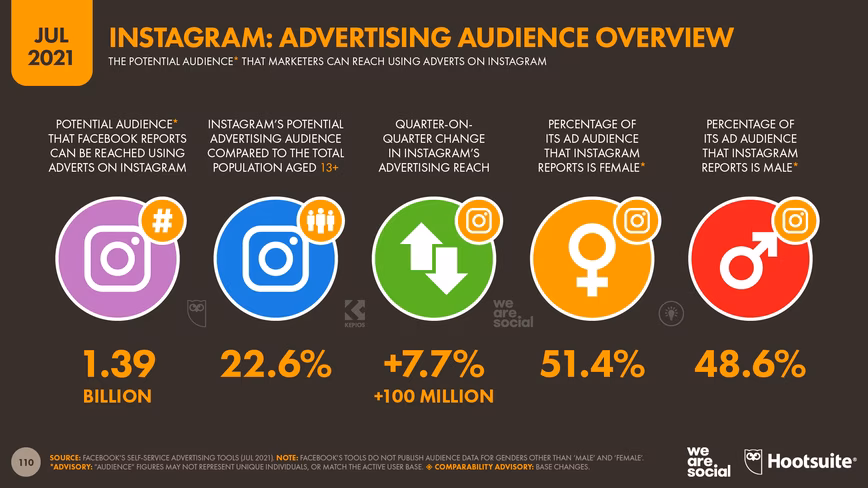
Instagram reach soars, but points to potential trouble ahead
Recent months have seen some interesting changes in the numbers that Facebook’s tools report for Instagram’s advertising reach.
Overall, these tools show that Instagram’s advertising reach has jumped by 100 million users over the past 90 days, representing quarter-on-quarter growth of more than 7.5%.
However, this growth rate is all the more impressive when we look at changes in reach figures for countries in the European Union.
For context, changes in EU legislation – including the roll-out of the ePrivacy Directive – are already starting to impact companies’ ability to target and track audiences across the EU and the UK.
As a support article in Facebook’s Business Help Centre states,
“[We]… anticipate an impact on campaigns active in the European Region. Businesses that advertise to people in the European Region might experience decreased performance… We expect that the impact will unfold gradually, over the course of several months, as additional product updates are released.”
It’s worth noting that these changes will affect all advertising platforms that are active in the EU – not just those owned by Facebook.
But despite Facebook’s expectation that the impact of these changes will “unfold gradually”, it seems they may have already started to affect Instagram’s advertising reach numbers.
Compared to the figures that the company’s self-service tools reported just 3 months ago, Instagram’s advertising reach has dropped by a whopping 5 million users (14.7%) in the United Kingdom, and by 3 million users in Italy, Germany, and Spain.
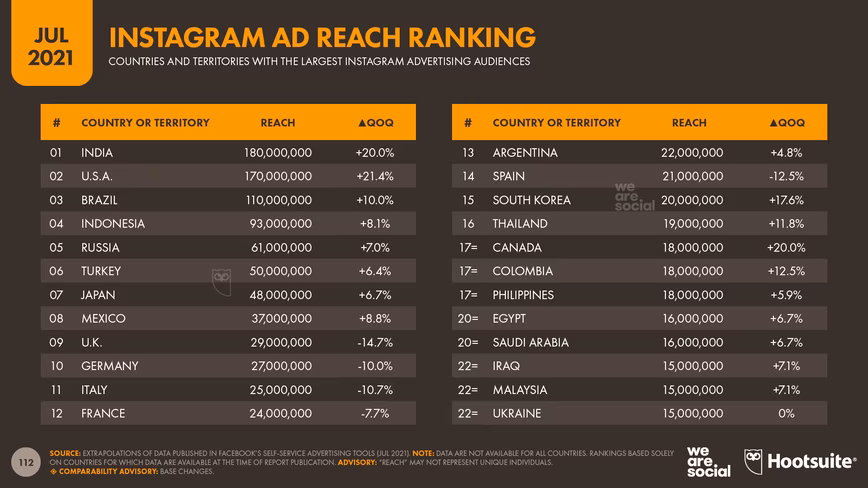
Overall, Facebook’s data suggest that advertisers can now target 25 million fewer users across Europe than they could as recently as April of this year.
However, these drops only seem to have affected countries in the EU and the UK.
It’s also critical to stress that these figures likely only affect the degree to which advertisers can target ads to users in Europe, and they most likely do not represent a drop in actual users.
Indeed, given the rapid growth in Instagram’s reach across all other markets over the past three months, there’s every chance that Instagram has grown its active user base in Europe since April.
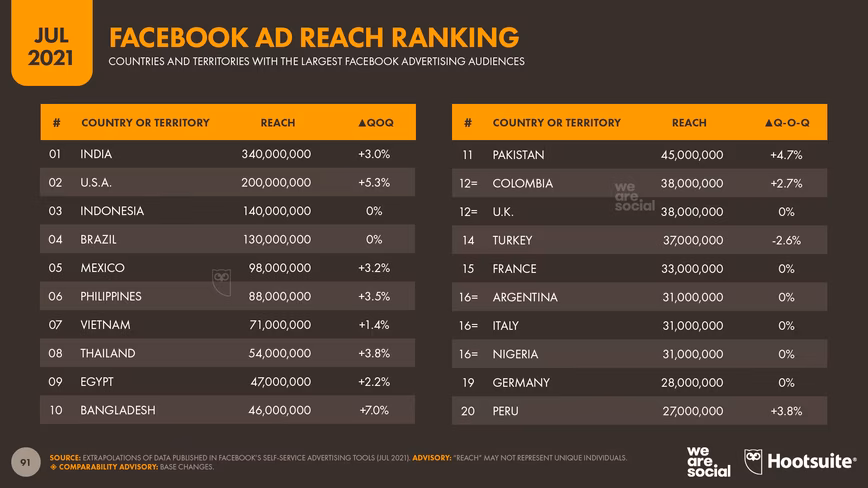
Moreover, the company’s latest numbers show no evidence of a drop in Facebook’s advertising reach across the region, which may provide some level of reassurance for investors.
But it’s not just marketers in Europe who face mounting challenges.
In a separate advisory within Facebook’s advertising tools, the company warns that potential reach figures all over the world “may vary significantly as people opt out of tracking on iOS 14.5, or use other data controls.”
The tone of these messages suggests that Facebook expects Apple’s recent iOS changes to have a meaningful impact on the performance of its advertising products over the coming months.
These changes will affect many other platforms too – not just Facebook.
Despite these challenges though, it’s worth reiterating the point that I made at the start of this section: overall, Instagram’s advertising reach has increased by more than 100 million over the past 3 months – despite that big drop in EU reach.
So, the takeaway here is that changes to privacy policies, cookie support, and online tracking regulations may have a significant impact on marketers’ ability to target ads over the coming months – at least until publishers and platforms find ways to adapt.
However, those changes don’t diminish the broader opportunities available to marketers within digital and social media platforms.
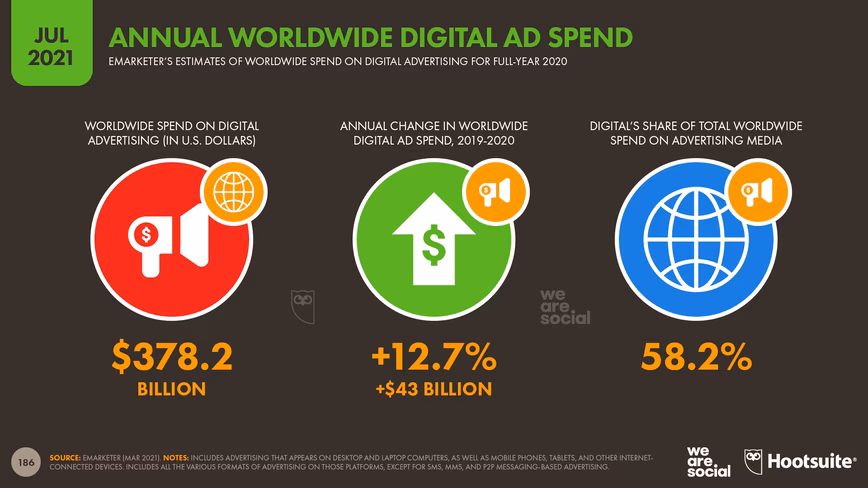
Recent data from eMarketer shows that digital channels now account for nearly 6 in every 10 ad dollars spent around the world, and we don’t anticipate that the challenges outlined above will make a significant dent in that share.
Marketers will need to change how they use digital and social media platforms over the next few months though, to ensure that their activities are as efficient and as effective as possible.
For example, you may want to experiment with contextual targeting opportunities, instead of relying solely on audience demographics – at least until you’re better able to identify how new policies and laws will affect your advertising strategy.
Mobile connection speeds accelerate
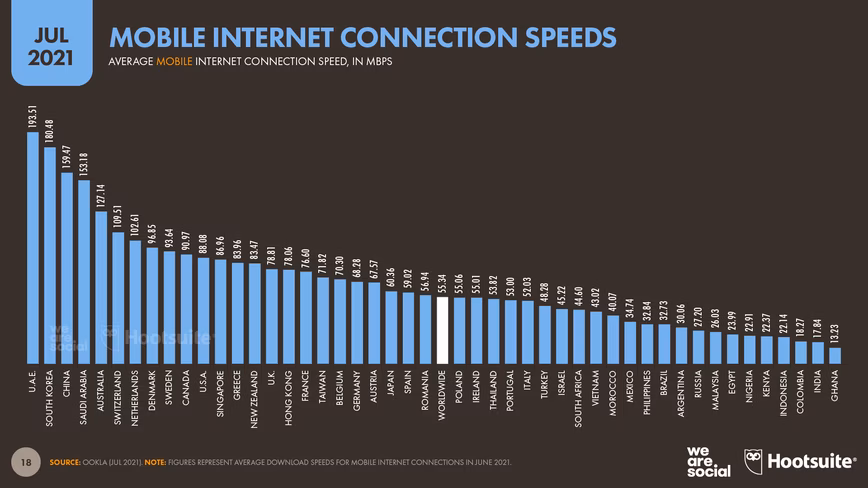
The latest data from Ookla shows that the average mobile connection speed around the world has increased by 60% over the past 12 months.
The typical mobile user now enjoys data download speeds in excess of 55 Mbps, compared to the 35 Mbps that the company reported this time last year.
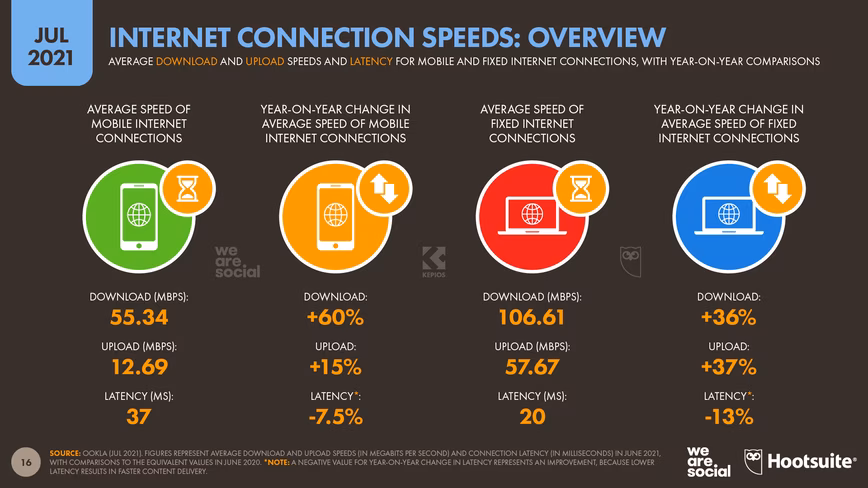
Based on Netflix’s guidance, these figures indicate that the typical mobile user can now simultaneously stream two 4K movies via a single mobile connection.
According to Ookla’s latest findings, only two countries in the world now suffer from average mobile connection speeds below 10 Mbps: Afghanistan and Venezuela.
At the other end of the spectrum, 13 countries now enjoy average mobile connection speeds in excess of 100 Mbps, with average speeds in the United Arab Emirates already close to 200 Mbps.
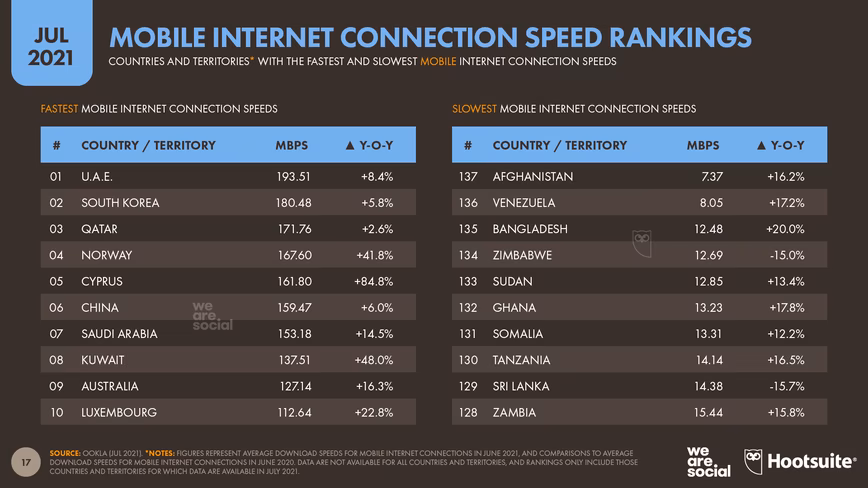
To put that figure in perspective, the typical mobile user in the UAE can now download internet content 3,450 times faster than they would have been able to by using a 56K modem just 20 years ago.
The latency of mobile internet connections continues to improve too, with Ookla’s latest data showing that the ‘lag’ between a device sending a data request and it starting to receive the requested data has fallen by 7.5% over the past 12 months.
The latency of the average mobile connection continues to be almost double that of the average fixed connection though, so there’s some way to go before mobile gamers can enjoy the same speed advantages as their peers who use a fixed connection.
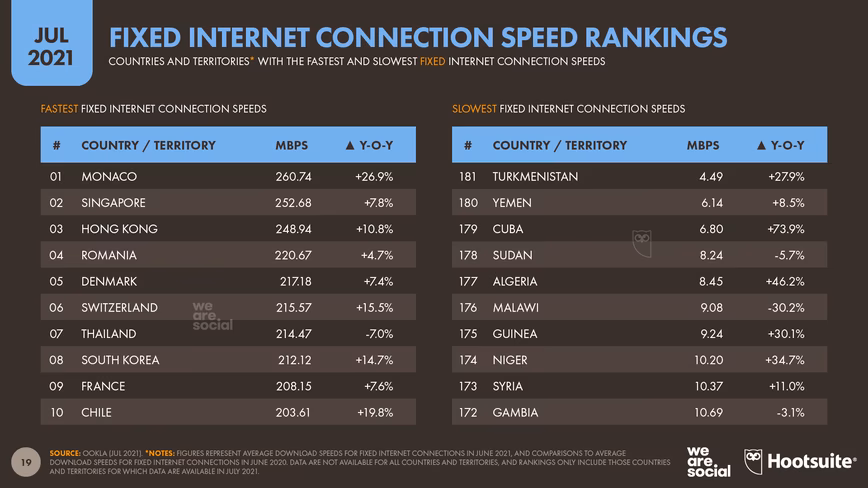
When it comes to fixed internet connections, a total of 10 countries now enjoy average download speeds of more than 200 Mbps, with Monaco and Singapore enjoying average speeds in excess of 250 Mbps.
However, 7 countries continue to suffer from average fixed connection speeds below 10 Mbps, and Ookla’s data reveals that mobile connections now outpace fixed connections in more than 40 countries.
Chinese websites move up the rankings
The latest data from Alexa (the analytics firm, not the voice assistant) suggests that the share of global internet traffic attributable to Chinese websites continues to grow.
The company’s latest rankings show that websites managed by companies based in China now account for 7 of the 10 most-visited sites in the world, and half of the global top 20.
Chinese ecommerce platforms are particularly popular, with three of the country’s online merchants – Tmall, Taobao, and JD – all ranking above Amazon’s ‘.com’ store at a worldwide level (note that Alexa treats each top-level domain separately, so traffic to Amazon’s local country stores are not included in the values for its .com store).
![]()
However, almost all of the traffic to Chinese websites appears to come from within China itself.
Alexa’s data shows that more than 95% of Tmall’s traffic comes from its home market, while that figure is 94% for Taobao, and 95% for JD.
Across each of these three sites, visitors from the United States and Japan account for roughly 3.5% of total traffic, meaning that the rest of the world accounts for barely 1.5% of each site’s worldwide total.
This data clearly demonstrates just how quickly China’s connected population is growing, but it also illustrates just how different China’s internet behaviors are to those of the rest of the world.
People increasingly rely on internet translation tools
The latest data suggests that online translation tools are becoming increasingly popular with internet users around the world.
Google Trends data shows that 3 of the worldwide top 20 Google search queries between April and June 2021 related to converting content between languages, with “translate”, “traductor”, and “Google Translate” all now top queries at a global level.
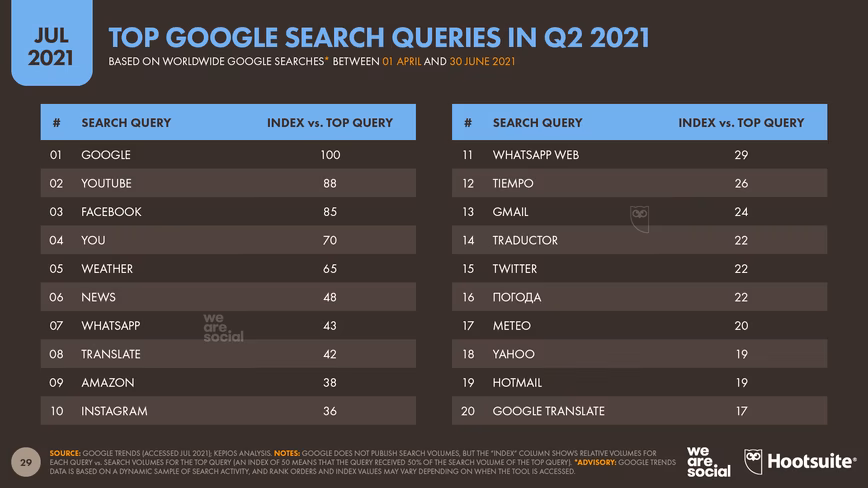
GWI data reinforces this finding, with the company’s latest survey revealing that roughly 1 in 3 internet users between the ages of 16 and 64 use online translation tools every week.
However, GWI’s data reveals some fascinating differences between countries and cultures.
Internet users in Latin America are the most likely to make use of online translation tools, with more than half of internet users in Colombia, Brazil, Mexico, and Argentina saying they use these tools on a weekly basis.
However, internet users in countries where English is the dominant language appear to be far less likely to want to translate content from (or into) other languages.
For example, fewer than 1 in 5 internet users in the United Kingdom and the USA say that they’ve used an online translation tool in the past week.
![]()
Even more tellingly, searches for ‘traductor’ rank relatively highly amongst Google queries in the United States, suggesting that many of those who do use online translation tools in the US are not native English speakers.
Around the world, younger people are also more likely to want to translate content than their parents’ generation.
GWI’s data shows that Gen Z internet users are almost twice as likely to have used an online translation tool in the past week than Baby Boomers are, with nearly 4 in 10 female internet users aged between 16 and 24 translating content online in the past 7 days.
![]()
Overall, these findings indicate that people are increasingly consuming content in languages other than their own native tongue, which represents some interesting new opportunities – and challenges – for marketers.
For example, as we reported this time last year, we’re seeing increased prevalence of cross-border online shopping, especially outside of North America.
However, as international content becomes ever more accessible, and as more people visit online merchants outside of their home country, brands may find it increasingly difficult to justify different prices – and even different product ranges – across different countries.
It’s also worth noting that Amazon appears to have increased the visibility of reviews from shoppers in other countries – some of which may be in different languages – which adds a whole new dimension to the factors that marketers need to consider when it comes to online shopping.
Digging deeper into video game behaviors
We’ve teamed up with GWI to bring you some detailed insights into gaming activities this quarter, taken from the company’s new Gaming dataset.
85% of the world’s internet users say that they play video games, so gaming environments represent a huge opportunity for marketers.
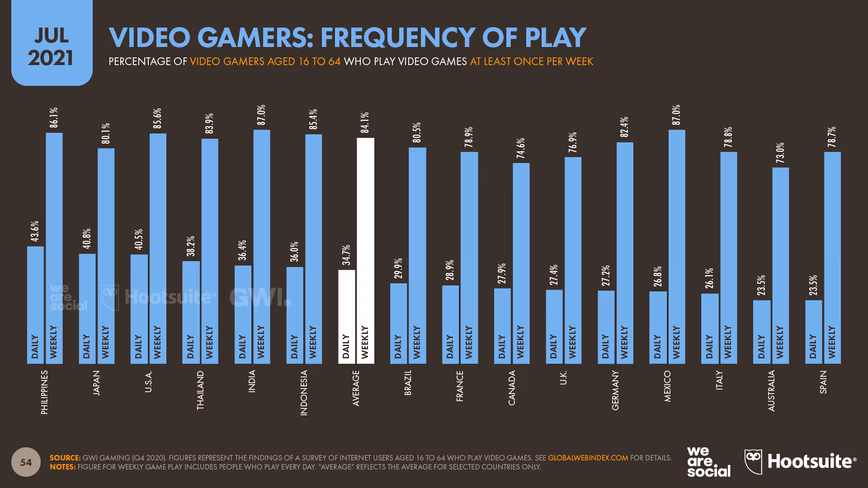
Moreover, 1 in 3 gamers around the world say that they play video games on a daily basis, with that figure rising to more than 40% in the USA, Japan, and the Philippines.
Meanwhile, more than 5 in every 6 gamers (84%) around the world say that they play video games at least once per week, with that figure rising to 87% in Mexico and India.
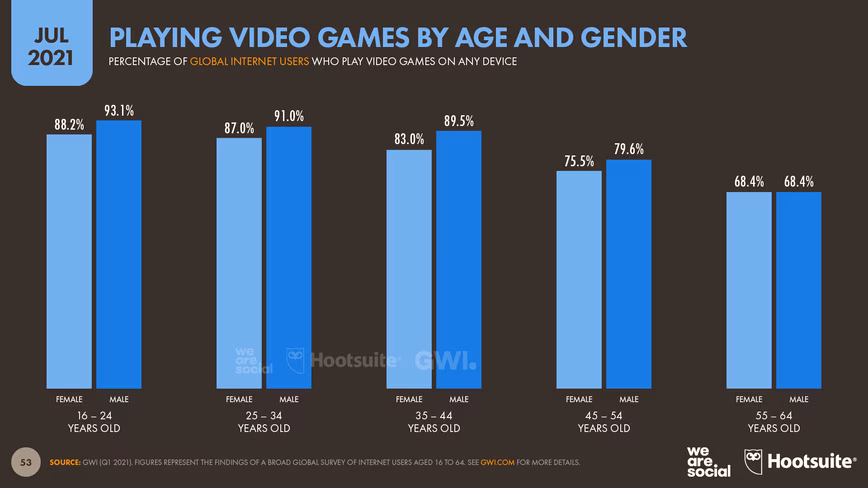
As you might expect, younger people are more likely to play video games, but GWI reports that more than 2 in 3 internet users aged 55 to 64 also identify as gamers.
Men are also slightly more likely to play video games than women, but amongst older age groups, women are just as likely to be gamers as men are.
The gaming ‘gender gap’ is also much smaller than many marketers might think, and when it comes to certain ‘casual’ game genres – particularly those on mobile devices – female players often outnumber their male peers.
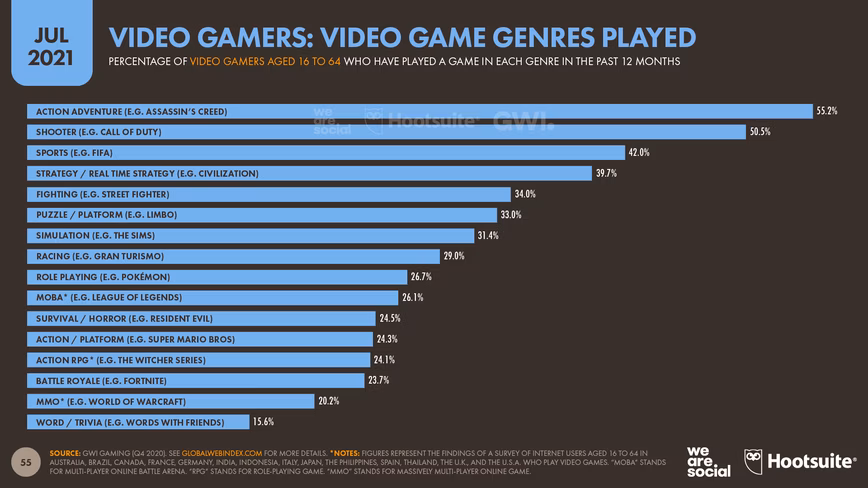
The data also shows that people play a wide variety of different kinds of video games.
Action adventures like Assassin’s Creed and shooter formats like Call of Duty top the global rankings, with more than half of all gamers saying that they’ve played at least one title in these genres over the past year.
However, 10 distinct gaming genres have attracted more than a quarter of the worldwide gaming audience during the past 12 months, including puzzle formats like Limbo, simulation games like The Sims, and role-playing games like Mass Effect.
This highlights the fact that gaming opportunities cover a wide variety of contexts, making video games an even more compelling opportunity for marketers.
Opportunities aren’t limited to in-game activities either; gaming livestreams and related social media conversations are often just as compelling as the games themselves.
YouTube attracts the largest share of social media activities related to gaming, but – perhaps surprisingly – Facebook ranks ahead of Twitch and Discord, despite those platforms’ strong association with gaming communities.
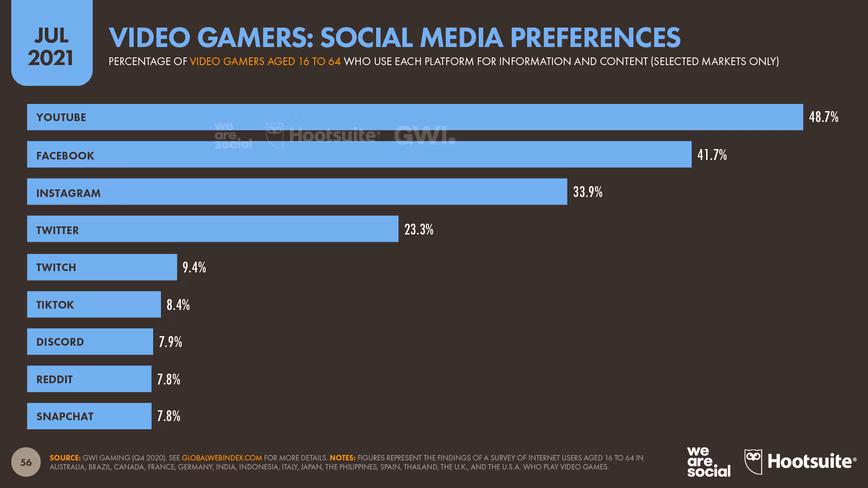
Gaming environments are quite different from other kinds of media though, so it’s important for marketers to invest time in understanding which kinds of gaming genre and marketing activity will be most relevant to their specific audiences, as well as to their brand.
Online news behaviors
To round out this quarter’s analysis, let’s take a look at some key headlines from the 2021 edition of the Digital News Report, published by the Reuters Institute for the Study of Journalism.
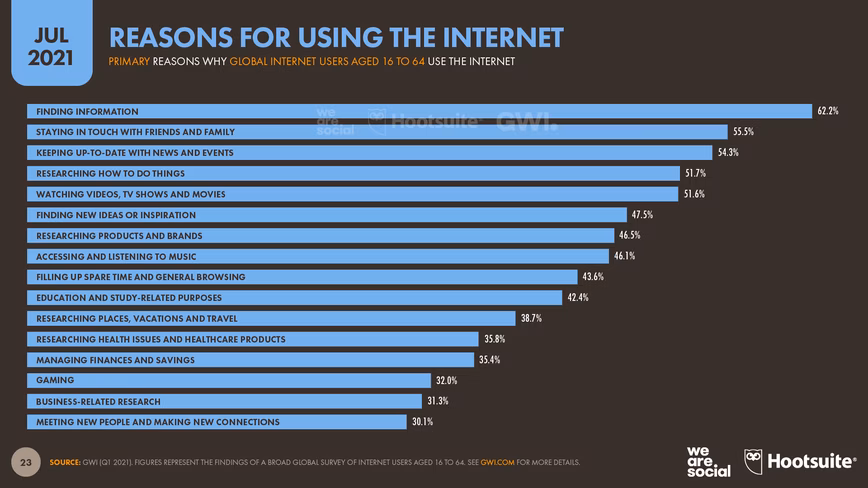
This annual study provides a wealth of insights into how the world consumes news, which has particular importance when we consider GWI’s finding that “keeping up to date with news and events” is one of the top 3 motivations driving global internet use.
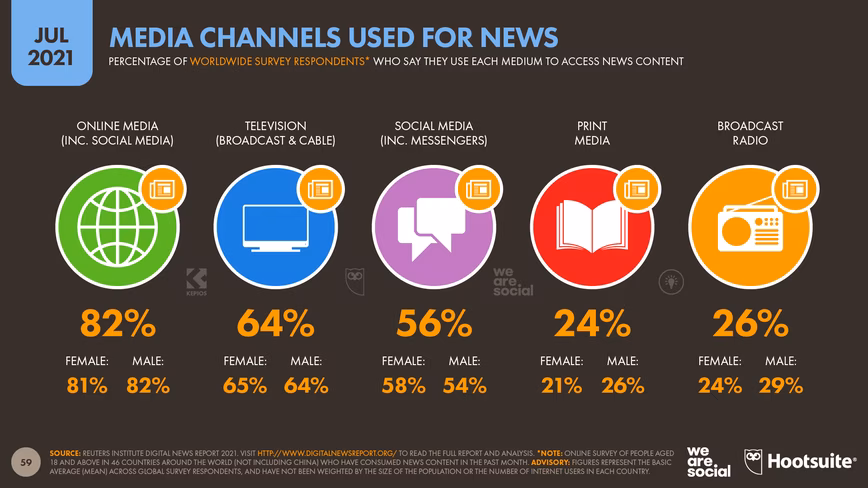
This year’s Digital News data shows that 82% of adults aged 18 and above now consume news online – significantly more than the 64% who say they watch news content on television.
Moreover, people are now more than twice as likely to get their news from social media as they are to look for it in newspapers and magazines.
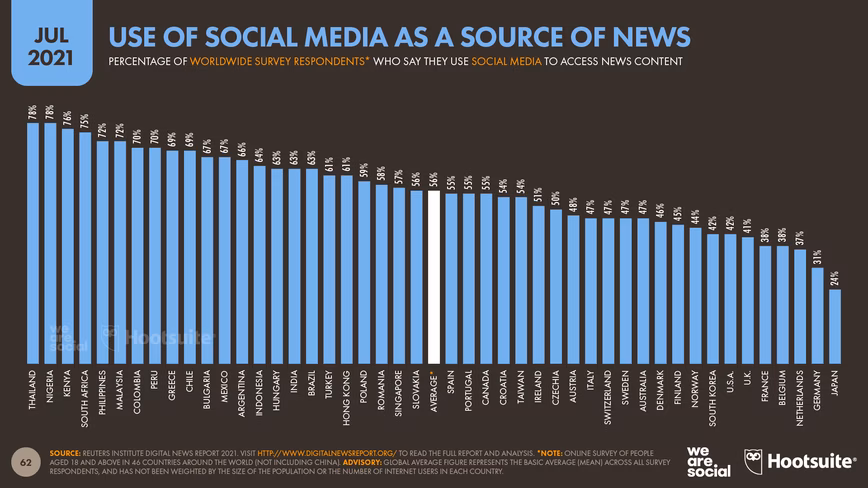
Overall, 56% of respondents in the Digital News survey say that they use social media to access news content, but that figure rises to more than three-quarters of all adults aged 18 and above in Thailand, Nigeria, Kenya, and South Africa.
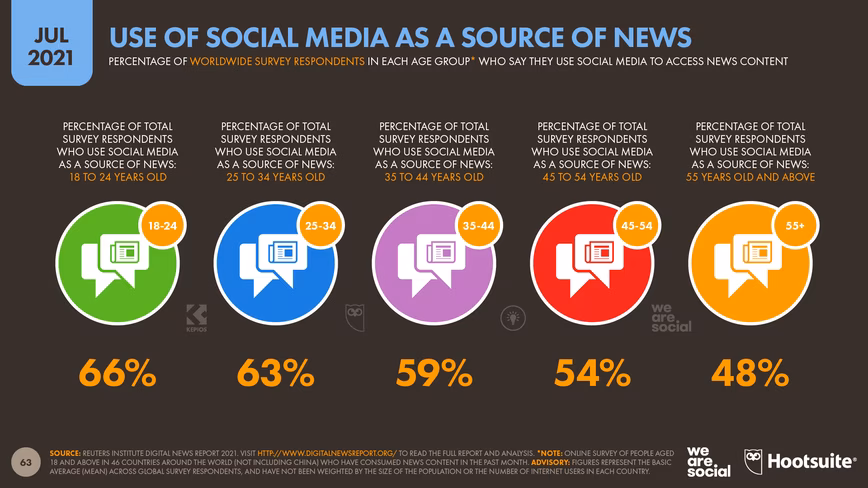
Younger people are particularly likely to turn to social media for news, with two-thirds of respondents aged 18 to 24 saying that they use social platforms to access news content.
However, roughly half of all adults aged 55 and above say that they use social media for news too, so this behavior is by no means limited to Gen Z audiences.
Once again, these findings reinforce the data in GWI’s survey, which shows that news content is a strong draw for social media use.
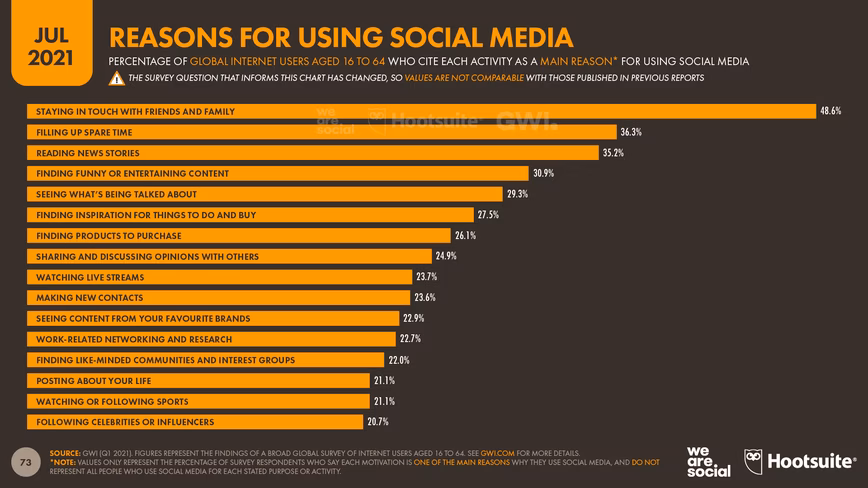
Indeed, GWI’s latest data reveals that news content is a primary reason why more than 1 in 3 internet users aged 16 to 64 visit social platforms.
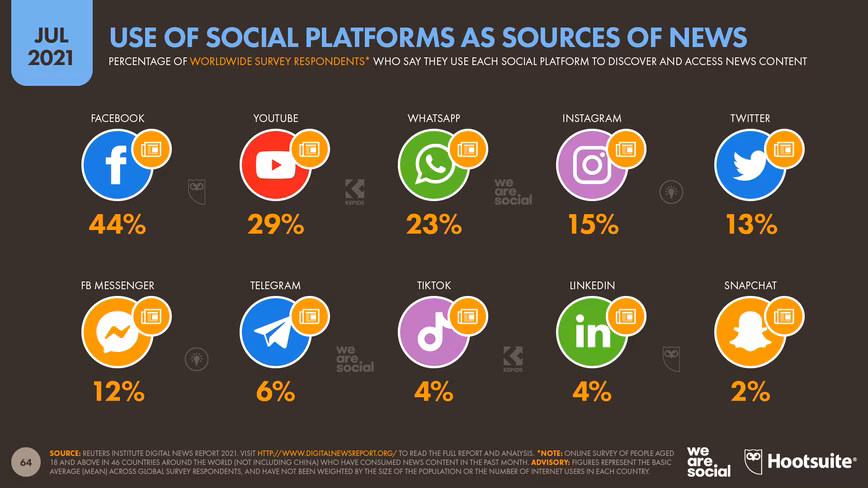
The Reuters Institute’s new report shows that Facebook continues to be the top social destination for news, with 44% of worldwide respondents saying that they use the platform to discover and consume news content.
YouTube ranks second at 29%, while WhatsApp is now the third most important social channel for news, with almost a quarter of survey respondents citing the platform as a regular feature in their news repertoire.
This year’s data also highlights Twitter’s outsized role when it comes to news content.
Despite claiming three times fewer monthly active users, Twitter is almost as popular as Instagram when it comes to news content.
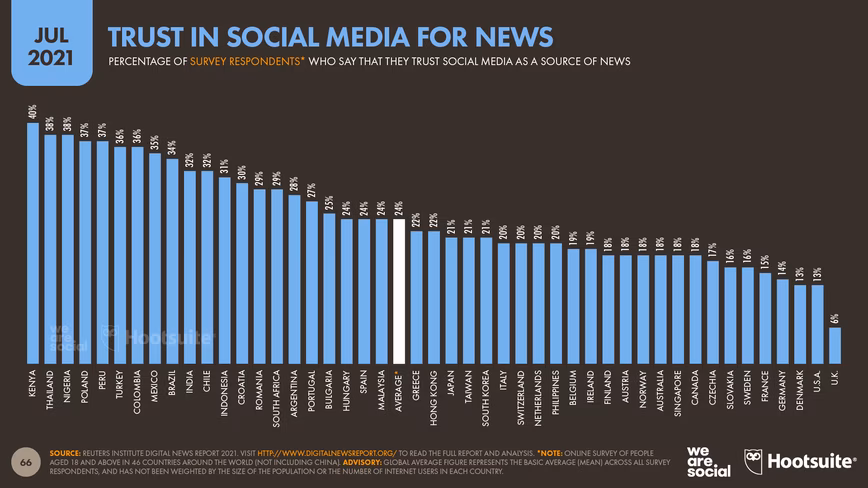
However, people have significantly lower levels of trust in the news content that they find via social channels, compared to news in other kinds of media.
Overall, 44% of survey respondents say that they feel they can “trust most news content most of the time”, but positive sentiment falls to roughly half that figure (24%) when it comes to news content in social media.
So, while social media continues to play an important role in people’s news habits, it’s critical to remember that social media environments may have a negative impact on news credibility.
As a result, marketers and publishers may want to think carefully about how they use social channels to promote and distribute news content, especially if that content relates to potentially sensitive or contentious topics.
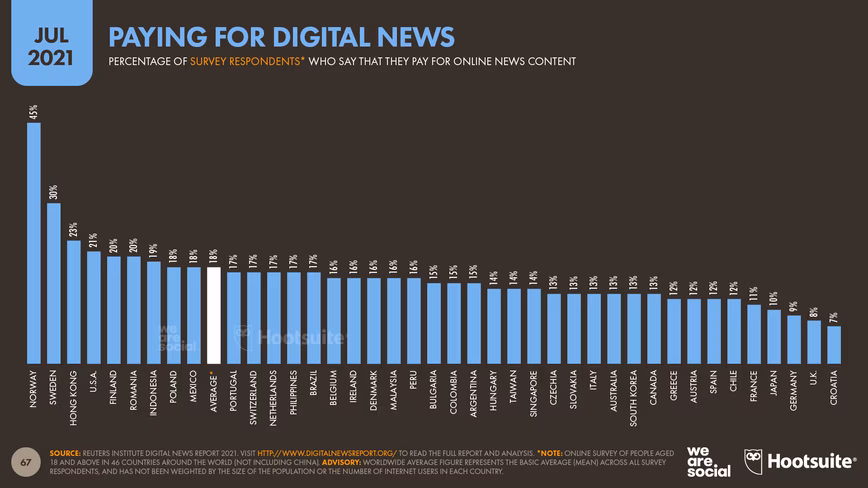
Perhaps ironically though, despite the relatively low levels of overall trust in news, people are still reluctant to pay for digital news content.
Fewer than 1 in 5 adults aged 18 and above around the world say that they currently pay for digital news, with that figure falling to less than 10% in Germany, the UK, and Croatia.
Outlook for the second half of 2021
Once again, the data in this quarter’s report demonstrates elevated growth in digital use and adoption around the world, creating a variety of opportunities for marketers everywhere.
However, I confess I’m surprised by these sustained high levels of growth, especially when it comes to social media user numbers.
The initial spikes in user growth that we saw at the start of the coronavirus pandemic were perhaps to be expected, but I’m unsure as to why those growth rates haven’t already returned to the levels we saw prior to the outbreak.
So, while my expectation is that we’ll start to see quarter-on-quarter growth rates fall from their recent highs later this year, I wouldn’t be surprised if that deceleration is still a few months away.
Furthermore, with ongoing delays in reporting updates to internet user numbers, we may see a significant jump in those metrics as new data starts to become available.
But what does this mean for marketers?
Here are my top tips for the second half of 2021:
- Focus on macro trends: it’s easy to get distracted by short-term changes in the numbers, especially when fluctuations make for great headlines. However, the underlying story seems clear: our audiences have significantly increased their use of connected devices and services over recent months, and it’s unlikely that they’ll completely return to their pre-COVID habits. As a result, growth trends in digital activity don’t face the same risk of a downward ‘correction’ that we might expect to see in areas such as stock market prices.
- Prepare for change: new privacy policies, the demise of third-party cookies, and changes to online legislation are combining to create ideal conditions for advertising’s ‘perfect storm’. Of course, this may all turn out to be another Millennium Bug, but with evidence of change already visible in some of this quarter’s numbers, I’d recommend opting for safe instead of sorry. If you haven’t already done so, now is the time to review which of your marketing activities depend on data and targeting practices that may be affected by these changes, and to develop contingency plans that will ensure your marketing efforts can continue.
- Embrace digital utility: many of today’s most successful digital companies focus on two key industries – communication and entertainment. However, the next wave of digital innovation will likely focus on everyday utility, with the rapid digitization of education, banking, and healthcare leading the way. These industries offer fewer advertising opportunities than a new form of entertainment might do, but the changes they’ll bring to people’s everyday activities will likely have a knock-on effect on people’s digital expectations. As a result, I’d recommend exploring how you might use digital channels to create new kinds of value for your audiences, rather than using them solely to promote existing products and services. Entertainment will always be a compelling option, but with a bit of careful thinking, inspirational content and how-to videos can be just as engaging as the latest dance craze on TikTok.
That’s all for this quarter, but we’ll be back with another Statshot report in October.
Get the TNW newsletter
Get the most important tech news in your inbox each week.