
Can Robinhood users actually call themselves Robin Hoods, or is it just another tool for the rich to rob the average Joe? In this series we’re diving deep into Robinhood’s public data to uncover insights on its users’ activity. Welcome to part two, where we’ll combine Robinhood’s data with other public sources to quantify the level of risk Robinhood users are taking, specifically in relation to how well (or poorly) diversified their portfolios seem to be.
At the start of November, we downloaded the full Robintrack database, which records how many Robinhood users hold a particular stock over time. While the public data doesn’t contain total share-buying volumes, it still provides us with a wealth of information — even more so when combined with other readily available data about these publicly listed companies.
To assess the amount of risk undertaken on Robinhood’s platform as a whole, we have to look at how well diversified the holdings are. Now, diversification comes in many forms, so we’re going to look at several of them:
- Diversification across multiple stocks/ETFs
- Diversification across sectors
- Diversification across industries
- Diversification across stocks vs ETFs (Exchange-Traded Funds, basically baskets of a wide range of stocks)
- Diversification across company sizes
- Diversification across countries/regions
As Robintrack’s data doesn’t contain all of this additional information, we’ve combined it with Yahoo Finance’s publicly available data.
Diversification across multiple stocks/ETFs
Robinhood currently has approximately 6 million users. According to Robintrack’s data, there exist just over 12 million unique holdings, meaning that the average Robinhood user owns stocks in two different publicly listed companies or ETFs.
Just looking at the average amount of unique ownerships per user, the standard Robinhood user doesn’t look very diversified.
Diversification across sectors
If we focus on specific stock holdings, not including ETFs, the distribution of stock holdings by sector among Robinhood users looks as follows. For comparison, we added a column for the market cap of each sector as a percentage of the S&P 500’s total market cap.
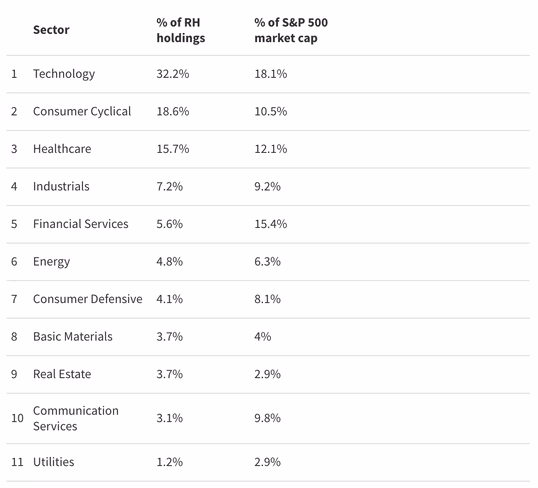
If we look at the market cap of each sector as a percentage of the S&P 500’s total market cap, the information technology sector actually is the largest, but not nearly as large as the percentage of unique holdings among Robinhood users.
To be fair, this disparity might be amplified by the fact that the free shares given to new customers (and existing ones referring new customers) often concerns that of a technology company like Fitbit or GoPro, with a stock price of less than $10.
Other big disparities exist for the Consumer Cyclical (much more popular on Robinhood), Financial Services, Consumer Defensive, Communication Services, and Utilities (a lot less popular on Robinhood) sectors.
The top three sectors among Robinhood users comprise 67% of all stock holdings, while the top three sectors by market cap only account for 41%.
This means that sector-wise, Robinhood seems much less diversified than the market in general. Overexposure in one particular sector, in this case tech, obviously poses risks.
Diversification across industries
Now, if we look at industries, which are even more specific than sectors, we see the following are the most popular among Robinhood users. Again, we added a column for the market cap of each industry as a percentage of the S&P 500’s total market cap, as a comparison.
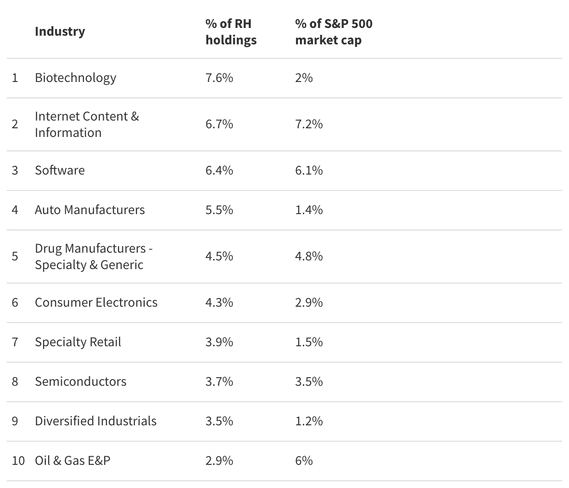
As you can see, Robinhood users are betting relatively big on Biotechnology and Auto Manufacturers, and relatively small on Oil and Gas. With a price of around $9, Ford stocks might be skewing these results as they’re commonly given away to new and referring users.
The top ten industries among Robinhood users comprise 49% of all stock holdings, while the top ten industries by market cap account for 45%. Popular industries which, in general, can’t be found among Robinhood users’ most popular stocks concern Banks (1), and Insurance (9). Facing trust (financial crisis) and environmental (climate change) issues, it’s perhaps no surprise that these industries are less popular among Robinhood’s predominantly millennial target audience.
Industry-wise Robinhood’s total unique stock portfolio selection seems a bit less diversified, one can also view its users’ choices as simply different from the general public — more mindful of the environment, and more future-focused.
Stock pickings vs ETFs
Just 5% of all unique Robinhood holdings concern ETFs, which accounts for 640,000 out of the 12 million total. An estimated 8.5% (4 trillion) of the total investments made on the US stock market concern ETF investments.
This means Robinhood users are underinvested in ETFs — which are generally considered less risky — instead of specific stock picks, and thus seem less diversified on this front as well.
Diversification across company sizes
If we look at the sizes of companies that Robinhood users invest in, we see the following distribution.
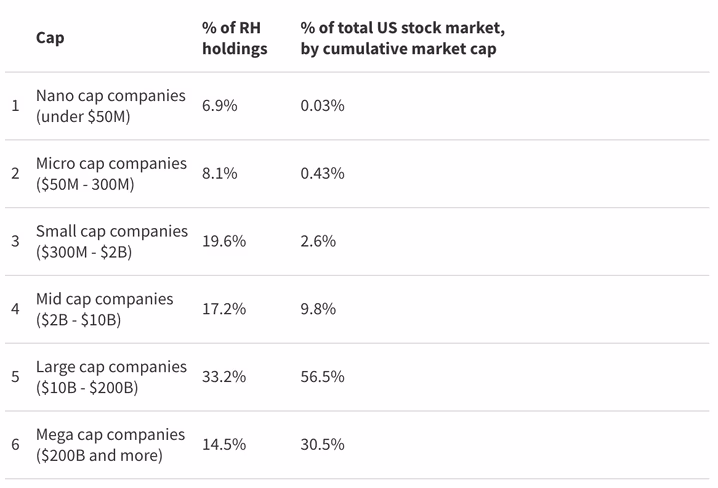
Robinhood users are relatively highly invested (again, in terms of unique holdings) into specific smaller cap companies, which are generally considered more volatile and risky to invest in. Smaller caps usually have lower stock prices as well, so they might be picked more often as a free stock for new and referring users.
Diversification across countries/continents
Since Robinhood users cannot directly trade on foreign exchanges, but only invest in a limited amount of ADRs (American depositary receipts, read about the difference between ‘foreign ordinaries’ and ADRs here), diversification by country or region is automatically also limited. Diving into the data for this particular form of diversification therefore doesn’t make sense, as any insight gathered isn’t robust enough to draw any conclusions.
Ending remarks
First of all, it’s important to reiterate that the free stocks given away can skew the data so much that we can’t be conclusive about the level of diversification by sector, industry, or company size, even though that data doesn’t look reassuring at first glance.
Even so, one can argue that Robinhood pushes its users in the wrong direction (in terms of relatively safe investing) by giving away stocks of often smaller cap companies. Larger cap stocks (of well-established companies expected to continue as profitable businesses) and ETFs are generally considered safer investments.
Also, a large part of the users seem to stick with the free stock, as the average unique holdings per user accounts for just two. So the majority of its users aren’t well-diversified when taking the breadth of their Robinhood portfolio into consideration.
It’s safe to say that by looking solely at Robinhood’s total investment portfolio, its (potential) users would definitely benefit from increased education on the risks of investing, and the strategies to decrease these risks so they’re less likely to treat the stock market as a casino.
We reached out to Robinhood for comment, and received the following reaction:
While we’re a self-directed brokerage and don’t offer investment advice, we do offer a variety of informational resources for people: Robinhood Snacks (newsletter and podcast), online articles (basic information on investing), and in-app newsfeed (market news from outlets such as WSJ, CNN, Reuters, and Cheddar).
Get the TNW newsletter
Get the most important tech news in your inbox each week.