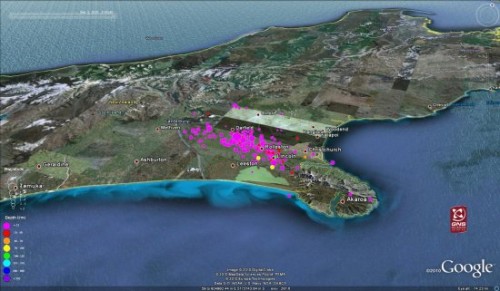
Based on data collected from New Zealand’s GeoNet website from Saturday morning’s 7.0 earthquake near the country’s second largest city, Christchurch, a reader of the unofficial Google Earth Blog, has created a KMZ file that visualizes the main quake and the subsequent aftershocks. In all it displays 216 quakes over about a 50 hour period and shows depth and magnitude.
You can either click around in Google Earth to visualize the data and/or can simply press the play button (in the upper left corner after you download and launch the KMZ file) – just make sure to hit the settings button first (the wrench) and slow down the timeline of the visualization.

Image: Google Earth Blog
Thumb image: The Telegraph
Get the TNW newsletter
Get the most important tech news in your inbox each week.


