A quick note before we start: I have covered top 20 libraries below. It might get little confusing when you try to pick one for your project as there are many factors to consider. So here is something for help – a small guide on factors to consider while choosing a JavaScript chart library from the makers of FusionCharts (covered at #2 below). It explores 14 different factors that go into making the decision in good depth, and is one of the best resources on the topic.
Every business is turning to data analysis for important decisions. In fact they’re usually swimming in data, wondering what to make out of it. With the advent of big-data, good old spreadsheets and charts just don’t cut it anymore.
Businesses have been asking for better ways to visualize data, ways that are preferably interactive and allow them multiple perspectives. After all, all that data is only as good as the insights you can extract from it.
JavaScript charting libraries have emerged as the most powerful tools for visualizing data in the form of beautiful, easy to understand, interactive charts. They make it easier to extract and convey key patterns and insights that are often not apparent with static charts.
To make things easier for you, I’ve put in the effort to dig through the plethora of options and find the best JavaScript Charting Library for your needs. So let’s get started, here are all the chart.js tools you need to know about.
1. Chartist.js
Chartist provideseasy, intuitive use even for those who are uncomfortable moving away from Excel sheets. Their charts are responsive (using media queries) and DPI independent – meaning Chartist is a great solution if your charts are meant to be used any kind of device – mobile, tablet or desktop. It is based on SVG which makes it future compatible.
What sets Chartist apart is that it’s a community effort, born out of the frustration about the limitations provided by other charting libraries. So they’ve taken care of all the little tweaks and missing features that cause heartburn when you work with some of the other javascript libraries.
License: Open-source. Free for all uses.
2. FusionCharts
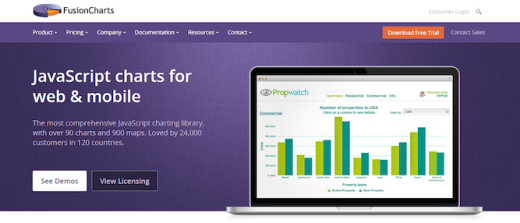
FusionCharts brings in one of most comprehensive javascript libraries with over 90 charts and 900 maps – all ready for use out of the box. They boast of the best looking charts in the industry, and back it up with a powerful reporting experience through their dashboards that help present a bird’s eye view across business functions.
FusionCharts is compatible across devices from PCs and Macs, to iPhones and Android tablets; and they go the extra mile to ensure cross browser compatibility, even on IE6!
They’ve also covered all bases when it comes to formats – both JSON and XML data formats are accepted; rendering can be via HTML5/SVG or VML and charts can be exported in PNG, JPG or PDF format. FusionCharts extensions make it easy to integrate with any technology of your choice including jQuery, AngularJS, PHP and Rails.
Overall, FusionCharts has just about every feature and format you could need to create beautiful, insightful charts for some serious business analysis. And the best part is the free trial that you can download and use, with no restrictions.
License: Free for non-commercial, paid for commercial uses.
3. Dygraphs
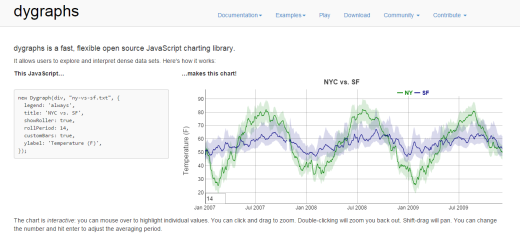
Dygraphs is an open-source JavaScript charting library best suited for extremely large data sets. It is interactive out of the box, with pinch and zoom support even on mobile devices.
It’s compatible with most modern browsers, and backward compatible up to IE8. Options and custom callbacks make it highly configurable as well.
License: Open-source. Free for all uses.
4. Chart.js
Chart.js is perfect for small projects – when you need flat, clean, elegant javascript charts, fast. It is a tiny open source library at just 11kb when minified and zipped. This includes 6 core chart types (line, bar, radar, polar, pie and doughnut), each in its own module, so you can even load only the ones your project needs, making your footprint even smaller.
It uses HTML5 canvas element for rendering charts and polyfills support to work on IE7/8. The charts are all responsive.
License: Open-source. Free for all uses.
5. Google Charts
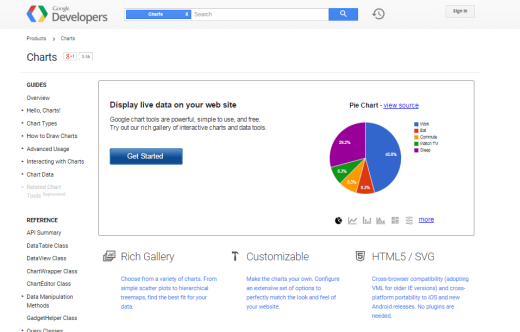
Google Charts provides a wide range of charts, for almost any kind of data visualization need. The charts are based on HTML5/SVG and VML for older IE versions. All charts are interactive, and some are pannable/zoomable as well. You can take a look at their extensive chart gallery here. And the best part is that they’re absolutely free.
License: Free, but not open-source. Google’s licensing does not allow you to host their JS files on your server. So if you are an enterprise and have some sensitive data, Google Charts might not be the best option.
6. Highcharts
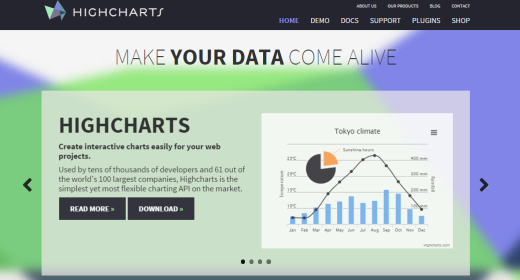
Highcharts is another popular interactive charting library, and like many of the others, is based on HTML5/SVG/VML, meaning it requires no extra plugins. It supports a wide range of charts like spline, column, bar, maps, angular gauges among others.
It provides an interface called Highcharts cloud for creating interactive charts online. What’s more, is that it is completely free for personal use. You only need to buy a license for commercial use.
License: Free for non-commercial, paid for commercial uses.
7. Flot
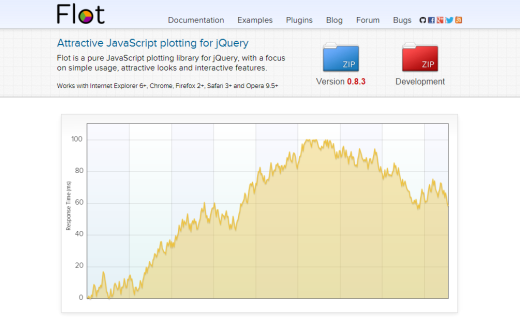
Flot is one of the oldest charting libraries around and focuses on simple usage and interactive features. It’s specifically for jQuery, which means you do need to be familiar with basic jQuery in order to use it. But on the other hand, it also means that you have full control over the presentation, animation and user interaction.
Flot is compatible with most modern browsers, and backward compatible till IE6. Flot’s plugin repository provides many other plot types, all contributed by the community. You can check out some examples of charts made with Flot here.
License: Open-source. Free for all uses.
8. D3.js
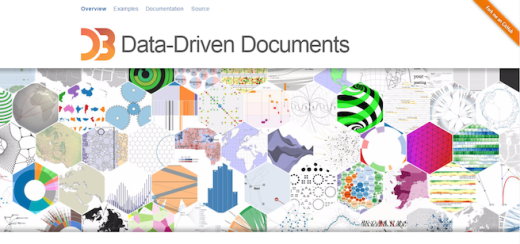
D3 is often the first name that comes up for any kind of data visualisation. It’s a really powerful open source project that lets you create stunning visual effects and graphics by dynamically updating the DOM. In a way, it brings data to life using HTML, SVG and CSS.
It conforms to the W3C web standards and is compatible across browsers. Developers tend to love it for the range of features it brings, things like “Enter and Exit” and powerful transitions. You can see some examples built with D3 over here.
The caveat is that it does not ship with pre-built charts, and has a pretty steep learning curve to get even basic charts up. But developers are an innovative bunch and have come up with quite a few out-of-the-box charting libraries, based on D3. We’ll cover some of the best ones later.
License: Open-source. Free for all uses.
9. n3-charts
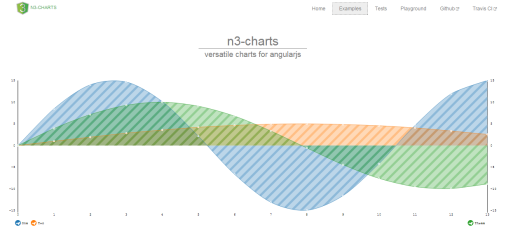
If you’re looking for a way to create simple and interactive line charts for your AngularJS application, this is the way to go. N3 is built on D3.js and is meant for a very niche audience – making versatile line charts on AngularJS. If you need more chart types, this may not be your thing. You can see some examples of n3-charts in action here.
License: Open-source. Free for all uses.
10. NVD3
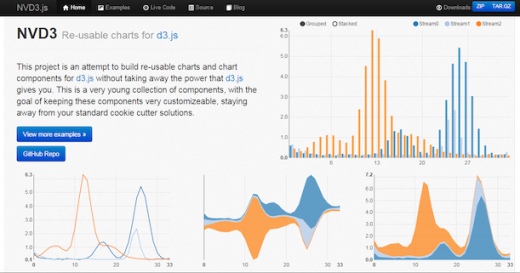
NVD3 is a project aimed at building re-usable charts and components for d3.js – providing the same powerful features, but much simpler to use. It lets you handle complex data sets and create advanced visualisations.
License: Open-source. Free for all uses.
11. Ember Charts
The developers at Addepar have been steadily working to improve the Ember experience with the additional libraries Ember Charts, Ember Tables and Ember Widgets. Ember Charts provides an easy to use, extensible, chart suite built on the D3.js and Ember.js framework.
It’s robust and polished – the error handling for bad data ensures your application doesn’t come crashing down if there’s some weird data. You can even create your own chart types by extending it.
License: Open-source. Free for all uses.
12. jQuery Sparklines
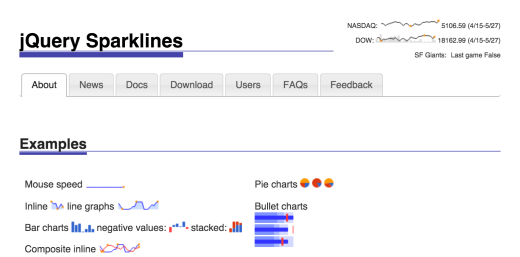
I know we’ve been talking about the heavy weights – libraries that can do it all. But sometimes, you need something simple, for simple tasks. The jQuery Sparklines plugin provides a niche solution. It helps generates sparklines – small inline charts, just enough to give an idea of the trends – with bare minimum code. It’s compatible with most modern browsers and even older ones like IE6.
License: Open-source. Free for all uses.
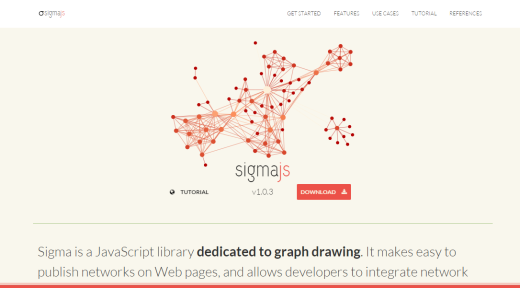
13. Sigma.js
While we’re looking at specialized use cases, we have to talk about Sigma. Sigma is a powerful JavaScript library focused on presenting interactive graphs and networks for the web.
Sigma’s libraries and plugins pack in an enormous amount of interactive settings. Once you’ve used Sigma, you will never think of line graphs as boring, ever again. Take a look at this Sigma.js rollover demo and you’ll know what I mean.
License: Open-source. Free for all uses.
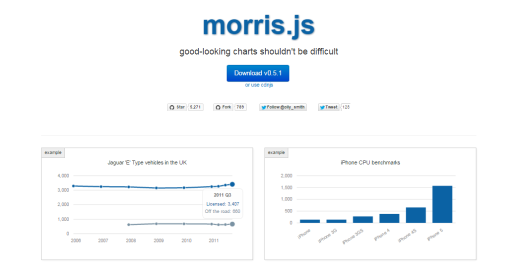
14. Morris.js
Yes, like Morris says, good-looking charts shouldn’t be difficult. Morris is a lightweight library based on jQuery and Raphael, that provides simple, clean line, area charts, bar, and donut charts. Definitely worth a try if you’re looking for something quick, easy and classy.
License: Open-source. Free for all uses.
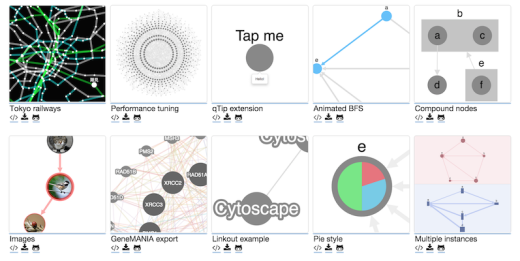
15. Cytoscape.js
Cytoscape.js is an open source, fully featured graphing library, written purely in JavaScript. It’s free under LGPL3+ license. It is highly optimised and has no external dependencies. Cytoscape.js lets you create a reusable graph widget that can be integrated with your own JavaScript code.
It is also compatible with all modern browsers, as well as various software frameworks such as CommonJS/Node.js, AMD/Require.js, jQuery and Meteor/Atmosphere among others. Note that though it shares a commonality in name with the Cyctoscape desktop app, they are both distinct.
License: Open-source. Free for all uses.
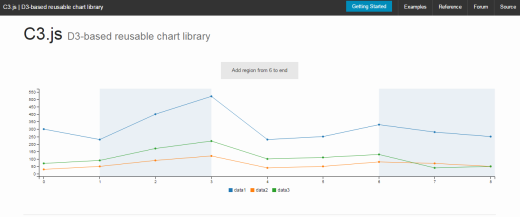
16. C3.js
C3.js is another D3 based reusable chart library. The sheer number of D3 based charting tools gives a good indication of how much people love the D3’s functionality, and yet actually hate coding with D3 directly.
C3.js provides another way around the D3 learning curve by wrapping the code required to construct the entire chart. C3 lets you create customizable classes that you can then use to generate your own style. It provides a number of APIs and callbacks that you can use to update the chart even after the first render.
License: Open-source. Free for all uses.
17. Rickshaw
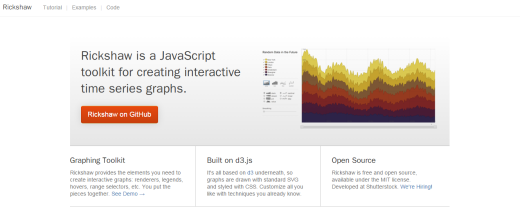
Rickshaw was developed over at Shutterstock as a toolkit for creating time series graphs. Like a few of the other tools we’ve talked about, Rickshaw is based on the D3 library. It is free and open source (under the MIT license).
You can see some interesting examples of Rickshaw in use over here. Rickshaw comes with many extensions and customizable features that let you generate beautiful time-series charts.
License: Open-source. Free for all uses.
18. Cubism.js
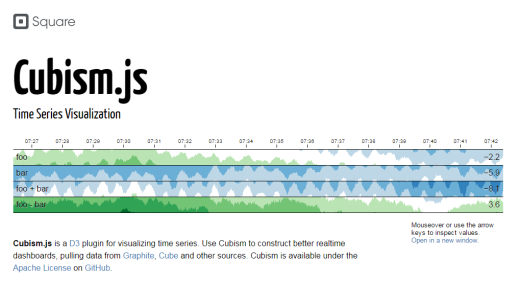
Cubism is perhaps the best D3 plugin for visualising time series. What makes it stand out is that you can pull in data from multiple sources like Graphite, Cube and others to create awesome real-time dashboards to visualise your data.
It renders incrementally, using Canvas to shift charts one pixel to the left at a time. Cubism’s horizon charts make better use of vertical space than standard area charts, allowing you to see many more data points at-a-glance and increasing the likelihood of discovery.
License: Open-source. Free for all uses.
19. Plottable.js
Plottable takes a bit of a different approach to the D3 framework. They’ve gone modular with a set of pluggable components, that encapsulate the rendering logic. This is then fed to a separate layout engine for actually positioning them.
What this means is that you can take any of the Plottable components and add them to existing charts, or create entirely new ones with Plottable. It basically brings you the power of D3, in a more modular, plug and play manner. Hop over and see Plottable at work in these examples.
License: Open-source. Free for all uses.
20. Canvas.js
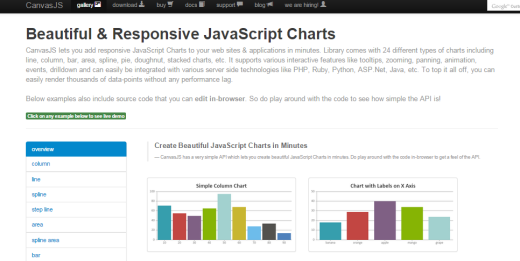
Like the name suggests, Canvas.js is an HTML5 – JavaScript charting library based on the Canvas element. Canvas allows you to create rich charts that are completely responsive and display well across device types. Out of the box, it includes many good looking themes, which they claim are 10x faster than conventional Flash/SVG based graphs.
License: Free for non-commercial, paid for commercial uses.
Conclusion
Data visualization and analysis is now an integral part of business processes. Firms large and small, need clear, effective, interactive ways to be able to interpret the data correctly. That makes it all the more important to choose the right kind of JavaScript Charting library that best matches your needs.
Libraries like FusionCharts, GoogleCharts, Dygraphs or one of the D3 derivatives may work best for corporations with large data sets, or small businesses that rely heavily on data analysis. If you just need something small and quick, Morris.js or Chart.js might work better for you. For graphs and networks, Cytoscape or Sigma.js is probably the way to go.
I’ve tried to include the best tools here, but I’m sure you have your favorites as well. So spill the beans. What’s your favorite JS charting library, and why? Share your thoughts in the comments below.
Read Next: The 14 best data visualization tools
Image credit: Shutterstock
Get the TNW newsletter
Get the most important tech news in your inbox each week.

