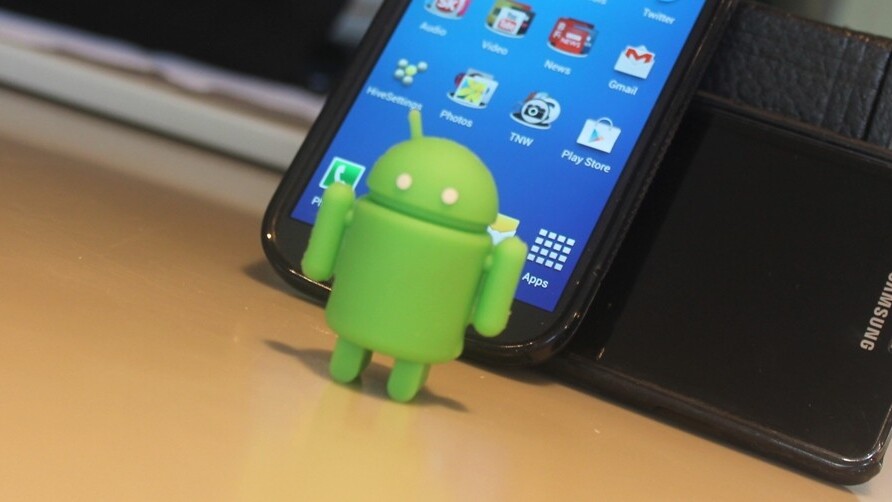
The much-maligned Android fragmentation problem has blighted the mobile operating system for years, though Google has been steadily taking corrective measures in recent times. The issue? So many different devices and form-factors, running a multitude of Android versions which purportedly cause developers no-end of pain when striving to cater for the increasingly-dominant mobile platform.
But how serious is the problem? OpenSignal sheds some light on this today, with its 2014 Android fragmentation report.
OpenSignal on Android
To recap, OpenSignal is the company behind the eponymous app that creates maps of mobile phone network coverage based on information crowdsourced from smartphone users. It has been available on Android for a while already, though it finally launched a version for iPhone users in 2013.
OpenSignal has emerged as one of the biggest independent sources of data on the speed and coverage of mobile phone carriers around the world. Rather than relying on coverage maps provided by networks themselves, OpenSignal gathers this information directly from users and opens it to anyone, so they can see for themselves which ones offer the best coverage where they are. However, a by-product of this is that OpenSignal garners a lot of additional data that offers significant insight into the state-of-play across the mobile realm. This includes things like 4G coverage, and the number of different device-types. Fragmentation, in other words.
According to OpenSignal’s data, it has seen 18,796 ‘distinct Android devices’ this year, up from 11,868 last year. To garner this data, it surveyed the last 682,000 devices to install the app, so this should be fairly representative of the Android ecosystem. But it also perhaps goes without saying that this number would naturally increase – after all, a myraid of new Android devices have been launched in the past 12 months, and the existing devices aren’t going to disappear off the face of the Earth.
It may come as little surprise that Samsung claims dominance in the Android realm from a brand perspective with 43 percent (down from 47.5 percent last year), while Sony ranked second with a mere 4 percent, which helps illustrate the gulf between Samsung and the rest. LG, Motorola and Huawei were also among the next most popular Android handsets. OpenSignal’s data reveals 12 of the 13 most common Android devices are Samsung.

Devices are just one facet of the fragmentation fiasco though. OpenSignal pulls together data from both Google and Apple, providing a side-by-side glance of the state-of-play. For example, 20.9 percent of Android users are on KitKat (4.4), and most Android users are on at least Ice Cream Sandwich (4.0), with a little more than 14 perent persevering with Gingerbread or Froyo.

For comparitivie purposes, according to Apple’s own data, iOS 7 sits at 91 percent, iOS 6 at 8 percent, while a mere 1 percent are still using an antiquated incarnation of Apple’s mobile oeprating system.
It is worth adding here that while OpenSignal’s data is fairly extensive, it is still restricted to devices that have installed the OpenSignal app – which is a lot, but may not represent the whole smartphone-using spectrum and thus might not reveal the full picture.
At any rate, OpenSignal’s report makes for an interesting read, and pulls on additional existing data provided by third-party sources, including the correlation between fragmentation and GDP per capita.
➤ OpenSignal | 2014 Android Fragmentation Report
Don’t miss: 12 of the best new Android apps from July
Get the TNW newsletter
Get the most important tech news in your inbox each week.

