More than 4 billion people around the world now use social media each month, and an average of nearly 2 million new users are joining them every day.
The world is spending more time on social media too, with the typical user now spending roughly 15% of their waking life using social platforms.
However, social media isn’t the only aspect of digital that’s delivering impressive numbers.
The new Digital 2020 October Global Statshot Report – produced in partnership with Hootsuite and We Are Social – shows that connected tech continues to play an ever more important role in various aspects of people’s everyday lives.
Top stories in this quarter’s report include:
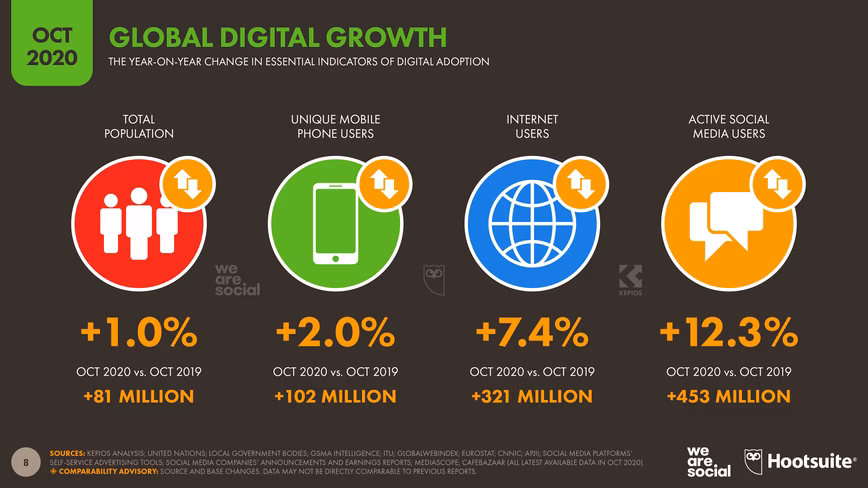
- Social media adoption has jumped by more than 12% in the past 12 months
- The time we spend using connected devices continues to rise
- Instagram continues to enjoy strong growth, but it’s not alone
- A clear ‘age gap’ defines digital use in the workplace
- Marketers may be missing out on some of today’s biggest digital opportunities
You’ll find the complete October report in the SlideShare embed below (or click here), but read on below for my in-depth analysis of this quarter’s key stories.
Essential headlines
Just before we dig into this quarter’s trends in more detail, here are the essential headlines you need to make sense of the global ‘state of digital’ in October 2020:
- Total world population: 7.81 billion people
- Number of people using mobile phones around the world: 5.20 billion
- Global internet users: 4.66 billion
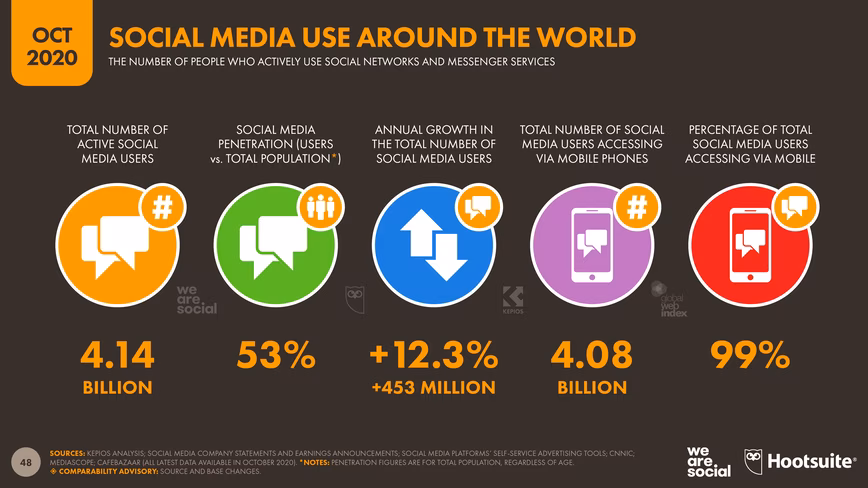
- Worldwide social media users: 4.14 billion
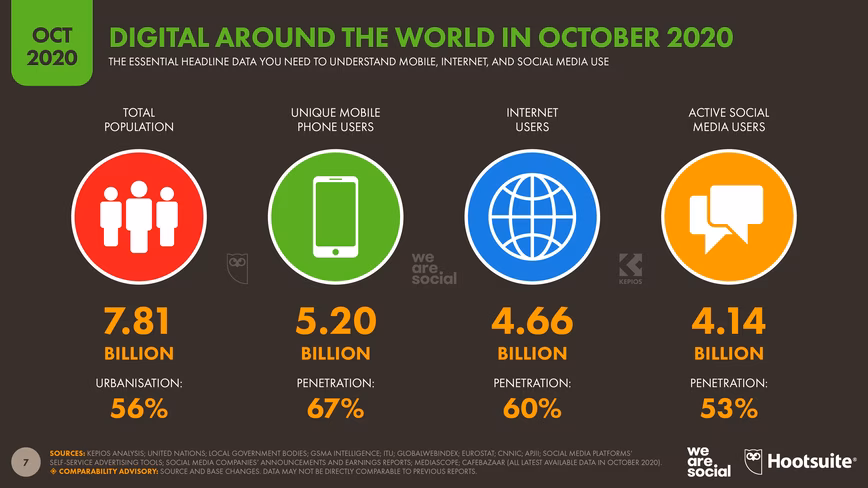
To put these numbers in perspective, more than two-thirds of the world now uses a mobile phone (67%), while almost 60% of all the people on Earth now use the internet.
Meanwhile, it was just three months ago that we reported social media penetration had passed the 50% mark, but the latest data show that this figure has already jumped to almost 53%.
More than 9 in 10 internet users around the world connect via mobile devices, but two-thirds still connect via computers too.
However, when it comes to social media, users clearly prefer mobile devices. Kepios analysis reveals that 99% of the world’s social media users access via mobile devices, but just 1 in 5 use a laptop or desktop computer.
Now, let’s dig into those top stories in more detail.
Social media adoption accelerates
The number of people using social media around the world has grown to 4.14 billion in October 2020, with that figure passing the momentous 4 billion user milestone for the first time this quarter.
Analysis by Kepios shows that more than 450 million people started using social media over the past 12 months, equating to annual growth of more than 12%.
That means that an average of more than 14 people started using social media every second since this time last year, which is even higher than the rate we saw last quarter.
Indeed, the latest data show that social media growth is actually accelerating.
More than 180 million more people used social media between July and September compared to the previous three months, equating to an average increase of almost 2 million users per day.
That’s roughly double the growth rate that we reported back in January, and represents the largest quarter-on-quarter increase that we’ve seen since we started producing these reports back in 2011.
Much of this quarter’s growth in social media use is the direct result of the new habits that people adopted during COVID-19 lockdowns.
However, despite the extraordinary circumstances, we don’t expect overall user figures to fall back again once people return to more ‘normal’ routines, although we can expect some volatility in the user numbers of individual platforms over the coming months.
In particular, some platforms that enjoyed a surge in use during lockdown may see their monthly active user figures drop down again once people are able to participate in a wider variety of everyday activities.
However, as we’ll see later in this analysis, any potential reduction in individual platform audiences may still be some way off.
Screen time increases
As we forecast in our April and July Statshot reports, the amount of time that people spend on the internet has increased significantly during 2020, in part because of the new behaviors that people adopted during coronavirus lockdowns.
The latest data from GlobalWebIndexpan shows that the typical internet user spent almost 7 hours per day using connected devices between April and June 2020, up by almost a quarter of an hour per day compared to the figures we reported last quarter.
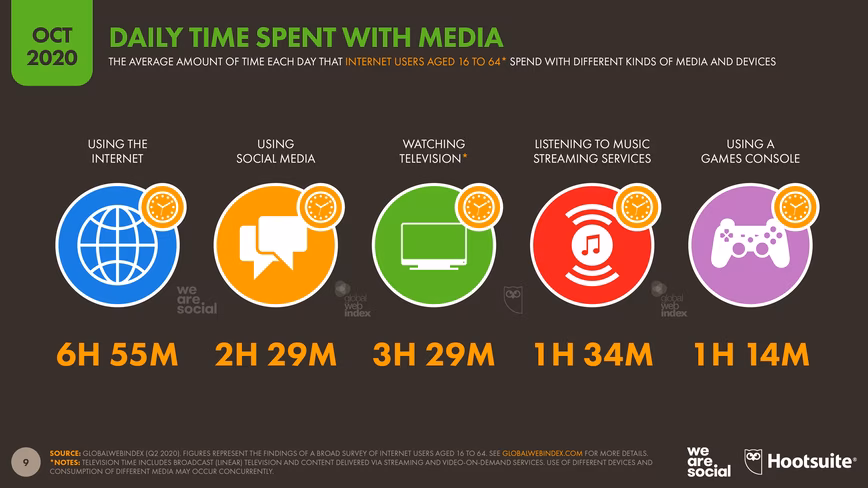
Social media accounts for more than one-third of our connected time, with people now spending an average of almost 2½ hours per day on social platforms.
Added together, this means that the world now spends more than 10 billion hours per day using social media, which equates to more than 1 million years of human existence.
We’ve also been spending more time watching television, and the world’s internet users now watch a combined average of 3½ hours of TV content per day across broadcast stations, cable channels, and internet-powered streaming platforms.
Our TV behaviors are changing though, with streaming services accounting for an increasingly important share of total TV time.
GlobalWebIndex’s latest data reveal that the world’s internet users now spend an average of 1½ hours per day watching platforms like Netflix and Disney+, compared to the 2 hours per day that they spend watching broadcast and cable channels.
Social platforms see strong growth
Almost all of the world’s top social platforms saw strong audience growth over the past three months.
Instagram added the greatest number of new users between July and September 2020, posting even stronger growth figures than Facebook.
The company’s own tools show that Instagram’s advertising audience has grown by more than 76 million over the past three months, reaching a total of 1.16 billion people by the start of October 2020.
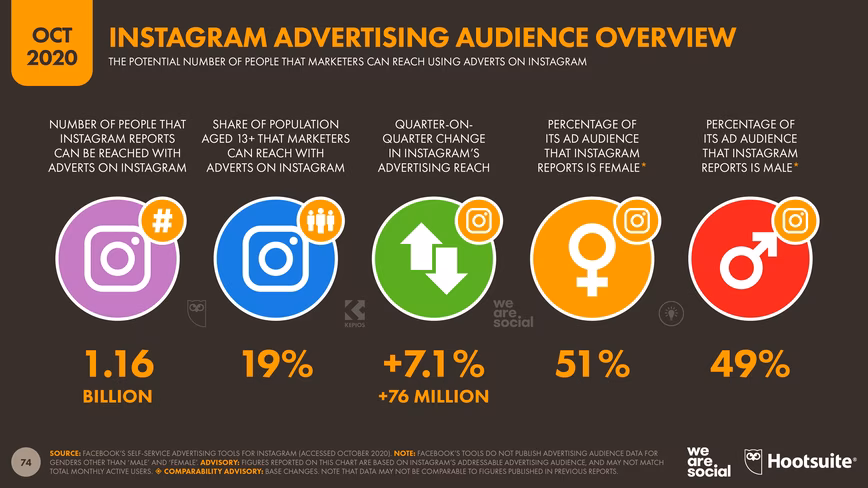
That equates to quarter-on-quarter growth of more than 7%, and extends the impressive 11% jump that we reported for the platform in our July report.
For context, Facebook’s global advertising audience grew by just 45 million during the same period, although its total advertising audience of 2.14 billion is still almost twice the size of Instagram’s.
However, if Instagram can maintain similar momentum over the coming weeks, there’s a good chance that the platform will overtake WeChat to host the world’s fifth-largest social media audience sometime in 2021.
Tencent reported quarterly growth of just 0.3% across the combined audiences of WeChat and Weixin in its latest earnings announcement, which means that Instagram is currently growing around 20 times faster than China’s top platform.
But Instagram isn’t the only platform enjoying rapid growth.
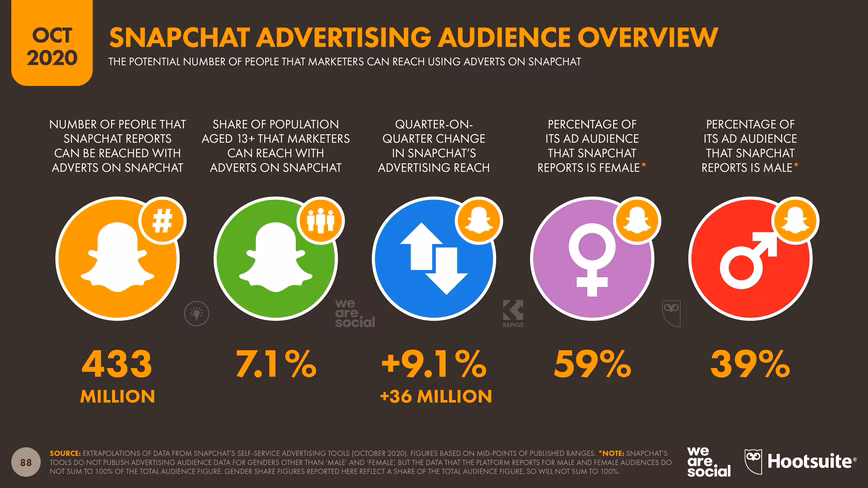
Snapchat posted the largest relative gains this quarter, with advertisers now able to reach over 9% more people via the platform than they could just three months ago.
The addition of 36 million new users between July and September takes Snapchat’s global advertising audience to 433 million, which is 20% larger than the audience the company’s tools were reporting this time last year.
With 16 million new users, India accounted for almost half of Snapchat’s global growth this quarter, perhaps as a result of the Indian government’s recent TikTok ban.
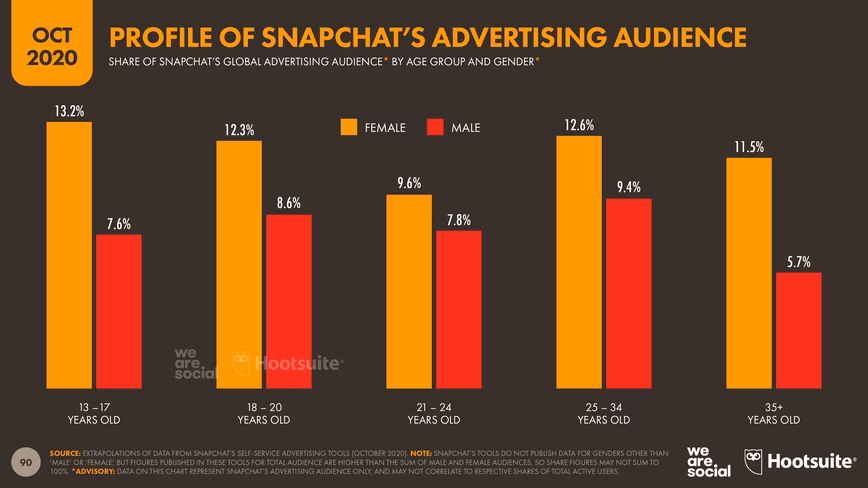
Snapchat has also seen an interesting shift in the demographics of its global user base over the past few months.
Young women between the ages of 13 and 17 now account for the largest share of the platform’s advertising audience, whereas women aged 25 to 34 were the largest demographic this time three months ago.
Twitter’s tools also reported impressive audience growth over the three months to October, but the addition of 27 million users doesn’t even recover half of the 61 million users that the platform lost during the previous quarter.
The story for TikTok is a little more complicated.
As we noted in our July Statshot Report, the Indian government banned the platform at the end of June, and as a result, more than 200 million users have been wiped from the platform’s audience.
However, despite this significant roadbump – and the ongoing uncertainty surrounding its prospects in the United States – TikTok still managed to add more than 80 million new users outside of India between July and September 2020.
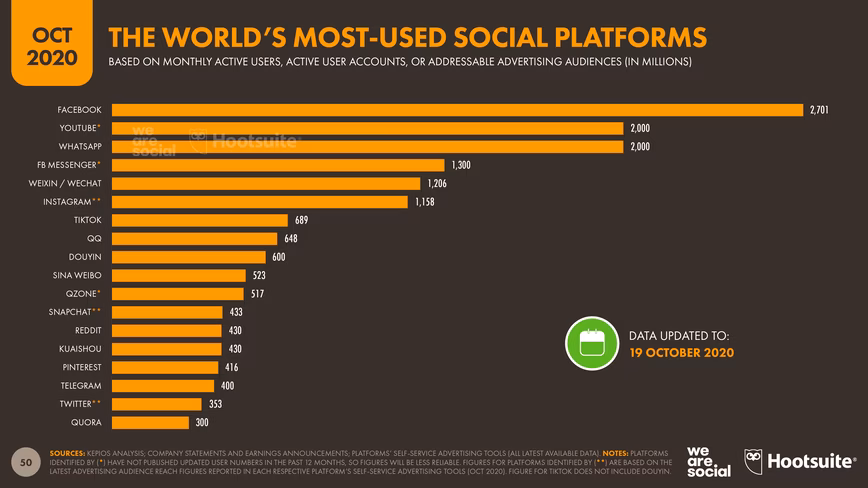
The latest ‘official’ numbers put TikTok’s worldwide audience at 689 million, but recent growth trends suggest that this figure may have already passed the 700 million mark.
If you’d like to dig deeper into the demographics of each of these audiences, and find fresh figures for Facebook, LinkedIn, Pinterest, and various other platforms, you’ll find plenty more platform data in our full report.
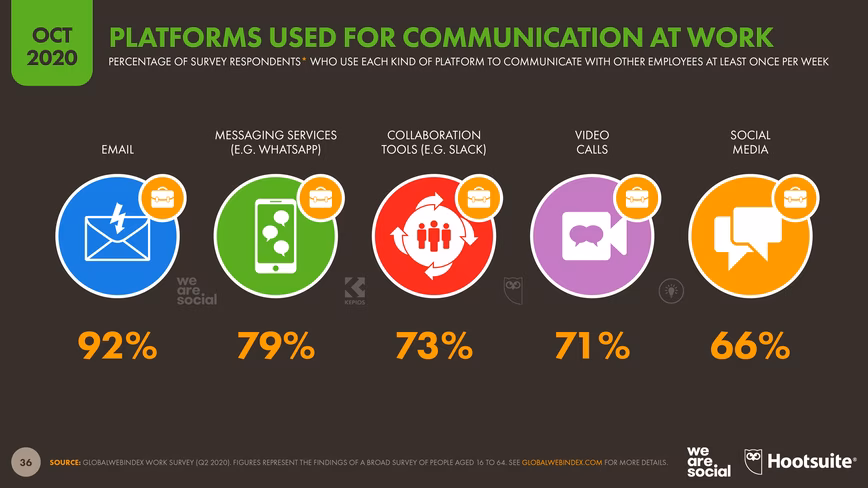
Special focus: digital in the workplace
GlobalWebIndex has just released an update to its hugely valuable Work research, and they’ve generously allowed us to share some highlights from that in this quarter’s report.
One of the most important findings in this dataset is that age plays a critical role in determining how people like to communicate in the workplace, whether that’s with their colleagues, with partners and suppliers, or with customers and the outside world.
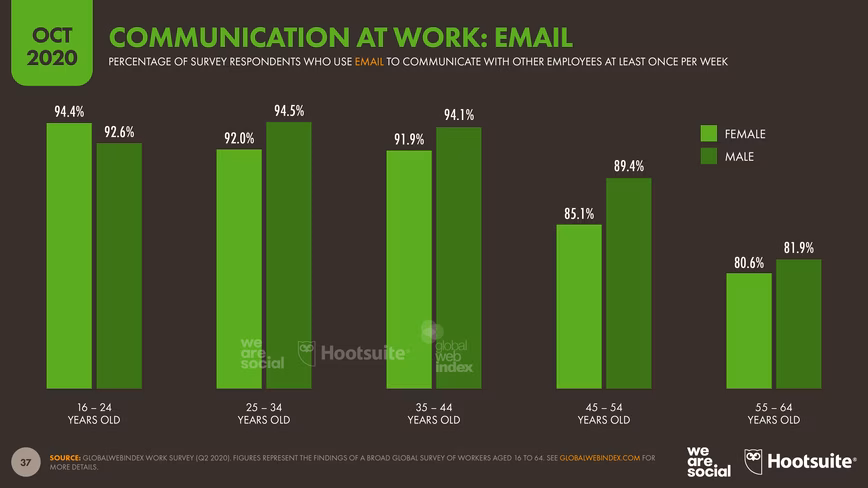
Email remains one of the most widely used channels for communication at work, but even here, age plays a primary role in both adoption and use.
More than 90% of respondents below the age of 45 use email each week, but almost 1 in 5 respondents aged between 55 and 64 say that they use email less than once per week.
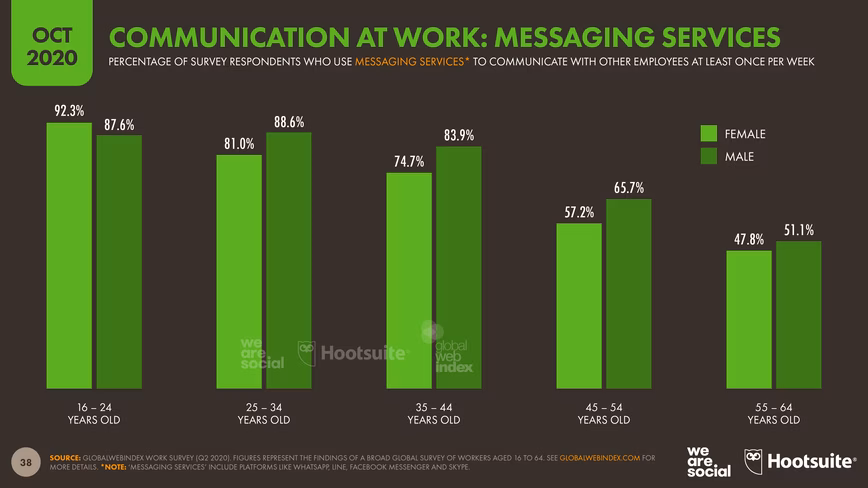
But this ‘age gap’ is even more apparent when we look at more recent additions to the communications mix.
Roughly 9 in 10 Gen Z respondents say that they use messaging platforms like WhatsApp and Slack to communicate with their colleagues each week, but barely half of respondents aged 55 to 64 have integrated these platforms into their regular repertoires.
Interestingly, some of the biggest disparities relate to the use of social media.
More than 4 in 5 workers aged 16 to 24 say that they connect with colleagues via social media platforms each week, but that figure drops to less than 1 in 3 amongst Baby Boomers.
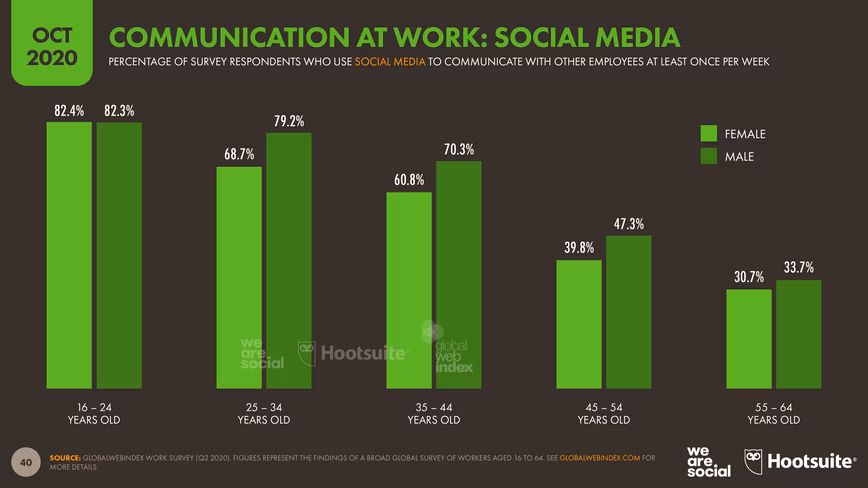
Meanwhile, despite accounting for the largest group of social media users when it comes to their personal lives, people aged 25 to 34 are actually less likely to use social media to communicate with their colleagues than people aged 16 to 24.
These findings have critical implications for organizations everywhere, because they highlight important differences in the ways that people of different ages – and at different levels of the organization – communicate.
Without careful management, these varying preferences could lead to ‘siloed’ communication, resulting in knowledge gaps and cultural divides across different parts of the organization.
Reach in context: ‘users’ versus ‘visitors’
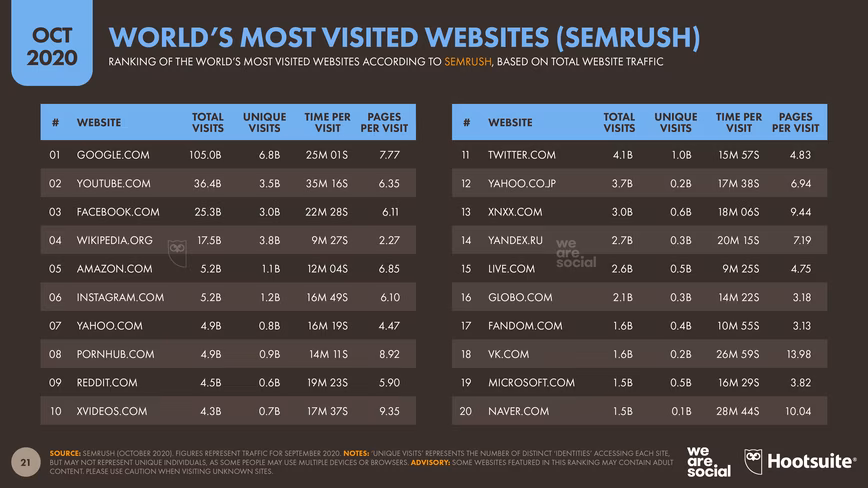
Data from our new partners SEMrush offers valuable new insights into the audiences of some of the world’s top websites and social platforms.
One of the most interesting take-aways from this data is that platforms like YouTube and Twitter continue to attract significant numbers of visitors who don’t log in in order to use each service.
For example, YouTube reports a logged in audience of 2 billion users each month, but the ‘unique visits’ column in the table below indicates that the platform’s total monthly user base is likely to be significantly higher than that.
It’s worth noting that there may be some duplication even in these ‘unique visits’ figures, because there’s no practical way to account for people who access each platform via different devices or browsers, unless they log in.
However, these figures echo analysis we’ve conducted using other datasets, and they reinforce our hypothesis that YouTube’s monthly audience is actually closer to 3 billion – or perhaps even higher.
That would mean YouTube’s audience is potentially 50% larger than its logged-in figures suggest.
But the ‘signed in gap’ may be even greater for Twitter.
The company’s latest advertising audience data suggest that around 350 million people use Twitter while logged in each month.
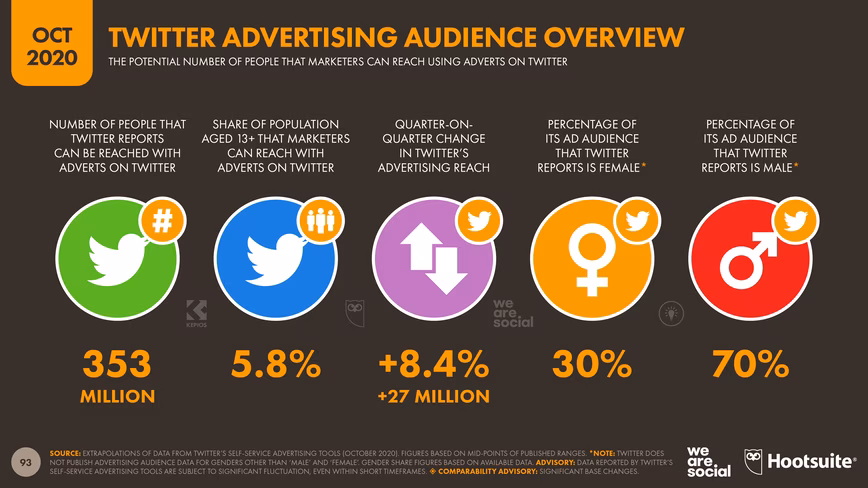
However, the latest data from SEMrush indicates that nearly three times as many people visit Twitter’s website each month.
While that might sound surprising, our hypothesis is that a significant proportion of these ‘anonymous’ visitors treat Twitter like a news website.
Because most tweets are accessible to people even without them logging in, there’s perhaps less incentive for more ‘passive’ visitors to create a Twitter account, or to sign in even if they have one.
However, this raises important questions about Twitter’s role and positioning, both as a company, and within the marketing mix.
Overall, my sense is that the media – and perhaps even investors – continue to underestimate Twitter’s value as a communications channel, and we may need to rethink where Twitter fits in our plans in order to appreciate its full potential.
But it’s not just Twitter that we may be underestimating.
SEMrush’s figures also reinforce a finding that we’ve highlighted in previous reports: Yahoo! is still one of the web’s top properties.
Indeed, the latest data show that Yahoo! still attracts roughly 1 billion unique visits across its .com and .co.jp domains each month, with these visitors engaging in roughly 100 billion ‘sessions’ each year.
Reach isn’t the only factor that marketers should consider when building their plans of course, but with these numbers suggesting that Yahoo! still attracts a larger audience than TikTok, perhaps it’s one to add back onto your list – especially if you’re hoping to reach older audiences.
Once again though, Yahoo! and Twitter may not be the only things we’re underestimating.
Video games: marketing’s biggest missed opportunity?
Video games are one of the world’s favorite pastimes, but – for some inexplicable reason – they remain one of the most under-appreciated opportunities in marketing.
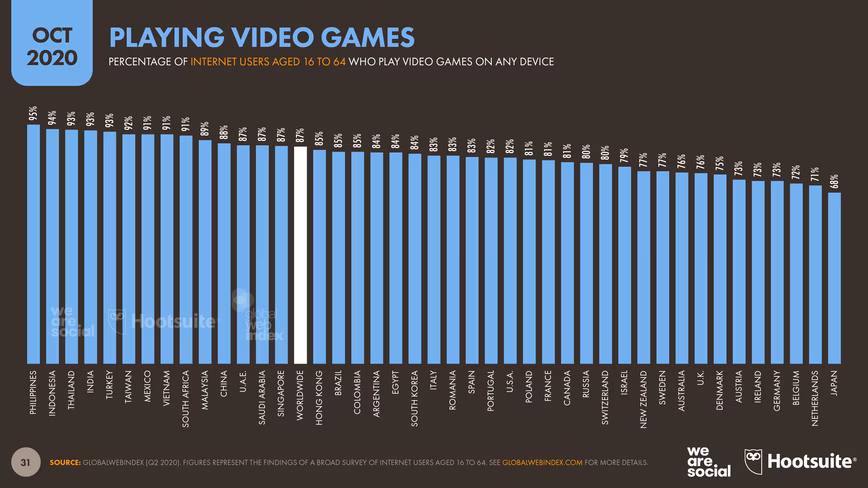
For context, GlobalWebIndex reports that 6 in 7 internet users around the world play games.
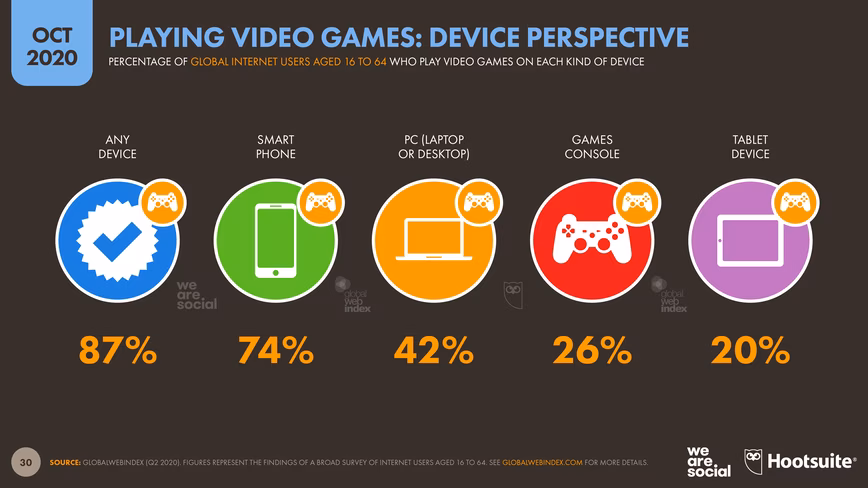
These findings suggest that around 3½ billion people around the world play video games today, with three-quarters of these people playing games on their smartphones.
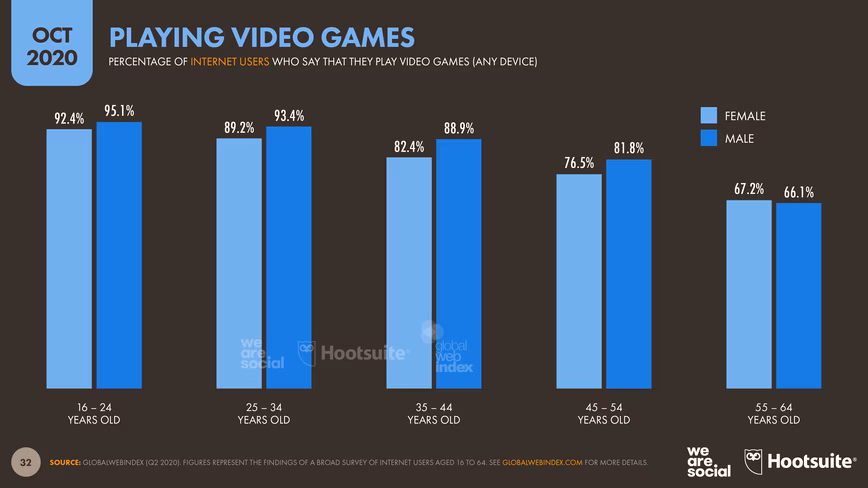
What’s more, gaming’s popularity is consistently high across all countries, and across age groups.
More than two-thirds of connected Baby Boomers play video games, with women aged 55 to 64 even more likely to be gamers than their male peers.
And while men slightly outnumber women in other age groups, the latest data clearly burst the stereotype of gaming being a male-dominated activity.
Indeed, video game adoption amongst women only trails men by a couple of percentage points, and these gender ratios are broadly the same as the ones we see in social media use.
However, it is interesting to note that Europe and the USA see lower levels of video game adoption compared to the rest of the world.
Moreover – and perhaps surprisingly – Japan sees the lowest levels of video gaming of any country in GlobalWebIndex’s survey, but even here, more than two-thirds of internet users report playing games.
So how can brands take advantage of these opportunities?
Online gaming options may be more fragmented than ‘super platforms’ like YouTube or Facebook, but various ad platforms already enable marketers to reach and engage huge audiences across a variety of gaming titles at once.
Furthermore, with the sophistication of video games continuing to advance and people spending ever more time watching others play games, marketing opportunities aren’t limited to interruptive ads.
So, if you’re looking for new opportunities in 2021, I’d strongly encourage you to spend some time exploring what video games have to offer.
Digital ads: still a bargain?
The latest Kenshoo Quarterly Trends Report shows that digital ad spend took another knock in Q2, with both search and social media spend seeing year-on-year declines.
Global spend on online search advertising was down by 9% compared to the same period last year, while social media ad spend was down by 13%.
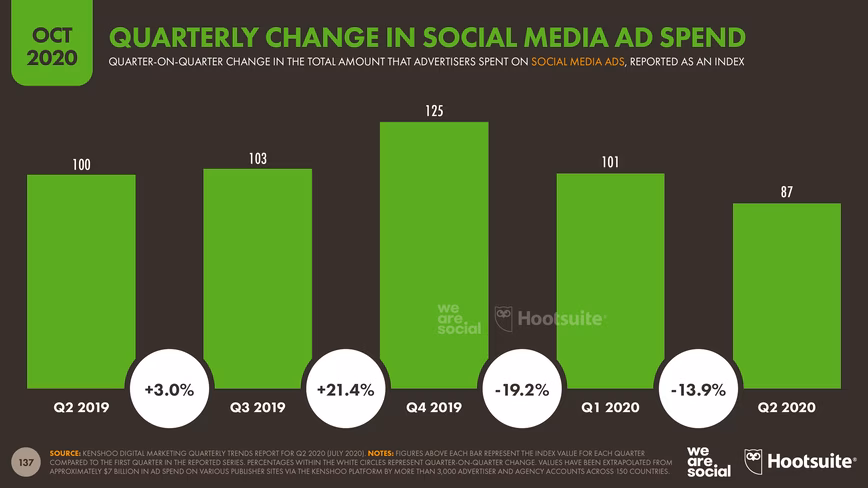
However, Kenshoo reports that there were already signs of a recovery in ad spend by the end of Q2.
Moreover, people clicked on a significantly greater number of ads between April and July 2020 than they did in the same period a year before.
The total number of clicks on social media ads in the second quarter of this year was 33% higher than Q2 2019 levels, while clicks on search ads increased by 28%.
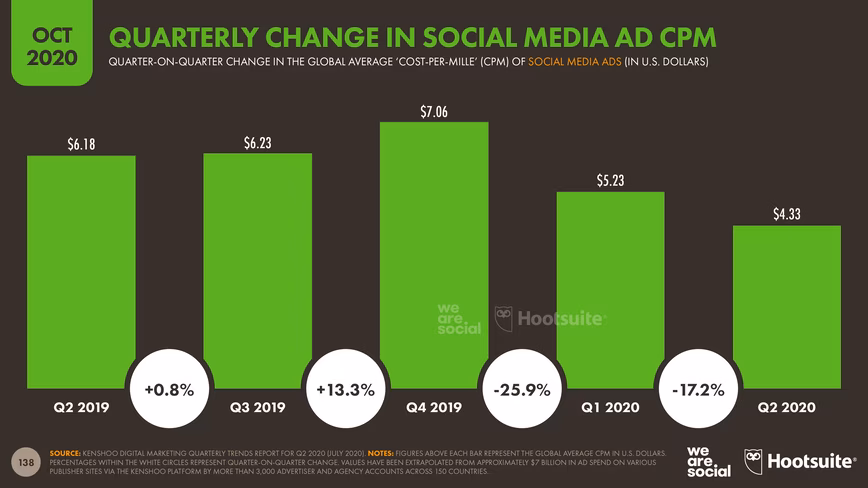
And what’s more, the cost of individual ad units actually decreased significantly during the same period.
The average cost to reach 1,000 people (CPM) via social media ads fell by 305 between Q2 2019 and Q2 2020, while the average cost-per-click (CPC) on search engines fell by 29%.
But these ‘bargain prices’ may not last.
With many companies now significantly more dependent on ecommerce than they were this time last year, brands should expect higher prices and greater competition as we approach Single’s Day and ‘BFCM’ sales, as well as the all-important holiday season.
But what about next year?
Looking ahead: 5 trends for 2021
This is our last Statshot report for 2020, so let’s wrap things up by looking ahead to next year.
What can marketers expect in 2021? Here are some of the trends we’re watching:
- Evolving search behaviors: more than two-thirds of the world’s internet users already go beyond search engines when they’re researching products and services to buy, but we expect voice search, image search, and social search to play an even more important role over the coming months.
- A rebalancing of digital audience demographics: with COVID-19 acting as a catalyst to bring many more older people online, organizations can now use digital to reach a wider variety of audiences than ever before. This represents a clear and immediate opportunity for marketers, especially when it comes to ecommerce. However, this broadening of online audiences may also trigger a new wave of digital innovation, resulting in new platforms, new services, and even new devices.
- Increased globalization in ecommerce: we’ve been tracking ‘the rise of the East’ for some time now, and the latest data suggest that China’s ecommerce giants are gaining ever more popularity amongst international shoppers. What’s more, with affordable cross-border logistics increasingly within reach even for smaller merchants, we can expect to see shoppers looking for deals and unique products wherever the web takes them. Scale will still be an advantage, but unique offerings and differentiated shopping experiences hold the key to enduring success.
- Useful augmented reality: AR has been bubbling away in the background for a number of years now, but it still feels like it hasn’t reached its full potential. However, with mainstream brands like Nike, IKEA, and Estée Lauder increasingly harnessing AR functionality – and with Apple actively touting the AR performance of its new iPhone 12 – perhaps 2021 will be the year AR finally comes of age. Marketers need to go beyond novelty though, and use AR to deliver tangible utility and value. Think ‘help’, not ‘hype’.
- The next disruptive innovation: it’s been well over a decade since social media and smartphones drove the last wave of large-scale marketing disruption, and it feels like the ‘next big thing’ is long overdue. There are a few interesting contenders, from connected ‘smart’ glasses, to decentralized finance, or perhaps some kind of wearable or smart home device. However, these things have been around in some form for a few years already, and current momentum doesn’t point to any of them breaking through to become globally mainstream in 2021. As a result, it’s more likely that the real disruptor will be something unexpected.
Any trends or forecasts you’d add to this list? Let me know on Twitter or LinkedIn.
Don’t forget that you can find all my articles here and all of our previous reports in our free DataReportal library, which also includes local reports for more than 230 countries and territories.
That’s all for this quarter though; I’ll be back with our annual flagship Global Digital report in late January, and our Digital 2021 local country reports starting in mid-February.
Get the TNW newsletter
Get the most important tech news in your inbox each week.