In this series of blog posts I’d love to give some small insights into how we approach marketing at The Next Web: Web analytics, SEO, CRO, etc.. In this first blog post I’ll focus on the toolkit that we use to analyze user engagement.
With millions of pageviews (and growing) on a monthly basis on The Next Web, it’s becoming an increasing challenge to streamline the flow of all the data we available for marketing purposes. One of the challenges we came across is that we wanted to be able to generate heat maps for every page on The Next Web. Not only is this a very effective method to gather insights into how visitors navigate and engage with our content, but advertisers also like to know what the triggers are in their native advertising campaigns.
Our challenge
Obviously we’re not the only site in the world to use heat maps to analyze user interaction, and we didn’t set off trying to reinvent the wheel. However, as The Next Web generates between 15-20 million click events on a monthly basis across 100.000+ pages on hundreds of different devices, browsers and screen sizes, that creates quite a challenge and involves high costs (which need to be justified, of course). So when we decided we wanted a tool, we had a couple of requirements:
- Be able to create unlimited heat maps per template or for a specific page.
- Cheap and accessible data storage for long-term analysis.
- Handle 15,000,000+ click events across 100,000+ pages monthly.
- Segment click events by device/ browser and screen size.
- Flexible, if we want to store more contextual data later.
- Have access to the raw data of click events.
Most tools we looked at did qualify for the majority of requirements, but were too expensive; we don’t use the data on a daily basis (yet) but would like to have access to it in the long run for analysis. So having to spend hundreds or thousands of dollars on a solution that wasn’t flexible enough for us in the long run wasn’t an option. The answer we found was, and turned out to only cost us 75 dollars a month for a server.
Creating our own setup
Pretty soon after exploring the existing tools, we found an open source version to create heat maps based on click data. As we like to get our geek on at The Next Web we love using open source tools.
Technical setup:
So a big shout out to Shutterstock which open-sourced its heat map toolkit years ago. The company blogged about its setup roughly a year ago on the engineering blog. When I found the blog post, I was amazed by how easy their setup actually was. Of course the company put a lot of effort into creating the initial idea but setting this up was actually really easy using Shutterstock’s setup guide.
Together with our back-end developer Raoul, we sat down and found out we could easily set this up in our current environment. Within five days we had a working setup running in production.
We save the data (in real-time via Node.JS) to a separate server (at Rackspace) and import and index the data on a daily basis to our Solr instance to make the data accessible. After that the data is available through a Chrome extension for team members to plot the heat maps on our actual pages. Making it very easy to access whenever needed.
How do our users benefit from the data?
At The Next Web we do a lot of A/B testing; on a weekly basis around 5–10 tests are running. We continuously iterate, making sure we improve the personalization and increase engagement with our users as click data is one of the most valuable sources in knowing whether a proposed change will work or not.
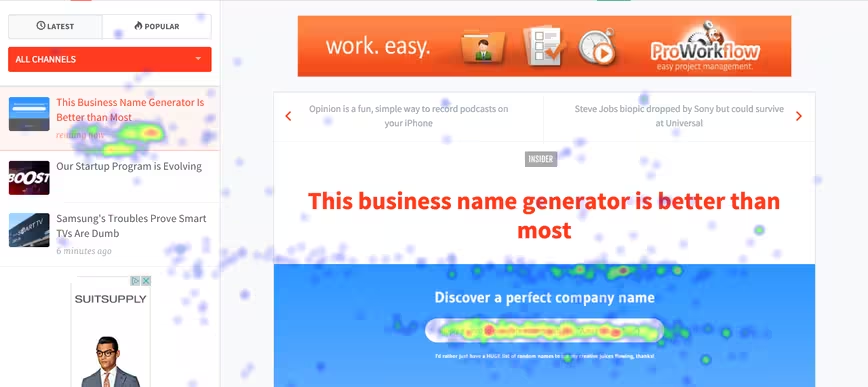
Next to the event tracking that can be found on almost every element, we also want to make sure we’re able to track click events that we can’t see in these reports. Who would have figured that the header image we used in the provided example would drive so many clicks. Now we know, based on the heat maps available to us.
So only on this page we could decide to run an A/B test on the headline image to see how that will influence user behaviour on the rest of the page.
What’s next?
At the moment we’re working on a new iteration of the setup which will include having access to real-time data, adding more context to click events, being able to segment on running A/B tests and backing up our data for the long run (and security).
After that we’ll have to explore any potential use cases that we‘re currently missing. Suggestions here are welcome!
Just like Shutterstock, we do have the ambition to open source the improvements we made on the toolkit to let other people contribute and benefit from it as well. I hope to update this post very soon with a link to an updated GitHub repository.
I’d love to hear from other companies or people on how they approach their set ups on high traffic/ engagement sites for gathering click data and / or how you use the data in your company to come up with new ideas to improve user experience.
In the next post in this series, we’ll share some interesting insights into how we approach on A/B testing.
This is a #TNWLife article, a look into life and work at The Next Web.
Get the TNW newsletter
Get the most important tech news in your inbox each week.