
| This post is brought to you by Simply Measured. |
Publishing content on the Internet generates reams (or, rather, spreadsheets) of data. Creators like you have access to unprecedented information about how your content is received and acted upon.
As data gets bigger, more ubiquitous, and more social, you’re right in assuming that at least some of it is important to you and your business. You’re posting regularly and engaged with social media. But are you using it correctly? Getting optimal results for your business? And how, exactly, are you supposed to know?
The trick is to identify specifically what social data is relevant – and to analyze just exactly what that data means. There are a slew of metrics, tools, and services to help you make sense of your business’ social data, as with any other data you’re managing.
As a general rule, seek out rates and more nuanced metrics, avoid overemphasizing simple counts and totals. Here, we highlight five of the most important social media metrics you should be tracking – and they’re not just the usual suspects.
1. Reach
Metric to track: Audience Growth Rate
Tracking benefit: Directly connect social media data with business’ profits
Related metrics: Audience Growth, Total Followers
Thankfully, vague aggregated metrics like Facebook’s “People Talking About This” are disappearing, replaced by more specific break-out categories. One item you should pay attention to is your Audience Growth Rate. A refinement of New Followers or similar stats, expressed in percent-change over time, the growth rate of your audience depicts your social media momentum.
Audience Growth Rate allows you to evaluate marketing efforts over time, without getting distracted by irrelevant information total followers’ numbers. Compare growth-hacking efforts in your business’ infancy with more sophisticated campaigns you’re using today. What events match up with the highest growth-rate periods in your history?
2. Engagement
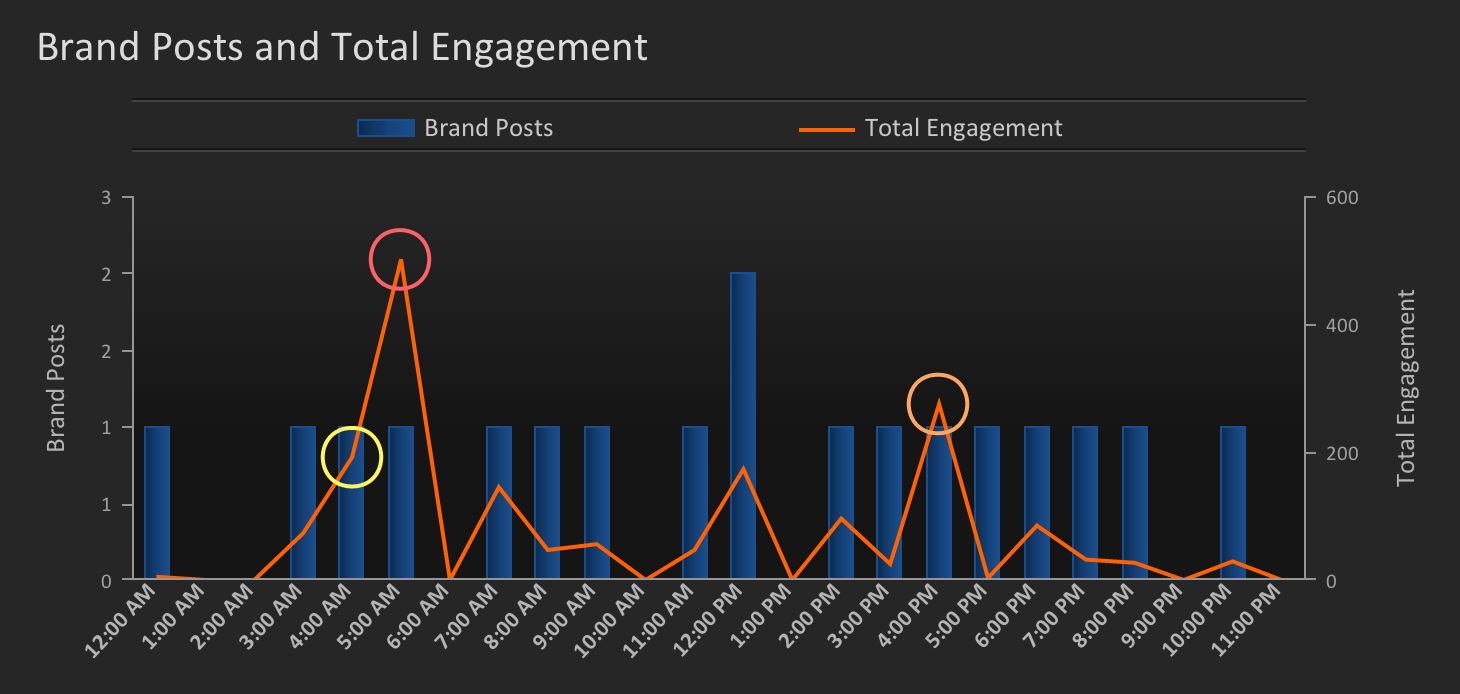
Metric to track: Average Engagement Rate
Tracking benefit: Make engagement numbers meaningful and actionable
Related metrics: Reach, Overall Engagement, Audience Growth Rate
As your Audience Growth Rate follows a positive level of growth, you also need to ensure that you’re speaking to the right people – and that those people are listening.
Average Engagement Rate allows you to check the pulse of your existing network and see how your social media efforts are resonating with this established base. Your average engagement rate compares your posts’ engagement with your overall follower base. Again, numbers like shares, likes, favorites, etc. are great to brag about – and they are informative to an extent. But careful consideration of your audience’s engagement rate lets you highlight your tribe amidst a sea of silent followers.
3. Acquisition
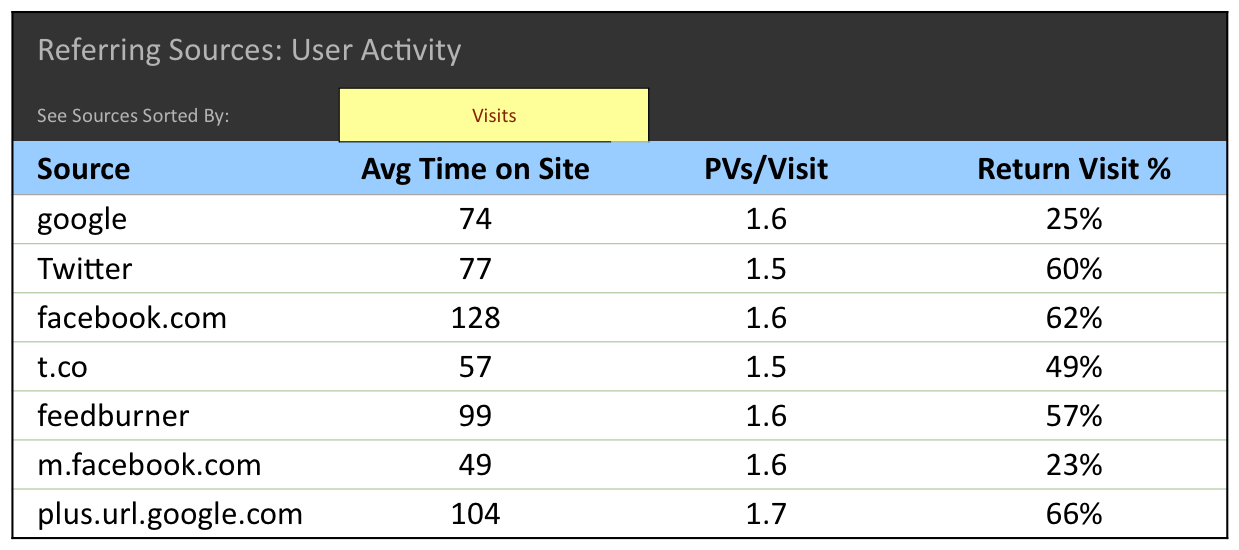
Although total acquisitions from Twitter and Facebook are far lower than from organic Google search, the Return Visit % demonstrates these network’s unique value to your business.
Metric to track: Visitor Frequency Rate
Tracking benefit: Optimize targeting of new and returning visitors
Related metrics: Click-Thru Rate, Impressions from Social Media
Tools like Google Analytics let you track website referral traffic from social media, see what percentage of overall referrals come from social media, and determine the frequency rates of your visitors. This last metric represents the real improvement on standard click-through rates (CTR) numbers.
Visitor Frequency Rate parses viewers into new and return visitors, two particularly valuable groups to understand and target. Return visitor numbers further indicate the depth of engagement and strength of your social networks. New visitors confirm that your more nebulous ‘reach’ and ‘audience’ metrics accurately depict meaningful growth.
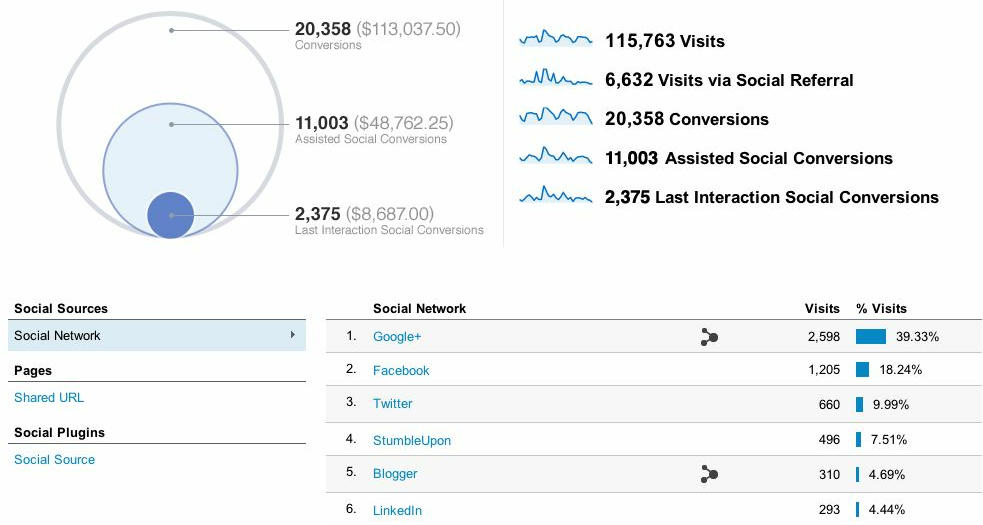
4. Conversion
Metric to track: Assisted Social Conversions
Tracking benefit: Directly connect social media data with business’ profits
Related metrics: Last Click (Direct) Conversions
Beyond getting visitors to your brand’s website and then getting them to return, you should clearly define goals for how you want these visitors to convert into sales or other desired actions. At the same time, incessantly pushing your product is one of the surest ways on social media to lose your audience.
Direct click-conversion metrics might not show the value of your efforts to build trust and influence on social media, but Assisted Social Conversions certainly can. By defining specific conversion goals on Google Analytics and related tools, you can follow visitors referred through social channels and track their conversions over a period of time. Perhaps your witty tweet today won’t make a sale, but you do end up with potential customers more likely to revisit your site. Now you can chart when that rapport pays off for your business.
Comparing Assisted Social Conversions with Last Click (Direct) Conversions also identifies which social networks are better at courting your specific customers, and which ones are more suited for sealing the deal.
5. Activity
Metric to track: Customer Service Savings
Tracking benefit: Show impact on business’ bottom line
Related Metrics: Customer Service Costs, Social Media Posts
Go beyond post counts and content types to connect social media activity with profits. Combine your social media data with other data related to your business, and derive information like Customer Service Savings. Your business’ savings from social media equal the average time to complete traditional customer service, multiplied by hourly cost of customer service. Repeated 100 or 1000 times over, this translates to significant savings for your business.
Avg. Time x Costs Per Hour x Customer Service Inquiries Completed = Savings
(If you’d like to get even more precise, subtract out the costs of answering those inquiries through social media)
Those are social media analytics that can drive strategic planning, expressed in terms any business’ decision makers will understand.

Don’t forget some of the core metrics
Metrics to consider: Bounce Rate, Click-Thru Rate, Potential Reach, Influence
Tracking benefits: Familiar, Easy to communicate
Metric limitations: Limited ability to inform decisions
If you’re wondering how some of the buzzword metrics managed to stay off the list so far, it’s because they’re here, relegated to their appropriate, lesser status. Yes, these are some of the most obsessed-over metrics. They’re also some of the least helpful.
Bounce Rate
For your business’ website, you likely monitor your Bounce and Click-Thru Rates with great care. In terms of social media, however, you should reconsider before basing too many decisions on that data. Social media users have the shortest attention spans on the already disctraction-rich Internet. If your bonus is tied to a website’s bounce rate, that’s a problem. However, flightiness of social media referrals who wind up on your site is not necessarily a negative. You’re building awareness and loyalty, not selling a novella.
Click-Through Rate
What about that all-important Click-Through Rate (CTR)? Undoubtedly, this is a metric you’re aware of in terms of websites and pay-per-click (PPC) internet advertising. This data is still certainly important – you clearly want your fans and followers on social media to click on links to your website and other items you post. But, in terms of social media metrics, there are a couple of more nuanced options that will serve your business better in understanding its socially connected customers.
Potential reach
Potential reach might be the most tantalizing and misleading metric of all. You can tweet at every pop star about Malala during the Super Bowl, and you’ll still never get anywhere close to those gaudy numbers. No, audience growth and engagement stats, while not as overtly impressive, are the true drivers behind your reach or online presence.

Influence
Similar to ‘potential’ audience, influence scores are simple, sexy and all-too convenient. Touting themselves as the credit-score equivalent to social media relevancy, services like Klout and Kred distill your online influence into a single number. This can be useful for identifying influencers in your industry, amongst competitors, or within your follower base.
The problem is, this statistic is so limited (and the algorithm so complicated) that you can’t use this information to drive other meaningful decisions. Maybe you could brag about the impressive scores for accounts you manage, but you’ll risk making yourself look as ridiculous as this company.
Final thoughts
All social media metrics should be viewed through the lens of your overall business goals. Evaluate these analytics on the basis of how you’re doing in pursuit of those goals, and leverage this information to drive decisions about better positioning your brand in the marketplace. Feel free to celebrate your numerical successes along the way – just make sure you’re getting excited about the most meaningful metrics.
Header image credit: Chukcha / Shutterstock
Get the TNW newsletter
Get the most important tech news in your inbox each week.