
Google has updated the real-time reports in its Analytics service with four improvements. As a Google Analytics user, you can now analyze events in real-time, create shortcuts to your favorite real-time segments, compare real-time filtered data against overall real-time data, and even breakdown real-time traffic by desktop, tablet, or mobile.
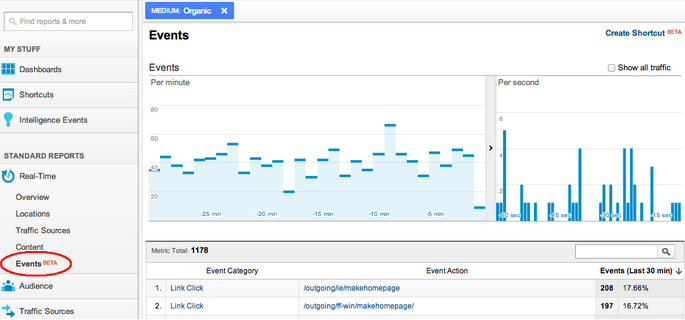
First up is the real-time events report, which lets you not only see the top events as they occur, but also lets you filter on event categories and actions. You can also see whether particular segments of visitors trigger different events and debug your events deployment in real time.
You can click on any of the event categories to see all the actions and labels for it, or set up filters to see what events a particular segment of visitors generate. Here’s how this report looks (real-time section of Google Analytics => Events):
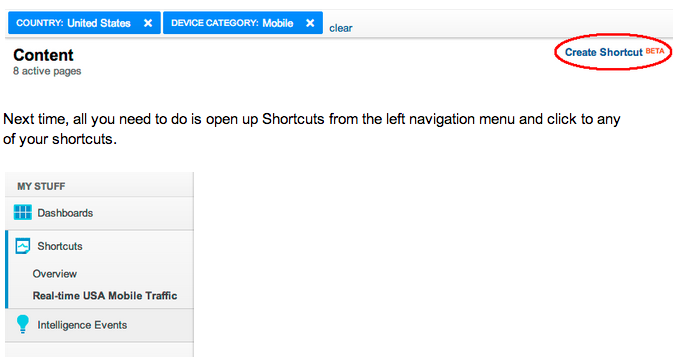
Second on the list is the “Create Shortcut” feature to let you look at certain segments of visitors in real-time without having to set up the filters each time. Then, all you have to is open up Shortcuts from the left navigation menu and click on any of the ones you’ve created.
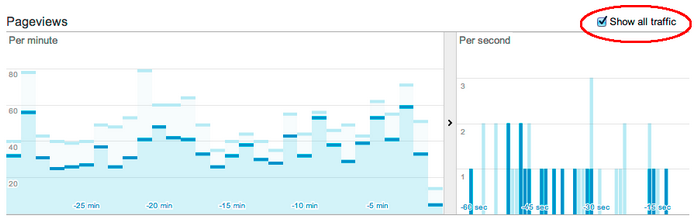
Next up is the new option to compare the pageviews of your segmented visitors to overall traffic, which is useful if you want to see quick comparison trends. Google naturally uses an example of how mobile picks up faster after a Google+ post and also contributes more to the initial increase in pageviews:
Last but certainly not least is the addition of real-time filtering based on the type of device that visitors are using to visit your web site. You can now filter by desktop, tablet or mobile in the content report section:
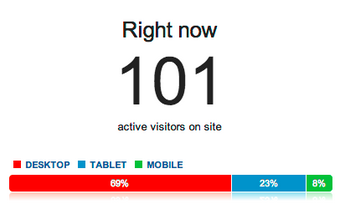
This last one is arguably the biggest addition, as it’s becoming increasingly more important to know whether your site’s users are currently visiting from more than just the desktop platform.
Top Image Credit: Alan Bridges
Get the TNW newsletter
Get the most important tech news in your inbox each week.