Google has announced the new Search Globe platform that will help developers visualize the way that users are searching for information around the globe. You can check out the globe now in this demo that Google has running but you’ll need Google Chrome or another WebGL compatible browser to do so.
Here’s how Google describes the Search Globe’s operation.
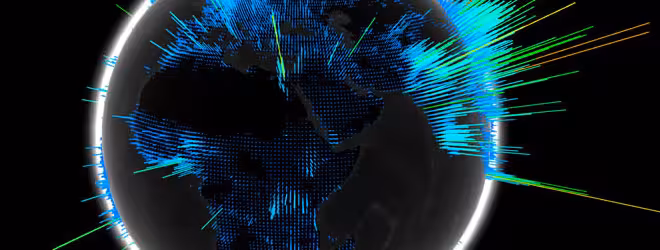
The Search Globe visualizes searches from one day, and shows the language of the majority of queries in an area in different colors. You’ll see a bright landscape of queries across Europe, and parts of Asia for instance, but unfortunately we see many fewer searches from parts of the world lacking Internet access—and often electricity as well—like Africa. We hope that as the Internet continues to become more accessible over time and people continue to ask questions, we’ll see this globe shine brightly everywhere.
The visualization was developed by the Google Data Arts Team using WebGL. This means that you’ll need a WebGL-enabled browser like Chrome to see the effect.
Google has also open sourced the project, giving developers access to the API so that they can build their own globes, visualizing all kinds of data searches. They will have access to features like mapping data spikes to latitude and longitude, color gradients that are based on the amount of searches or the type of searches and the use of the mouse wheel to zoom in and out. Google says that they have more features under development now.
Doug Fritz of the Google Arts Team explains how they managed to draw several thousand 3D data spikes efficiently using Three.js, a JavaScript library that’s used for building 3D graphics.
For each data point, we generate a cube with five faces – the bottom face, which touches the globe, is removed to improve performance. We then stretch the cube relative to the data value and position it based on latitude and longitude. Finally, we merge all of the cubes into a single geometry to make it more efficient to draw.
The potential to help developers and web services understand how searches for their product or service occur around the globe is exciting and the powerful visual effect demonstrates just how cool WebGL can make browser graphics look. For more information about the Search Globe project, check out the posting on the Google Code blog.
Get the TNW newsletter
Get the most important tech news in your inbox each week.